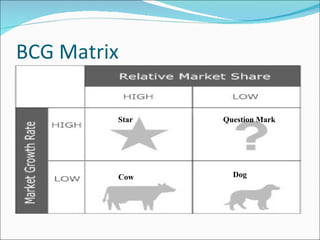
Presented by……….. Fedora D'souza Nitin Jadhav
Introduction Addresses the issue of the potential value of a particular business for the firm.  Used to establish the best mix of businesses in order to maximize the long-term earnings growth of the firm Has two variables:  i)  the potential for generating attractive earnings levels now ii) the potential for growth for significantly increased earnings levels in the future.
BCG Matrix Star Dog Cow Question Mark
Stars High Market Share / High Market Growth Leads to large amount of cash consumption and cash generation.  They require heavy investment, to maintain its large market share. Star products represent, probably the best profit opportunity available to a company, It is the future payoff of the star that counts, not the present reported profit.  Attempts should be made to hold the market share otherwise the star will become a CASH COW.
Cows Low growth, High market share  They are foundation of the company and often the stars of yesterday.  Generate large cash surpluses  Because of the low growth, promotion and placement investments are low. They extract the profits by investing as little cash as possible  They are located in an industry that is mature, not growing or declining.
Question Marks High growth , Low market share  Require more cash than they are able to generate on their own. Absorb great amounts of cash if the market share remains unchanged. Question marks are essentially new products where buyers have yet to discover them. The marketing strategy is to get markets to adopt these products. Need to increase their market share quickly or they become dogs. The best way to handle Question marks is to either invest heavily in them to gain market share or to sell them
Dogs Low growth , Low market share  Dogs are in low growth markets and have low market share. Dogs are the cash traps. Dogs should be avoided and minimized. Expensive turn-around plans usually do not help. Business is situated at a declining stage.
Product Portfolio Matrix: Strategic Consequences
Bharti Airtel Limited a leading emerging market telecom services provider with operations in 19 countries across Asia and Africa. Bharti Infratel Limited is amongst India's leading telecom passive infrastructure service providers.
4 Strategic Sub Units (SBU) Mobile Services Prepaid & Postpaid Blackberry Smartphones International Calling Wireless Internet Digital TV Services Digital TV Recorder  IPTV Enterprise Services Corporate Carriers Telemedia Services Fixed Line Broadband Passive Infrastructure Bharti Infratel Indus Tower Subsidiary
BCG Matrix of Bharti Airtel Ltd SBU :  Enterprise Services SBU :  Passive Infrastructure SBU : Telemedia Services SBU :  Mobile Services
Strategic Business Unit Market Share (SBU) Market Share (Largest Competitor) Relative Market Share Relative Market Share (in BCG Terms) Product Sales Growth (%age change b/w FY 09-10) Quadrant  in which the SBU lies Mobile Services 63.32% Idea Cellular Ltd. - 21.94% 50.12% 2.28 7% Cash Cow Telemedia Services 6.65% Tata Tele services - 20.32% 30.57% 1.5 2% Dog Enterprise Services (Carriers & Corporates) 16.41% Atire Technology - 42.6% 14.50% 0.34 17% Star Passive Infra 13.62% GTL Infra - 28.33% 6.32% 0.22 38% Question Mark
Justification Star Enterprise Services  have been providing lot of amount as per current base but needs investments in the higher proportion due to high growth rate, hence it needs lot of amount to stand the business
Justification for Question Mark Passive Infrastructure  is a very new approach but has been able to hold quick grip in market  Good collaborations like Indus Towers could help them increase their market share if funded adequately
Justification for Cash Cows Mobile Services  has been legacy of Bharti which has been enjoying a greater market share It generates highest revenues among its other SBU’s
Justification for Dogs Telemedia Services  have little potential for gaining sufficient share to achieve feasible cost positions also because of other big players already existing in the market
BCG Matrix and PLC Curve Passive Infra Enterprise Services Mobile Services Telemedia Services
Characteristics and Strategy Implications of Products in the Strategy Quadrants
Company  BAJAJ Gr. Prdt/ser Relative Market share Growth rate in % Sales 2010 (Rs.Crore) Bajaj auto 2&3 wheelers 0.74 16.78 12,767.12 Hero honda 2&3 wheelers 17,138.00 Bajaj Finserv Insurance & Financial services 0.62 23.39 985.41 Bajaj Holding & investment ltd. Insurance & Financial services 1410.17 Mahindra & Mahindra Financial Services Ltd Insurance & Financial services 1,595.60 Bajaj Hindustan Sugar Sugar 0.28 21 422.17 Balrampur chini mills Sugar 1,527.46 Bajaj Electricals Domestic Appliances 0.82 23.28 2,308.02 I F B Industries Ltd. Domestic Appliances 666.08 Whirlpool of India Ltd 2,817.21 Bajaj corp ltd .   Personal Care 0.10 18.4 334.87 Dabur India   Personal Care 3,466.38 Bajaj Steel ltd. Packaging 0.68 8.325 241.13 Karur KCP Packkagings Ltd Packaging 355.74
Company TVS Gr. Prdt/ser Relative Market share GR Rate in % Sales 2010 (Rs.Crore) Sundaram Finance Finance 0.50 39.27 2,035.37 IDFC Finance 4,060.16 Reliance Capital Ltd Finance 2,423.16 TVS motors 2&3 wheelers 0.38 16.78 4,811.40 Bajaj auto 2&3 wheelers 12,767.12 Hero honda 2&3 wheelers 17,138.00 TVS electronics Hardware 0.01 14.93 200.36 Moser baer Hardware 2,370.48 Redington India Hardware 13,982.14 Sundaram Clyaton Brakes 1.69 9.14 5,729.01 Amtek Auto Brakes 3,395.66 Indian Nippon Electricals Electrical 0.03 36.28 191.67 Motherson Sumi Electrical 7,209.63 Minda Industries Ltd Electrical 503.33 TVS Srichakra Ltd Tyres  0.09 23.67 753.61   Apollo Tyres Ltd Tyres  8,414.04 MRF Ltd Tyres  5,966.55
45635468 bcg-presentation-final

45635468 bcg-presentation-final

  • 1.
    Presented by……….. FedoraD'souza Nitin Jadhav
  • 2.
    Introduction Addresses theissue of the potential value of a particular business for the firm. Used to establish the best mix of businesses in order to maximize the long-term earnings growth of the firm Has two variables: i) the potential for generating attractive earnings levels now ii) the potential for growth for significantly increased earnings levels in the future.
  • 3.
    BCG Matrix StarDog Cow Question Mark
  • 4.
    Stars High MarketShare / High Market Growth Leads to large amount of cash consumption and cash generation. They require heavy investment, to maintain its large market share. Star products represent, probably the best profit opportunity available to a company, It is the future payoff of the star that counts, not the present reported profit. Attempts should be made to hold the market share otherwise the star will become a CASH COW.
  • 5.
    Cows Low growth,High market share They are foundation of the company and often the stars of yesterday. Generate large cash surpluses Because of the low growth, promotion and placement investments are low. They extract the profits by investing as little cash as possible They are located in an industry that is mature, not growing or declining.
  • 6.
    Question Marks Highgrowth , Low market share Require more cash than they are able to generate on their own. Absorb great amounts of cash if the market share remains unchanged. Question marks are essentially new products where buyers have yet to discover them. The marketing strategy is to get markets to adopt these products. Need to increase their market share quickly or they become dogs. The best way to handle Question marks is to either invest heavily in them to gain market share or to sell them
  • 7.
    Dogs Low growth, Low market share Dogs are in low growth markets and have low market share. Dogs are the cash traps. Dogs should be avoided and minimized. Expensive turn-around plans usually do not help. Business is situated at a declining stage.
  • 8.
    Product Portfolio Matrix:Strategic Consequences
  • 9.
    Bharti Airtel Limiteda leading emerging market telecom services provider with operations in 19 countries across Asia and Africa. Bharti Infratel Limited is amongst India's leading telecom passive infrastructure service providers.
  • 10.
    4 Strategic SubUnits (SBU) Mobile Services Prepaid & Postpaid Blackberry Smartphones International Calling Wireless Internet Digital TV Services Digital TV Recorder IPTV Enterprise Services Corporate Carriers Telemedia Services Fixed Line Broadband Passive Infrastructure Bharti Infratel Indus Tower Subsidiary
  • 11.
    BCG Matrix ofBharti Airtel Ltd SBU : Enterprise Services SBU : Passive Infrastructure SBU : Telemedia Services SBU : Mobile Services
  • 12.
    Strategic Business UnitMarket Share (SBU) Market Share (Largest Competitor) Relative Market Share Relative Market Share (in BCG Terms) Product Sales Growth (%age change b/w FY 09-10) Quadrant in which the SBU lies Mobile Services 63.32% Idea Cellular Ltd. - 21.94% 50.12% 2.28 7% Cash Cow Telemedia Services 6.65% Tata Tele services - 20.32% 30.57% 1.5 2% Dog Enterprise Services (Carriers & Corporates) 16.41% Atire Technology - 42.6% 14.50% 0.34 17% Star Passive Infra 13.62% GTL Infra - 28.33% 6.32% 0.22 38% Question Mark
  • 13.
    Justification Star EnterpriseServices have been providing lot of amount as per current base but needs investments in the higher proportion due to high growth rate, hence it needs lot of amount to stand the business
  • 14.
    Justification for QuestionMark Passive Infrastructure is a very new approach but has been able to hold quick grip in market Good collaborations like Indus Towers could help them increase their market share if funded adequately
  • 15.
    Justification for CashCows Mobile Services has been legacy of Bharti which has been enjoying a greater market share It generates highest revenues among its other SBU’s
  • 16.
    Justification for DogsTelemedia Services have little potential for gaining sufficient share to achieve feasible cost positions also because of other big players already existing in the market
  • 17.
    BCG Matrix andPLC Curve Passive Infra Enterprise Services Mobile Services Telemedia Services
  • 18.
    Characteristics and StrategyImplications of Products in the Strategy Quadrants
  • 19.
    Company BAJAJGr. Prdt/ser Relative Market share Growth rate in % Sales 2010 (Rs.Crore) Bajaj auto 2&3 wheelers 0.74 16.78 12,767.12 Hero honda 2&3 wheelers 17,138.00 Bajaj Finserv Insurance & Financial services 0.62 23.39 985.41 Bajaj Holding & investment ltd. Insurance & Financial services 1410.17 Mahindra & Mahindra Financial Services Ltd Insurance & Financial services 1,595.60 Bajaj Hindustan Sugar Sugar 0.28 21 422.17 Balrampur chini mills Sugar 1,527.46 Bajaj Electricals Domestic Appliances 0.82 23.28 2,308.02 I F B Industries Ltd. Domestic Appliances 666.08 Whirlpool of India Ltd 2,817.21 Bajaj corp ltd .   Personal Care 0.10 18.4 334.87 Dabur India   Personal Care 3,466.38 Bajaj Steel ltd. Packaging 0.68 8.325 241.13 Karur KCP Packkagings Ltd Packaging 355.74
  • 21.
    Company TVS Gr.Prdt/ser Relative Market share GR Rate in % Sales 2010 (Rs.Crore) Sundaram Finance Finance 0.50 39.27 2,035.37 IDFC Finance 4,060.16 Reliance Capital Ltd Finance 2,423.16 TVS motors 2&3 wheelers 0.38 16.78 4,811.40 Bajaj auto 2&3 wheelers 12,767.12 Hero honda 2&3 wheelers 17,138.00 TVS electronics Hardware 0.01 14.93 200.36 Moser baer Hardware 2,370.48 Redington India Hardware 13,982.14 Sundaram Clyaton Brakes 1.69 9.14 5,729.01 Amtek Auto Brakes 3,395.66 Indian Nippon Electricals Electrical 0.03 36.28 191.67 Motherson Sumi Electrical 7,209.63 Minda Industries Ltd Electrical 503.33 TVS Srichakra Ltd Tyres  0.09 23.67 753.61   Apollo Tyres Ltd Tyres  8,414.04 MRF Ltd Tyres  5,966.55