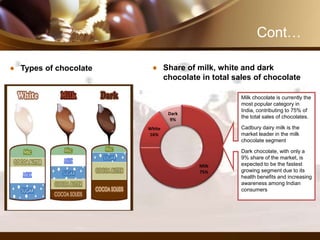
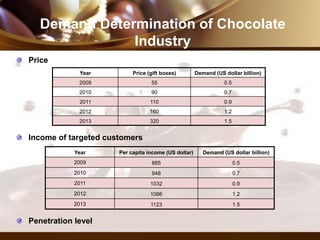
Chapters
• Research Methodology
• Study of Global Market
• Study of Indian Market
• Product Profile
• Demand Determination of Chocolate Industry
• Distribution channel in chocolate industry
• Key issues & current trends
• PEST analysis
• Michel Porter’s Five Force Model
• Other Portfolio Model
• Financial Analysis
• Opportunity & Threat Analysis
• Findings
• Bibliography
Research Methodology
Objective
Main objective:
•To study the macro environment factors affecting chocolate industry
Sub-objective:
•To study the characteristics of chocolate industry
•To study political, economic, social and technological factors affecting chocolate industry
•To study opportunities and threats for the chocolate industry
•To find out the global trends in production, consumption, product development and Marketing
•To analyze driving forces for the chocolate industry
•To identify the porter’s five forces and its impact on chocolate industry
•To draw conclusion from the BCG Matrix
•To identify the level of competition between different players in chocolate industry
•To find out the key success factor in chocolate industry
•To analyze the value chain of chocolate industry
Cont…
Research design Exploratory
Data collection & sources Secondary data
Analysis plan
• PEST Analysis
• Michel Porter’s Five Force Model
• BCG Matrix
• Strategic Group Mapping
• GE Nine-Cell
• Driving Forces
• Key Success Factors
• Value Chain Analysis
Limitations
• The whole study is based on secondary data
• It is assumed that whole data is authenticated and on that basis conclusion is derived. So
it is may possible it is not in proper manner
• The level of reliability may be less as it is based on secondary data
• Financial data of some companies were not available at the time of the study
Study of Global Market
Market size
Global chocolate market will grow to $98.3
billion in 2016 from the 85 billion it was at in
2013
CAGR
21%
12% 11%
9%
8%
7%
4%
0%
5%
10%
15%
20%
25%
India Latin
America
Brazil China Russia Eastern
Europe
Mexico
Compound Annual Growth Rate
Per Capita Chocolate Consumption, by
country (2014)
Country Per Capita Consumption (Kg)
Switzerland 9
Germany 7.9
Austria 7.8
Ireland 7.5
United Kingdom 7.5
Norway 6.6
Estonia 6
Slovakia 5.4
Sweden 5.4
Kazakhstan 5.3
• India - about 120 gm in 2013
Cont…
Segment of the chocolate industry
The market is segmented into various products such as,
 Dark chocolate
 Milk chocolate
 White chocolate
Additionally, the market is segmented based on sales frequency such as
 Daily chocolate
 Premium chocolate
 Seasonal chocolate
Cont…
Main manufacturers of chocolate in the world
Company
Net Sales 2013 (US$
millions)
Mars Inc (USA) 17,640
Mondelēz International Inc (USA) 14,862
Nestlé SA (Switzerland) 11,760
Meiji Holdings Co Ltd (Japan) 11,742
Ferrero Group (Italy) 10,900
Hershey Foods Corp (USA) 7,043
Innovation
•Personalizing chocolate
•The 3D printing revolution
Cont…
Cocoa suppliers
Major cocoa producing countries in each region include:
Africa: Côte d’Ivoire, Ghana, Nigeria, Cameroon
Asia/Oceania : Indonesia, Malaysia, Papua New Guinea
Americas : Brazil, Ecuador, Colombia
Africa
68%
Americas
15%
Asia
17%
Global Cocoa Production
www.worldcocoa.org
Study of Indian Market
India's chocolate market is estimated at around Rs 3,000 crore
The overall chocolate market is growing 15% a year
According to India Chocolate Market Forecast & Opportunities,
2018, the per capita consumption of chocolates is increasing in
the country which will continue to flourish the market revenues
Continuous rise in per capita income, changing consumer
preferences and growing gifting tradition are boosting chocolate
consumption in India
Consumer preferences in India have gradually transitioned from
traditional sweets to chocolates over the last couple of decades
Cont…
Market share of major players
Mondelez
India
62%Nestle,18%
Mars, 6%
Ferrero,3%
Amul, 3%
Others, 8%
India Chocolate Market Share. Source: ValueNotes
India’s chocolate sales (2008-2018)
Product Profile
Chocolate is a sweet that is thousands of years old, which today is made of the mass
of cocoa beans and cocoa butter obtained by processing roasted cocoa beans and
powdered sugar, in the case of milk chocolate, milk raw material is added to the
ingredients.
Ingredients
Chocolate Liquor
Chocolate
Lecithin
Sugar
Cocoa Butter
Vanilla, Fruits, Nuts
Cont…
Types of chocolate Share of milk, white and dark
chocolate in total sales of chocolate
Milk
75%
White
16%
Dark
9%
Milk chocolate is currently the
most popular category in
India, contributing to 75% of
the total sales of chocolates.
Cadbury dairy milk is the
market leader in the milk
chocolate segment
Dark chocolate, with only a
9% share of the market, is
expected to be the fastest
growing segment due to its
health benefits and increasing
awareness among Indian
consumers
Cont…
Manufacturing process of chocolate
Demand Determination of Chocolate
Industry
Price
Year Price (gift boxes) Demand (US dollar billion)
2009 55 0.5
2010 90 0.7
2011 110 0.9
2012 160 1.2
2013 320 1.5
Income of targeted customers
Year Per capita income (US dollar) Demand (US dollar billion)
2009 885 0.5
2010 948 0.7
2011 1032 0.9
2012 1086 1.2
2013 1123 1.5
Penetration level
Distribution channel in chocolate industry
Producer
Wholesaler
Retailer
Consumer
Key issues & current trends
Key issues
• Child Labor and Slavery in the Chocolate Industry
• Rise in price of raw material
Current trends
• Demand for Dark Chocolates
• Consumption of chocolates
• Occasion and celebration
• Packaging
• Premium chocolates
PEST Analysis
Political factor
Increasing price of cocoa
2200
2431
2825
3223
0
500
1000
1500
2000
2500
3000
3500
2011 2012 2013 2014
US Dollars Per Metric Ton
Source:indexmundi.com
Cont…
Increasing price of hazelnut
Cold chain facility
Mandatory Labeling & other FSSAI norms
Encouragement to private sector
Relaxed FDI norms
Incentives for development of storage facilities
Cont…
Conclusion
Factors Favorable Unfavorable
Increasing price of cocoa √
Increasing price of hazelnut √
Cold chain facility √
FSSAI norms √
Encouragement to private sector √
Relaxed FDI norms √
Incentives for development of storage
facilities
√
Cont…
Economical factor
10.26%
6.64%
4.74% 5.02%
5.63%
0.00%
2.00%
4.00%
6.00%
8.00%
10.00%
12.00%
2010 2011 2012 2013 2014*
GDP growth rate
948
1032
1086 1123 1165
0
200
400
600
800
1000
1200
1400
2010 2011 2012 2013 2014
Per Capita Income (US dollar)
Source: tradingecocomics.com
Cont…
11.99
8.86
10.25
9.65
8.28
0
2
4
6
8
10
12
14
2010 2011 2012 2013 2014
Inflation Rate (%)
Source: statista.com
10
9.8
8.5
8.8
8
8
9
9
10
10
11
2010 2011 2012 2013
Unemployment Rate (%)
Source: statista.com
Cont…
Conclusion
Factors Favorable Unfavorable
Gross domestic product √
Per capita income √
Inflation rate √
Unemployment trends √
Socio-cultural factor
Factors Favorable Unfavorable
Age distribution √
Culture √
Eating habits √
Health consciousness √
Technological factor
Personalizing chocolate and the
3D printing revolution are the
technological changes in
chocolate industry
Michel Porter’s Five Force Model
Intensity of rivalry among competitors in an industry
Parameters Description
Very High
(1)
High
(2)
Medium
(3)
Low
(4)
Very Low
(5)
Number of
players
More √
Market growth
rate
High √
Rivals become
equal in size
Yes √
Switching cost of
buyers
Low √
Frequent &
aggressive
moves
Yes √
Cont…
Threat of new entrants
Parameters Description
Very High
(1)
High
(2)
Medium
(3)
Low
(4)
Very Low
(5)
Existing players struggling to earn
good profit
Profit margin is good √
Industry outlook is risky Good future √
Industry growth rate High √
Economies of scale Required √
Access to distribution channel Easy √
Access to raw material Difficult √
Capital requirement High √
Switching cost of buyers Low √
Customer loyalty Low √
Cont…
Threat of substitute products
Parameters Description
Very High
(1)
High
(2)
Medium
(3)
Low
(4)
Very Low
(5)
Availability of
substitute
product
Easily available √
Price of
substitute
product
Low √
Switching
cost
Low √
Cont…
Bargaining power of suppliers (cocoa)
Parameters Description
Very High
(1)
High
(2)
Medium
(3)
Low
(4)
Very Low
(5)
Number of
suppliers
Few √
Price of raw
material
High √
Substitute of
raw material
available
No √
Suppliers are
scattered or
concentrated
Concentrated √
Cont…
Bargaining power of suppliers (Milk powder)
Parameters Description
Very High
(1)
High
(2)
Medium
(3)
Low
(4)
Very Low
(5)
Number of
suppliers
More √
Price of raw
material
Low √
Substitute of
raw material
available
No √
Suppliers are
scattered or
concentrated
Scattered √
Cont…
Bargaining power of buyers
Parameters Description
Very High
(1)
High
(2)
Medium
(3)
Low
(4)
Very Low
(5)
Number of
buyers
Many √
Buyers are
well informed
Yes √
Buyers are
scattered or
concentrated
Scattered √
Buyers are
loyal
No √
Cont…
Conclusion
Rivalry among competitors Very High
Threat of new entrants Medium
Threat of substitute products Very High
Bargaining power of suppliers High
Bargaining power of buyers Low
Competitive
Rivalry
Threat of
new
entry
Buyer powerSupplier
power
Threatof
substitut
e
Other Portfolio Model
BCG Matrix
GE Nine cell matrix
Strategic Group Mapping
Driving force
Key Success Factor
Value Chain Analysis
BCG Matrix
Company
Name
Market
Share (%)
Relative Market
Share (%)
Mondelez India 62 1
Nestle 18 0.29
Mars 6 0.1
Ferreo 3 0.05
Amul 3 0.05
GE Nine cell matrix
Industry Attractiveness
Factors Weight Rating* Industry Atrractiveness Score
Political factor 0.04 6 0.24
Economic factor 0.05 8 0.4
Social factor 0.06 8 0.48
Intensity of competition 0.20 5 1
Market Size 0.15 7 1.05
Projected Growth Rate 0.25 9 2.25
Seasonal influence 0.15 9 1.35
Opportunities 0.06 7 0.42
Threats 0.04 5 0.2
Weighted industry attractiveness
scores
1 7.39
*Rating Scale: 1 = very unattractive , 10 = very attractive
Cont…
Competitive Strength
Factor Weight Rating* Competitive Strengths
Mondelez Nestle Mars Ferrero Amul Mondelez Nestle Mars Ferrero Amul
Relative market
share
0.15 9 7 6 5 5 0.9 0.7 0.6 0.5 0.5
Brand image &
reputation
0.15 8 7 6 6 9 1.2 1.05 0.9 0.9 1.35
Advetisement 0.10 9 6 5 5 8 0.45 0.3 0.25 0.25 0.4
Packaging 0.20 8 8 7 8 6 1.6 1.6 1.4 1.6 1.2
Product
innovation
0.15 6 6 5 6 4 0.9 0.9 0.75 0.9 0.6
Geographical
coverage
0.10 9 8 9 9 8 0.9 0.8 0.9 0.9 0.8
Different product
line
0.15 7 8 4 5 9 1.05 1.2 0.6 0.75 1.35
Weighted
competitive
strength score
1 7 6.55 5.4 5.8 6.2
*RatingScale:1=veryweak,10=verystrong
Cont…
Company Symbol
Mondelez India A
Nestle B
Mars C
Ferrero D
Amul E
A E D CB
Strategic Group Mapping
We have made the group mapping of five companies which are listed as below:
Mondelez India
Nestle
Mars
Amul
Lotus
We have selected two variables - Price and Number of brands. Price and number of brands
both are divided into three categories which is as per the below table
Price Number of brands
Low 0-10 Less than 7
Medium 10-20 7-9
High More than 20 More than 9
Cont…
Company Symbol
Mondelez India
Nestle
Mars
Amul
Lotus
Driving forces
Festivals
Change in who buys the chocolates
Change in long-term industry growth rate
Technological changes
Product innovation
Key Success Factor
Tradition of gifting sweets in India
Shift in consumer preference from traditional mithai to chocolates
Rising income levels
Attractive packing i.e. marketing innovation
Pricing which is suitable to every pocket
Value Chain Analysis
Production Marketing
Crop
Harvest
Ferment, dry
Trading
Storage,
transport
Processing
Roasting
Grinding
Pressing
Chocolate
Mfg.
Consumer
Distribution
PrimaryActivitiesSupportActivities
Research & development
Human resource management
Technical assistance
General administration
Financial Analysis
10.42
17.77
-3.39-5
0
5
10
15
20
Mondelez India Nestle Lotus
Gross Profit Margin
8.71
21.39
-2.29-5
0
5
10
15
20
25
Mondelez India Nestle Lotus
Operating Profit Margin
Cont…
7.1
12.16
-3.26
-6
-4
-2
0
2
4
6
8
10
12
14
Mondelez India Nestle Lotus
Net Profit Margin
8.96
15.6
-2.2-4
-2
0
2
4
6
8
10
12
14
16
18
Mondelez India Nestle Lotus
Cash Profit Margin
Cont…
31.61
47.79
-6.83
-10
0
10
20
30
40
50
60
Mondelez India Nestle Lotus
Return on Capital Employed
25.93
47.16
16.4
0
10
20
30
40
50
Mondelez India Nestle Lotus
Return on Equity
11.7
245.68
-7.28
-50
0
50
100
150
200
250
300
Mondelez India Nestle Lotus
Return on Total Assets
Opportunity & Threat Analysis
Opportunities
• Increasing gifting
culture
• Increasing health
consciousness
• Increase reach in rural
market
• Acquire competition
• Diversification of
product range
Threats
• Increase in cost of raw
material
• Availability of substitute
product
• Low switching cost
Findings
Per capita consumption of chocolates in India has grown from 40 grams in 2008 to
120 grams in 2013
Mondelez India (Cadbury) is the market leader with 62% market share ,followed by
Nestle with 22% market share
Switzerland is the country with highest chocolate consumption
Cocoa price is continuously increasing
Urban cities account for nearly 80% of the consumption of chocolates
Future outlook of chocolate industry is good
Chocolate sales is continuously increasing for the last five years
Cadbury Glow has launched a unique gifting website that connect both the gifter and
recipient. Customers can add a personal touch to their gift of Cadbury Glow by writing
a personal note, sending a lovely song or experiencing again fond memories by
videos and photos
Personalizing chocolate and the 3D printing revolution are the technological changes
in chocolate industry
Cont…
Dark chocolate is expected to be the fastest growing segment due to its health
benefits and increasing awareness among Indian consumers
Political, economic, social and technological factors are favorable for chocolate
industry
Rivalry among competitors, threat of substitute product and bargaining power of
supplier is very high
Threat of new entry is medium and bargaining power of buyer is low
After analyzing GE nine cell matrix we come to know about that all the companies fall
in the high priority area
Cadbury has more than nine brand and offers chocolate in all the price range
Within Nestle and Lotus there is more competition having 7-9 brands
Mars and Amul are close competitor
Cont…
Driving forces in the chocolate industry includes festivals & occasions, changes in
who buys the product, change in long term industry growth rate, technological
changes & product innovation
Key success factors in chocolate industry are shift in consumer preference from
traditional mithai to chocolates rising income levels, attractive packing, pricing which
is suitable to every pocket
Mondelez India foods ltd. cocoa department produces over latest million hybrid
seedlings annually and distributes among farmers in Kerala, Andhra, Tamilnadu and
Karnataka
Bibliography
Book
“Crafting and Executing Strategy” by A Thompson, Margaret A Peteraf, John E Gamble, A J
Strickland, A K Jain, Tata McGraw Hill Education Pvt. Ltd., Eighteenth Edition”
Websites
• www.confectionerynews.com
• www.indianmirror.com
• www.strategicmanagementinsight.com
• www.livemint.com
• www.moneycontrol.com
• www.ibef.org
• www.statista.com
• www.bloomberg.com
• www.kpmg.com
• www.worldcocoa.org
• www.myaccountingcourse.com
• www.readyratio.com
• www.indiaretailing.com
• www.indexmundi.com
Chocolate industry Presentation

Chocolate industry Presentation

  • 1.
    Chapters • Research Methodology •Study of Global Market • Study of Indian Market • Product Profile • Demand Determination of Chocolate Industry • Distribution channel in chocolate industry • Key issues & current trends • PEST analysis • Michel Porter’s Five Force Model • Other Portfolio Model • Financial Analysis • Opportunity & Threat Analysis • Findings • Bibliography
  • 2.
    Research Methodology Objective Main objective: •Tostudy the macro environment factors affecting chocolate industry Sub-objective: •To study the characteristics of chocolate industry •To study political, economic, social and technological factors affecting chocolate industry •To study opportunities and threats for the chocolate industry •To find out the global trends in production, consumption, product development and Marketing •To analyze driving forces for the chocolate industry •To identify the porter’s five forces and its impact on chocolate industry •To draw conclusion from the BCG Matrix •To identify the level of competition between different players in chocolate industry •To find out the key success factor in chocolate industry •To analyze the value chain of chocolate industry
  • 3.
    Cont… Research design Exploratory Datacollection & sources Secondary data Analysis plan • PEST Analysis • Michel Porter’s Five Force Model • BCG Matrix • Strategic Group Mapping • GE Nine-Cell • Driving Forces • Key Success Factors • Value Chain Analysis Limitations • The whole study is based on secondary data • It is assumed that whole data is authenticated and on that basis conclusion is derived. So it is may possible it is not in proper manner • The level of reliability may be less as it is based on secondary data • Financial data of some companies were not available at the time of the study
  • 4.
    Study of GlobalMarket Market size Global chocolate market will grow to $98.3 billion in 2016 from the 85 billion it was at in 2013 CAGR 21% 12% 11% 9% 8% 7% 4% 0% 5% 10% 15% 20% 25% India Latin America Brazil China Russia Eastern Europe Mexico Compound Annual Growth Rate Per Capita Chocolate Consumption, by country (2014) Country Per Capita Consumption (Kg) Switzerland 9 Germany 7.9 Austria 7.8 Ireland 7.5 United Kingdom 7.5 Norway 6.6 Estonia 6 Slovakia 5.4 Sweden 5.4 Kazakhstan 5.3 • India - about 120 gm in 2013
  • 5.
    Cont… Segment of thechocolate industry The market is segmented into various products such as,  Dark chocolate  Milk chocolate  White chocolate Additionally, the market is segmented based on sales frequency such as  Daily chocolate  Premium chocolate  Seasonal chocolate
  • 6.
    Cont… Main manufacturers ofchocolate in the world Company Net Sales 2013 (US$ millions) Mars Inc (USA) 17,640 Mondelēz International Inc (USA) 14,862 Nestlé SA (Switzerland) 11,760 Meiji Holdings Co Ltd (Japan) 11,742 Ferrero Group (Italy) 10,900 Hershey Foods Corp (USA) 7,043 Innovation •Personalizing chocolate •The 3D printing revolution
  • 7.
    Cont… Cocoa suppliers Major cocoaproducing countries in each region include: Africa: Côte d’Ivoire, Ghana, Nigeria, Cameroon Asia/Oceania : Indonesia, Malaysia, Papua New Guinea Americas : Brazil, Ecuador, Colombia Africa 68% Americas 15% Asia 17% Global Cocoa Production www.worldcocoa.org
  • 8.
    Study of IndianMarket India's chocolate market is estimated at around Rs 3,000 crore The overall chocolate market is growing 15% a year According to India Chocolate Market Forecast & Opportunities, 2018, the per capita consumption of chocolates is increasing in the country which will continue to flourish the market revenues Continuous rise in per capita income, changing consumer preferences and growing gifting tradition are boosting chocolate consumption in India Consumer preferences in India have gradually transitioned from traditional sweets to chocolates over the last couple of decades
  • 9.
    Cont… Market share ofmajor players Mondelez India 62%Nestle,18% Mars, 6% Ferrero,3% Amul, 3% Others, 8% India Chocolate Market Share. Source: ValueNotes India’s chocolate sales (2008-2018)
  • 10.
    Product Profile Chocolate isa sweet that is thousands of years old, which today is made of the mass of cocoa beans and cocoa butter obtained by processing roasted cocoa beans and powdered sugar, in the case of milk chocolate, milk raw material is added to the ingredients. Ingredients Chocolate Liquor Chocolate Lecithin Sugar Cocoa Butter Vanilla, Fruits, Nuts
  • 11.
    Cont… Types of chocolateShare of milk, white and dark chocolate in total sales of chocolate Milk 75% White 16% Dark 9% Milk chocolate is currently the most popular category in India, contributing to 75% of the total sales of chocolates. Cadbury dairy milk is the market leader in the milk chocolate segment Dark chocolate, with only a 9% share of the market, is expected to be the fastest growing segment due to its health benefits and increasing awareness among Indian consumers
  • 12.
  • 13.
    Demand Determination ofChocolate Industry Price Year Price (gift boxes) Demand (US dollar billion) 2009 55 0.5 2010 90 0.7 2011 110 0.9 2012 160 1.2 2013 320 1.5 Income of targeted customers Year Per capita income (US dollar) Demand (US dollar billion) 2009 885 0.5 2010 948 0.7 2011 1032 0.9 2012 1086 1.2 2013 1123 1.5 Penetration level
  • 14.
    Distribution channel inchocolate industry Producer Wholesaler Retailer Consumer
  • 15.
    Key issues &current trends Key issues • Child Labor and Slavery in the Chocolate Industry • Rise in price of raw material Current trends • Demand for Dark Chocolates • Consumption of chocolates • Occasion and celebration • Packaging • Premium chocolates
  • 16.
    PEST Analysis Political factor Increasingprice of cocoa 2200 2431 2825 3223 0 500 1000 1500 2000 2500 3000 3500 2011 2012 2013 2014 US Dollars Per Metric Ton Source:indexmundi.com
  • 17.
    Cont… Increasing price ofhazelnut Cold chain facility Mandatory Labeling & other FSSAI norms Encouragement to private sector Relaxed FDI norms Incentives for development of storage facilities
  • 18.
    Cont… Conclusion Factors Favorable Unfavorable Increasingprice of cocoa √ Increasing price of hazelnut √ Cold chain facility √ FSSAI norms √ Encouragement to private sector √ Relaxed FDI norms √ Incentives for development of storage facilities √
  • 19.
    Cont… Economical factor 10.26% 6.64% 4.74% 5.02% 5.63% 0.00% 2.00% 4.00% 6.00% 8.00% 10.00% 12.00% 20102011 2012 2013 2014* GDP growth rate 948 1032 1086 1123 1165 0 200 400 600 800 1000 1200 1400 2010 2011 2012 2013 2014 Per Capita Income (US dollar) Source: tradingecocomics.com
  • 20.
    Cont… 11.99 8.86 10.25 9.65 8.28 0 2 4 6 8 10 12 14 2010 2011 20122013 2014 Inflation Rate (%) Source: statista.com 10 9.8 8.5 8.8 8 8 9 9 10 10 11 2010 2011 2012 2013 Unemployment Rate (%) Source: statista.com
  • 21.
    Cont… Conclusion Factors Favorable Unfavorable Grossdomestic product √ Per capita income √ Inflation rate √ Unemployment trends √ Socio-cultural factor Factors Favorable Unfavorable Age distribution √ Culture √ Eating habits √ Health consciousness √ Technological factor Personalizing chocolate and the 3D printing revolution are the technological changes in chocolate industry
  • 22.
    Michel Porter’s FiveForce Model Intensity of rivalry among competitors in an industry Parameters Description Very High (1) High (2) Medium (3) Low (4) Very Low (5) Number of players More √ Market growth rate High √ Rivals become equal in size Yes √ Switching cost of buyers Low √ Frequent & aggressive moves Yes √
  • 23.
    Cont… Threat of newentrants Parameters Description Very High (1) High (2) Medium (3) Low (4) Very Low (5) Existing players struggling to earn good profit Profit margin is good √ Industry outlook is risky Good future √ Industry growth rate High √ Economies of scale Required √ Access to distribution channel Easy √ Access to raw material Difficult √ Capital requirement High √ Switching cost of buyers Low √ Customer loyalty Low √
  • 24.
    Cont… Threat of substituteproducts Parameters Description Very High (1) High (2) Medium (3) Low (4) Very Low (5) Availability of substitute product Easily available √ Price of substitute product Low √ Switching cost Low √
  • 25.
    Cont… Bargaining power ofsuppliers (cocoa) Parameters Description Very High (1) High (2) Medium (3) Low (4) Very Low (5) Number of suppliers Few √ Price of raw material High √ Substitute of raw material available No √ Suppliers are scattered or concentrated Concentrated √
  • 26.
    Cont… Bargaining power ofsuppliers (Milk powder) Parameters Description Very High (1) High (2) Medium (3) Low (4) Very Low (5) Number of suppliers More √ Price of raw material Low √ Substitute of raw material available No √ Suppliers are scattered or concentrated Scattered √
  • 27.
    Cont… Bargaining power ofbuyers Parameters Description Very High (1) High (2) Medium (3) Low (4) Very Low (5) Number of buyers Many √ Buyers are well informed Yes √ Buyers are scattered or concentrated Scattered √ Buyers are loyal No √
  • 28.
    Cont… Conclusion Rivalry among competitorsVery High Threat of new entrants Medium Threat of substitute products Very High Bargaining power of suppliers High Bargaining power of buyers Low Competitive Rivalry Threat of new entry Buyer powerSupplier power Threatof substitut e
  • 29.
    Other Portfolio Model BCGMatrix GE Nine cell matrix Strategic Group Mapping Driving force Key Success Factor Value Chain Analysis
  • 30.
    BCG Matrix Company Name Market Share (%) RelativeMarket Share (%) Mondelez India 62 1 Nestle 18 0.29 Mars 6 0.1 Ferreo 3 0.05 Amul 3 0.05
  • 31.
    GE Nine cellmatrix Industry Attractiveness Factors Weight Rating* Industry Atrractiveness Score Political factor 0.04 6 0.24 Economic factor 0.05 8 0.4 Social factor 0.06 8 0.48 Intensity of competition 0.20 5 1 Market Size 0.15 7 1.05 Projected Growth Rate 0.25 9 2.25 Seasonal influence 0.15 9 1.35 Opportunities 0.06 7 0.42 Threats 0.04 5 0.2 Weighted industry attractiveness scores 1 7.39 *Rating Scale: 1 = very unattractive , 10 = very attractive
  • 32.
    Cont… Competitive Strength Factor WeightRating* Competitive Strengths Mondelez Nestle Mars Ferrero Amul Mondelez Nestle Mars Ferrero Amul Relative market share 0.15 9 7 6 5 5 0.9 0.7 0.6 0.5 0.5 Brand image & reputation 0.15 8 7 6 6 9 1.2 1.05 0.9 0.9 1.35 Advetisement 0.10 9 6 5 5 8 0.45 0.3 0.25 0.25 0.4 Packaging 0.20 8 8 7 8 6 1.6 1.6 1.4 1.6 1.2 Product innovation 0.15 6 6 5 6 4 0.9 0.9 0.75 0.9 0.6 Geographical coverage 0.10 9 8 9 9 8 0.9 0.8 0.9 0.9 0.8 Different product line 0.15 7 8 4 5 9 1.05 1.2 0.6 0.75 1.35 Weighted competitive strength score 1 7 6.55 5.4 5.8 6.2 *RatingScale:1=veryweak,10=verystrong
  • 33.
    Cont… Company Symbol Mondelez IndiaA Nestle B Mars C Ferrero D Amul E A E D CB
  • 34.
    Strategic Group Mapping Wehave made the group mapping of five companies which are listed as below: Mondelez India Nestle Mars Amul Lotus We have selected two variables - Price and Number of brands. Price and number of brands both are divided into three categories which is as per the below table Price Number of brands Low 0-10 Less than 7 Medium 10-20 7-9 High More than 20 More than 9
  • 35.
  • 36.
    Driving forces Festivals Change inwho buys the chocolates Change in long-term industry growth rate Technological changes Product innovation Key Success Factor Tradition of gifting sweets in India Shift in consumer preference from traditional mithai to chocolates Rising income levels Attractive packing i.e. marketing innovation Pricing which is suitable to every pocket
  • 37.
    Value Chain Analysis ProductionMarketing Crop Harvest Ferment, dry Trading Storage, transport Processing Roasting Grinding Pressing Chocolate Mfg. Consumer Distribution PrimaryActivitiesSupportActivities Research & development Human resource management Technical assistance General administration
  • 38.
    Financial Analysis 10.42 17.77 -3.39-5 0 5 10 15 20 Mondelez IndiaNestle Lotus Gross Profit Margin 8.71 21.39 -2.29-5 0 5 10 15 20 25 Mondelez India Nestle Lotus Operating Profit Margin
  • 39.
    Cont… 7.1 12.16 -3.26 -6 -4 -2 0 2 4 6 8 10 12 14 Mondelez India NestleLotus Net Profit Margin 8.96 15.6 -2.2-4 -2 0 2 4 6 8 10 12 14 16 18 Mondelez India Nestle Lotus Cash Profit Margin
  • 40.
    Cont… 31.61 47.79 -6.83 -10 0 10 20 30 40 50 60 Mondelez India NestleLotus Return on Capital Employed 25.93 47.16 16.4 0 10 20 30 40 50 Mondelez India Nestle Lotus Return on Equity 11.7 245.68 -7.28 -50 0 50 100 150 200 250 300 Mondelez India Nestle Lotus Return on Total Assets
  • 41.
    Opportunity & ThreatAnalysis Opportunities • Increasing gifting culture • Increasing health consciousness • Increase reach in rural market • Acquire competition • Diversification of product range Threats • Increase in cost of raw material • Availability of substitute product • Low switching cost
  • 42.
    Findings Per capita consumptionof chocolates in India has grown from 40 grams in 2008 to 120 grams in 2013 Mondelez India (Cadbury) is the market leader with 62% market share ,followed by Nestle with 22% market share Switzerland is the country with highest chocolate consumption Cocoa price is continuously increasing Urban cities account for nearly 80% of the consumption of chocolates Future outlook of chocolate industry is good Chocolate sales is continuously increasing for the last five years Cadbury Glow has launched a unique gifting website that connect both the gifter and recipient. Customers can add a personal touch to their gift of Cadbury Glow by writing a personal note, sending a lovely song or experiencing again fond memories by videos and photos Personalizing chocolate and the 3D printing revolution are the technological changes in chocolate industry
  • 43.
    Cont… Dark chocolate isexpected to be the fastest growing segment due to its health benefits and increasing awareness among Indian consumers Political, economic, social and technological factors are favorable for chocolate industry Rivalry among competitors, threat of substitute product and bargaining power of supplier is very high Threat of new entry is medium and bargaining power of buyer is low After analyzing GE nine cell matrix we come to know about that all the companies fall in the high priority area Cadbury has more than nine brand and offers chocolate in all the price range Within Nestle and Lotus there is more competition having 7-9 brands Mars and Amul are close competitor
  • 44.
    Cont… Driving forces inthe chocolate industry includes festivals & occasions, changes in who buys the product, change in long term industry growth rate, technological changes & product innovation Key success factors in chocolate industry are shift in consumer preference from traditional mithai to chocolates rising income levels, attractive packing, pricing which is suitable to every pocket Mondelez India foods ltd. cocoa department produces over latest million hybrid seedlings annually and distributes among farmers in Kerala, Andhra, Tamilnadu and Karnataka
  • 45.
    Bibliography Book “Crafting and ExecutingStrategy” by A Thompson, Margaret A Peteraf, John E Gamble, A J Strickland, A K Jain, Tata McGraw Hill Education Pvt. Ltd., Eighteenth Edition” Websites • www.confectionerynews.com • www.indianmirror.com • www.strategicmanagementinsight.com • www.livemint.com • www.moneycontrol.com • www.ibef.org • www.statista.com • www.bloomberg.com • www.kpmg.com • www.worldcocoa.org • www.myaccountingcourse.com • www.readyratio.com • www.indiaretailing.com • www.indexmundi.com