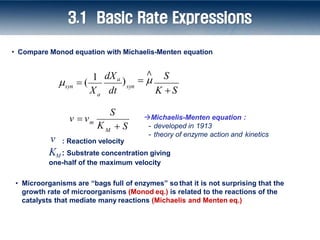
Changha Lee
School of Chemical and Biological Engineering
Seoul National University
http://artlab.re.kr
고도산화환원 환경공학 연구실
Advanced Redox Technology (ART) Lab
Chapter 3. Microbial Kinetics
All the figures and tables in this material are from the reference below unless specified otherwise.
Reference: Bruce E. Rittmann and Perry L. McCarty, "Environmental Biotechnology: Principles
and Applications", McGraw-Hill, 2001.
3. Microbial Kinetics
• Microorganisms fuel their lives by performing redox reaction that generate the
energy and reducing power needed to maintain and construct themselves.
• Because redox reactions are nearly always very slow unless catalyzed,
microorganisms produce enzyme catalysts that increase the kinetics of their
redox reactions to exploit chemical resources in their environment.
• Engineers want to take advantage of these microbially catalyzed reaction
because the chemical resources of the microorganisms usually are the
pollutants that the engineers must control :
e.g., Organics (BOD, COD, e- donor), NH4
+ (e- donor, nutrient), NO3
- (e-
acceptor, nutrient), PO4
3- (nutrient), etc.
3. Microbial Kinetics
• Engineers who employ microorganisms for pollution control must recognize
two interrelated principles:
First :
Active microorganisms catalyze the pollutant removing reactions.
So the rate of pollutant removal depends on the concentration of
the catalyst or the active biomass.
Second :
The active biomass is grown and sustained through the utilization
of its energy - and electron (e-) - generating primary substrates.
So the rate of biomass production is proportional to the utilization
rate of the primary substrates.
• The connection between the active biomass (the catalyst) and the primary
substrates is the most fundamental factor needed for understanding and exploiting
microbial systems for pollution control.
3.1 Basic Rate Expressions
• A microbial process model is based on the mass balance on
i) the active biomass and ii) the primary substrate that limits the growth rate of
thebiomass.
• In the vast majority of cases, the rate limiting substrate is the e- donor.
So the term substrate now refers to the primary e- donor substrate.
• Jacques Monod : Nobel prize winner, director of Pasteur Institute.
• Monod equation : relationship most frequently used to represent bacterial
growth kinetics developed in the 1940s.
→ His original work related the specific growth rateof fast-growing bacteria to
the concentration of a rate limiting, e- donor substrate.
 Monod equation :
largely empirical, but widely applied for microbial systems
𝜇𝑠𝑦𝑛 =
1
𝑋𝑎
𝑑𝑋𝑎
𝑑𝑡 𝑠𝑦𝑛 = Ƹ
𝜇
𝑆
𝐾 + 𝑆

K
∧
syn = specific growth rate due to synthesis(T-1)
Xa = concentration of active biomass(MxL-3)
t = Time (T)
S = concentration of the rate-limiting substrate(MsL-3)
= maximum specific growth rate (T-1)
= substrate concentration giving one-half the maximum rate (MsL-3)
3.1 Basic Rate Expressions
X dt
syn
dXa
)
S
a
syn
∧
 
K S
  (
1
S
M
m
K  S
v  v Michaelis-Menten equation :
- developed in 1913
- theory of enzyme action and kinetics
• Compare Monod equation with Michaelis-Menten equation
: Reaction velocity
v
• Microorganisms are “bags full of enzymes” so that it is not surprising that the
growth rate of microorganisms (Monod eq.) is related to the reactions of the
catalysts that mediate many reactions (Michaelis and Menten eq.)
KM : Substrate concentration giving
one-half of the maximum velocity
3.1 Basic Rate Expressions
 Endogenous decay:
1) Environmental engineers study more slowly growing bacteria that has an energy
demand for maintenance.
2) Active biomass has an energy demand for maintenance of cell functions
(motility, repair and re-synthesis, osmotic regulation, transport and heat loss).
3) Flow of energy and electrons are required to meet maintenance needs.
4) Cells oxidize themselves to meet maintenance- energy needs.
b
dec
= endogenous-decay coefficient (T-1)
= specific growth rate due to decay (T-1)
3.1 Basic Rate Expressions
𝜇𝑑𝑒𝑐 =
1
𝑋𝑎
𝑑𝑋𝑎
𝑑𝑡 𝑑𝑒𝑐𝑎𝑦 = −𝑏
• The rate at which active biomass is converted to inert biomass
μinert =μdec -μresp
• Oxidation decay rate :
Although most of the decayed biomass is oxidized, a small fraction accumulates
as inert biomass.
fd
: inert biomass concentration (MxL-3)
Xi
: fraction of active biomass that is biodegradable
𝜇𝑟𝑒𝑠𝑝 =
1
𝑋𝑎
𝑑𝑋𝑎
𝑑𝑡 𝑑𝑒𝑐𝑎𝑦 = −𝑓𝑑𝑏
−
1
𝑋𝑎
𝑑𝑋𝑖
𝑑𝑡
=
1
𝑋𝑎
𝑑𝑋𝑎
𝑑𝑡 𝑖𝑛𝑒𝑟𝑡 = −𝑏 − −𝑓𝑑𝑏 = − 1 − 𝑓𝑑 𝑏
3.1 Basic Rate Expressions
• The net specific growth rate of active biomass (μ) is the sum of synthesis and decay
-b
X dt
syn dec
dXa S
a
∧
 
K  S
 
1
   
3.1 Basic Rate Expressions
Figure3.1 schematic of how the synthesis
and net specific growth rates
depend on the substrate conc
entration.
Maximum specific growth rate
syn
At S=20K,  = 0.95 
∧
If S = 0, then
S
dec
syn
 0 b
-b
∧
      
K  S
• The ultimate interest is to remove substrate
X a
ut
qS
K  S
r  
q
∧ ∧
  q Y
rut = rate of substrate utilization (MsL-3T-1)
∧
x
= maximum specific rate of substrate utilization (MsM -1T-1)
where,
 Rate of substrate utilization
∧
∧
a
a
net X -bX
r
KS
Y
q S
a
a
S
X -bX
∧
K S
rnet  Xa  
 Net rate of cell growth
rnet = the net rate of active-biomass growth (MxL-3T-1)
3.1 Basic Rate Expressions
Y = g Cell produced / g Substrate consumed
𝜇 = 𝑌
ො
𝑞𝑆
𝐾 + 𝑆
− 𝑏 𝜇 = 𝑌(
ො
𝑞𝑆
𝐾 + 𝑆
− 𝑚)
𝜇 = 𝑌(
−𝑑𝑆/𝑑𝑡
𝑋𝑎
− 𝑚)
Xa Y
dS / dt
 m 
b
• At the starvation state, the specific substrate utilization rate becomes less than m.
 0
When
Xa Y
dS / dt
 m 
b
 0
3.1 Basic Rate Expressions
Because b =Ym in Ch. 2
 Starvation
A t s t e a d y - s t a t e ( d x a /d t = 0)
m: maintenance energy (M/MT)
(= the substrate utilization rate per unit mass of organisms at SS)
3.2 Parameter Values
 H2-Oxidizing sulfate reducers:
 Aerobic heterotrophs:
 Denitrifying heterotrophs:
3.2 Parameter Values
Y = g Cell produced / g Substrate consumed
 Experimental estimation of Y
• A small inoculum is grown to exponential phase and harvested from batch growth.
Measure the changes in biomass and substrate concentration from inoculum until
the time of harvesting.
• The true yield is estimated from
Y  -  X /  S
• The batch technique is adequate for rapidly growingcells, but can create errors
when the cells grow slowly so that biomass decay cannot be neglected.
3.2 Parameter Values
∧ ∧
(T-TR
)
qT qTR (1.07)
∧ ∧
(1.07)(T-20)
T 20
q = q
∧ ∧
e e
q  q / f 0
e
q  about 1 e-
eq /VSS-d at200
C
∧
• q is temperature-dependent.
 is controlled largely by e- flow to the electronacceptor.
• For 20 oC, the maximum flow to the energy reaction is about 1 e- eq / gVSS-d,
where 1 g VSS represents 1 g of biomass.
∧
q
0
∧ ∧
e e L / gVSS-d
L /VSS-d / 0.3  27g BOD
q  q / f 8g BOD
e.g., if fs
0 = 0.7, then fe
0 = 0.3
3.2 Parameter Values
∧
• b = 0.1- 0.3 /d for aerobic heterotrophs b < 0.05 /d for slower-growing species
• Biodegradable fraction (fd) is quite reproducible and has a value near 0.8 for a wide
range of microorganisms
 b is depends on microbial species and temperature.
TR
T
b  b (1.07)(T-TR)
3.2 Parameter Values
 K : the Monod half-maximum-rate concentration
• Most variable and least predictable parameter
• Its value can be affected by the substrate`s affinity for transport or metabolic enzymes
• Mass-transport resistances (approaching of substrate and microorganisms to each
other) ignored for suspended growth are lumped into the Monod kinetics by an increase
in K
𝜇 = 𝑌
ො
𝑞𝑆
𝐾 + 𝑆
− 𝑏
Q = feed flow rate
So
= feed substrateconcentration
 Chemostat:
a completely mixed reactor, having uniform and steady concentrations of active cell,
substrate, inert biomass and any other constituents.
• Active biomass
0  XaV QXa
• Substrate
0
ut S  S
0  r V Q
3.3 Basic Mass Balances
• From the mass-balance equation of
active biomass
0  XaV  QXa
q̂S
a
XaV  bXaV  QX
K  S
0 Y
3.3 Basic Mass Balances
𝑆 = 𝐾
1 + 𝑏
𝑉
𝑄
𝑌ො
𝑞
𝑉
𝑄
− 1 + 𝑏
𝑉
𝑄
𝜇 = 𝑌
ො
𝑞𝑆
𝐾 + 𝑆
− 𝑏
• From the mass-balance equation of
substrate
0
ut S  S
0  r V Q
X
q̂S
a
ut
K  S
r  
0
a S  S
X V  Q
qS
K  S
0  
∧
𝑋𝑎 = 𝑌(𝑆0 − 𝑆)
1
1 + 𝑏
𝑉
𝑄
Y
bXaV  QXa
X V =
a
K  S
q̂S
 HRT : Hydraulic Retention (or residence, detention) Time
 SRT : Solids Retention Time
= MCRT : Mean Cell Residence Time
= Sludge age
hydraulic retention time (T)  V /Q
dilution rate (T1
)  D  Q / V
 1
 

Active biomass in the system
Production rate of active biomass
-b
X dt
syn dec
1 dXa S
a
∧
     
K S
 
3.3 Basic Mass Balances
 SRT with quantitative parameters
 
Yq̂  1 b 
1 b
S  K
a 





 S 0
 S 
X Y

1 b
𝑆 = 𝐾
1 + 𝑏
𝑉
𝑄
𝑌ො
𝑞
𝑉
𝑄
− 1 + 𝑏
𝑉
𝑄
𝑉
𝑄
= 𝜃 = 𝜃𝑥
𝑋𝑎 = 𝑌(𝑆0 − 𝑆)
1
1 + 𝑏
𝑉
𝑄
3.3 Basic Mass Balances
SRT = HRT in our chemostat

 
𝜃𝑥 =
𝑉𝑋𝑎
𝑄𝑋𝑎
=
𝑉
𝑄
= 𝜃 =
1
𝐷
 S and Xa are controlled by SRT ( )
𝑆 = 𝐾
1 + 𝑏𝜃𝑥
𝑌ො
𝑞𝜃𝑥 − (1 + 𝑏𝜃𝑥)
𝑋𝑎 = 𝑌
𝑆0 − 𝑆
1 + 𝑏𝜃𝑥
3.3 Basic Mass Balances
   then Q (V  const.)
  V /Q,
S0
YqˆbbK
K  S0

min


• At very small  (S =S0, Xa = 0)
min


washout :   
Yqˆ  1 b 
1 b
S  K
min

 :  value at which washout begins
by letting S = S0 in the eq below and solving for 
3.3 Basic Mass Balances
0
min
Yqˆb

K / S0
1
 lim
S Yqˆ bbK
K  S0
]lim  lim
so
 YqˆbbK / S0
1
so

[
min
]
[ lim defines an absolute minimum  (ormaximum) boundary for having steady-
state biomass. It is a fundamental delimiter of a biological process.
K  S 0
S0
YqˆbbK

min


decreases with increasing S0

min
3.3 Basic Mass Balances
• Absolute minimum  (S0 → )
• For all  > 
min
S declines monotonically with increasing 
3.3 Basic Mass Balances
• For very large 
S approaches another key limiting value (S min).
1 b
Yqˆ  1b 
S  K
b
K
 K
Yqˆb
S min  lim K
 lim
 x
 x
Yqˆ1/  b
1/ b
1 b
Yqˆ 1b 
3.3 Basic Mass Balances
- Smin is the minimum concentration capable of supporting steady-state biomass.
- If S < Smin , the cells net specific growth rate becomes negative (Biomass will not accumulate
and gradually disappear.
- Therefore, steady-state biomass can be sustained only when S > Smin .
- However, Xa reaches a maximum and declines.
as the decay (b) becomes dominant, and the increase in (S0 – S) slows down.
• When  > ,Xa = ?
min
- If  were to extend to infinity, Xa would approach zero.

- Xa rises initially because (S0 – S) increases with increasing 
𝑋𝑎 = 𝑌
𝑆0 − 𝑆
1 + 𝑏𝜃𝑥
3.3 Basic Mass Balances
- The exact value of  we pick depends on a balancing of substrate removal (S0 – S), biomass
production (= Q Xa), reactor volume (V) and other factors.
- We can reduce S from So to Smin as we increase  from 
min toinfinity.
- In practice, engineers often specify a microbiological safety factor, defined by /
min
- Typical safety factor = 5 ~ 100
• Microbiological safety factor
3.3 Basic Mass Balances
• Because some fraction of newly synthesized biomass is refractory to self-oxidation,
endogenous respiration leads to the accumulation of inactive biomass ((1-fd)bXaV).
• Real influents often contain refractory volatile suspended solids (Xi
0) that we cannot
differentiate easily from inactive biomass.
• Steady-state mass balance on inert biomass
Formation rate of inert biomass
from active biomass decay
0
d a i
X  Xi
1 bX V  Q
0   f 
Xi Xi
0
 Xa1 fdb
Xi = concentration of inert biomass
= input concentration of inert biomass
i
X 0
 V Q

3.4 Mass Balances on Inert Biomass and Volatile Solids
Influent inert biomass
Inert biomass formed from active biomass decay
(Inert biomass represents a fraction of active biomass)
 Inert biomass (Xi) and volatile solids (Xv)

𝑋𝑎 = 𝑌
𝑆0 − 𝑆
1 + 𝑏𝜃𝑥
𝑋𝑖 = 𝑋𝑖
0 + 𝑌(𝑆0 − 𝑆)
(1 − 𝑓𝑑)𝑏𝜃𝑥
1 + 𝑏𝜃𝑥
3.4 Mass Balances on Inert Biomass and Volatile Solids
Xi Xi
0
 Xa1 fdb
𝑋𝑖
𝑚𝑎𝑥 = lim
𝜃𝑥
→∞
𝑋𝑖
0 + 𝑌
𝑆0 − 𝑆
1 + 𝑏𝜃𝑥
(1 − 𝑓𝑑)𝑏𝜃𝑥
= lim
𝜃𝑥
→∞
𝑋𝑖
0 + 𝑌
𝑆0 − 𝑆
1
𝑏𝜃𝑥
+ 1
(1 − 𝑓𝑑)
𝑋𝑖
𝑚𝑎𝑥 = 𝑋𝑖
0 + 𝑌(𝑆0 − 𝑆𝑚𝑖𝑛)(1 − 𝑓𝑑)
- Xi increases monotonically from Xi
0 to a maximum Xi
max
- Operation at a large 𝑥 results in greater accumulation of inert biomass
Greatest accumulation of inert biomass
3.4 Mass Balances on Inert Biomass and Volatile Solids
Xv = Xi + Xa
Xv: volatile suspended solids concentration (VSS)
0
0
0

 )
i a 
a 
v i
1 b
Y(S 0
 S)[1 (1 fd )b ]
 Xi 
 X  X (1 (1 fd )b
  Xa
X (1 fd )b
X  X 
3.4 Mass Balances on Inert Biomass and Volatile Solids
- Xv generally follow the trend of Xa, but it is higher than Xa (When Xa goes to zero, Xv equals Xi).
- If x< x
min, Xv = Xi
0 , S = S0
Yn: net yield or observed yield (Yobs)
x
x
d
1 b 
) b 
1 (1 f
Yn  Y 
• The above equation is parallel to the relationship between fs andfs
0:
x
s
s
1 b 
0

1 (1 fd ) b x
 f  f
Net accumulation of biomass
from synthesis and decay
𝑋𝑣 = 𝑋𝑖
0 +
𝑌 𝑆0 − 𝑆 ∙ 1 + (1 − 𝑓𝑑)𝑏𝜃𝑥
1 + 𝑏𝜃𝑥
= 𝑋𝑖
0 + 𝑌𝑛 𝑆0 − 𝑆
 Net yield (Yn)
3.4 Mass Balances on Inert Biomass and Volatile Solids
 SMP (Soluble Microbial Products)
• Much of the soluble organic matter in the effluent from a biological reactor is of
microbial origin.
• It is produced by the microorganisms as they degrade the organic substrate in the influent
to the reactor.
• The major evidence for this phenomenon comes from experiments;
“single soluble substrates of known composition were fed to microbial cultures and the
resulting organic compounds in the effluent were examinedfor the presence of the
influent substrate.”
“The bulk of the effluent organic matter was not the original substrate and was of high
molecular weight, suggesting that it was of microbial origin.”
• It is called “Soluble Microbial Products (SMP)”.
3.5 Soluble Microbial Products
 SMP
• Biodegradable, although some at a very low rate
• Moderate formula weights (100 to 1000)
• The majority of the effluent COD and BOD
• They can complex metals, foul membranes and cause color or foaming.
• They are thought to arise from two processes:
1) growth associated (UAP), 2) non-growth associated (BAP)
SMP = UAP + BAP
 UAP (Substrate-Utilization-Associated Products)
• Growth associated
• They are generated from substrate utilization and biomass growth
• They are not intermediates of catabolic pathways
 BAP (Biomass-Associated Products)
• Non-growth associated
• Related to decay and lysis of cell
• Release of soluble cellular constituents through lysis and solubilization of particulate
cellular components
3.5 Soluble Microbial Products
 UAP formation kinetics :
rUAP = - k1 rut
rUAP =
k1 =
rate of UAP-formation (MpL-3T-1)
UAP- formation coefficient (MpMs
-1)
 BAP formation kinetics :
rBAP = k2 Xa
rBAP = rate of BAP-formation (MpL-3T-1)
k2 = BAP- formation coefficient (MpMx
-1T-1)
3.5 Soluble Microbial Products
• Biotechnological Process must provide sufficient nutrients and electron
acceptors to support biomass growth and energy generation.
• Nutrients, being elements comprising the physical structure of the cells,
are needed in proportion to the net production of biomass.
• Active and inert biomass contain nutrients, as long as they areproduced
microbiologically.
• e- acceptors are consumed in proportion to e- donor utilization multiplied by
the sum of exogenous and endogenous flows of e- to the terminalacceptor.
3.6 Nutrients and Electron Acceptors
rn = rate of nutrient consumption (MnL-3T-1) (negative value)
n = the stochiometric ratio of nutrient mass to VSS for the biomass [MnMx
-1]
< C5H7O2N >
N = 14 g N/113 g cell VSS = 0.124 g N/g VSS
P = 0.2 * N =0.025 g P/g VSS
x
n u t
1  b
r Y
1  (1 fd )bx

rn   n rut Yn
x
n
Y
1 b 
 Y 
1 (1 fd ) b x
• Nutrients are needed in proportion to the net production of biomass (rut Yn)
• In chemostat model, rate of nutrients consumption (rn)
3.6 Nutrients and Electron Acceptors
e.g.,
rn 
 Nutrient consumption rate (rn)
0  Q C 0
 Q C  r V
n n n
Cn  Cn
0
 rn 
Cn
0
n
C : influent concentration of nutrient ( Mn L-3)
: effluent concentration of nutrient ( Mn L-3)
• The supply of nutrients must be supplemented if Cn becomes negative.
rn : rate of nutrient consumption (MnL-3T-1) (negative value)
 Mass balance for nutrients
in a chemostat
3.6 Nutrients and Electron Acceptors
• Mass balance on electron equivalents expressed as oxygen demand (OD)
• The e- acceptor consumption rate as e- acceptor
equivalents
Sa/t =OD inputs – OD outputs
a = 1 g O2/g COD for oxygen
a = 0.35 g NO3
--N/g COD for NO3
--N
0
gVSS
gCOD
v
OD inputs  QS0
1.42 X Q
gVSS
v
OD outputs  QS  Q(SMP) 1.42
gCOD
X Q
0
v v
a
t
Sa
  QS  S  SMP 1.42(X 0
 X )
O2 (32 g) + 4H+ + 4e-  2H2O
NO3
- (14 g) + 6H+ + 5e-  1/2N2 +3H2O
(14 g /5e-) / (32 g /4e- ) =0.35 g NO3
--N/g O2
3.6 Nutrients and Electron Acceptors
 Use rate of electron acceptors (Sa/t)
• The e- acceptors can be supplied in the influent flow or by other means, such as aeration
to provide oxygen (Ra).
Acceptor consumption rate
Ra: the required mass rate of e- acceptor supply (MaT-1)
Sa
0 : influent concentration of e- acceptor ( Ma L-3)
Sa : effluent concentration of e- acceptor ( Ma L-3)
∆𝑆𝑎
∆𝑡
= 𝑄 𝑆𝑎
0 − 𝑆𝑎 + 𝑅𝑎
3.6 Nutrients and Electron Acceptors
 Three circumstances for inputs of active biomass:
• When processes are operated in series, the downstream process often receives biomass
from the upstream process.
• Microorganisms may be discharged in a waste stream or grown in the sewers.
• Bioaugmentation is the deliberate addition of microorganisms to improve performance.
 When active biomass is input, the previous steady-state mass balance
for active biomass must be modified.
3.7 Input Active Biomass
0 = 𝑌
ො
𝑞𝑆
𝐾 + 𝑆
𝑋𝑎𝑉 − 𝑏𝑋𝑎𝑉 − 𝑄𝑋𝑎
0 = 𝑄𝑋𝑎
0 − 𝑄𝑋𝑎 + 𝑌
ො
𝑞𝑆
𝐾 + 𝑆
𝑋𝑎𝑉 − 𝑏𝑋𝑎𝑉
• The above equation can be solved for S.
• The solution for S is exactly the same as the one without Xa
0 input.
However,x is now redefined.
When the SRT is redefined as the reciprocal of the net specific growth rate,
0 = 𝑄𝑋𝑎
0
− 𝑄𝑋𝑎 + 𝑌
ො
𝑞𝑆
𝐾 + 𝑆
𝑋𝑎𝑉 − 𝑏𝑋𝑎𝑉
𝑆 = 𝐾
1 + 𝑏𝜃𝑥
𝑌ො
𝑞𝜃𝑥 − (1 + 𝑏𝜃𝑥)
𝜃𝑥 = 𝜇
_1 =
𝑋𝑎𝑉
𝑄𝑋𝑎 − 𝑄𝑋𝑎
0
3.7 Input Active Biomass
𝜃𝑥 =
𝑉𝑋𝑎
𝑄𝑋𝑎
Without Xa
0 input, it was
• Xa
0= 0, washout occurs for θx of about 0.6 d.
• As Xa
0 increases, complete washout is eliminated, because the reactor always contains some
biomass.
• Increasing Xa
0, also makes S lower, and the effect is most dramatic near washout.
 How does Xa
0 affect S and washout?
3.7 Input Active Biomass
qS
K  S
• Due to the change in definition of θx, solutions of the mass balances differ.
0
ˆ
a S  S
X V  Q
0  
• For active biomass,
• For substrate,
• For inert biomass 0
i i
d a X  X 
1 bX V  Q
0   f 
3.7 Input Active Biomass
0 = 𝑄𝑋𝑎
0
− 𝑄𝑋𝑎 + 𝑌
ො
𝑞𝑆
𝐾 + 𝑆
𝑋𝑎𝑉 − 𝑏𝑋𝑎𝑉
Homework
Derive Xa, Xi, and Xv as a function of 𝜃𝑥 (or 𝜃𝑥 and S).
 Organic substrate of particles (large polymers)
• Organic substrates that originate as particles or large polymerstake important
application in environmental biotechnology.
 Effect of hydrolysis
• Before the bacteria can begin the oxidation reaction, the particlesor large polymers must be
hydrolyzed to smaller molecules.
• Extracellular enzymes catalyze these hydrolysis reactions.
• Hydrolysis kinetics is not settled, because the hydrolytic enzymes are not
necessarily associated with or proportional to the active biomass.
• The level of hydrolytic enzymes is not established, and themeasurement is neither simple.
3.8 Hydrolysis of Particulate and Polymeric Substrates
 Kinetics of hydrolysis
• A reliable approach is the first-order kinetics.
rhyd  khyd S p
rhyd: rate of accumulation of particulate substrate due to hydrolysis (MsL-3T-1)
Sp : concentration of the particulate (or large-polymer) substrate (MsL-3)
khyd : first-order hydrolysis rate coefficient (T-1)
• khyd is proportional to the concentration of hydrolytic enzymes as wellas to the
intrinsic hydrolysis kinetics of the enzymes
• Some researchers include the active biomass concentration as part of khyd
(k´hyd = specific hydrolysis rate coefficient)
khyd = k´hyd Xa
3.8 Hydrolysis of Particulate and Polymeric Substrates
0 = 𝑄 𝑆𝑝
0
− 𝑆𝑝 − 𝑘ℎ𝑦𝑑𝑆𝑝𝑉 𝑆𝑝 =
𝑆𝑝
0
1 + 𝑘ℎ𝑦𝑑𝜃
- θ should not be substituted by θx
3.8 Hydrolysis of Particulate and Polymeric Substrates
• Mass balance on Sp
• The destruction of particulate substrate results in the formation of soluble substrate.
q̂S
a hyd p
K S
0  (S0
 S)  X V / Q  k S V / Q
S0 effectively is increased by khyd SpV /Q
• The steady-state mass balance on soluble substrate
q̂S X V  Q(S 0
 S)
a
K  S
0  
Mass balance for substrate
rhydn: rate of accumulation of a soluble form of nutrient n by hydrolysis (MnL-3T-1)
 n
: stoichiometric ratio of nutrient n in the particulate substrate (MnMs
-1)
• Other constituents of particulate substrate are also conserved during hydrolysis.
• Good examples of particulate substrate: nutrient nitrogen,phosphate, sulfur
rhydn  nkhyd S p
3.8 Hydrolysis of Particulate and Polymeric Substrates
 Example 3.6
3.8 Hydrolysis of Particulate and Polymeric Substrates
𝑋𝑎 = 𝑌(𝑆0 − 𝑆)
1
1 + 𝑏𝜃𝑥
𝜃𝑥
𝜃
Y of casein (pp. 170)
[3.54]
[3.55]'
 Xa Sp
Xv  Xi
X  X 0
 (1 f )bX 
i i d a
Xv  Xi  Xa [3.55] 
1
2
COD’/weight = the conversion factor (pp. 129,181)
3
The biodegradable fraction = 0.8 (pp. 171)
[3.53]
3.8 Hydrolysis of Particulate and Polymeric Substrates

3-Microbial kinetics.pdf

  • 1.
    Changha Lee School ofChemical and Biological Engineering Seoul National University http://artlab.re.kr 고도산화환원 환경공학 연구실 Advanced Redox Technology (ART) Lab Chapter 3. Microbial Kinetics All the figures and tables in this material are from the reference below unless specified otherwise. Reference: Bruce E. Rittmann and Perry L. McCarty, "Environmental Biotechnology: Principles and Applications", McGraw-Hill, 2001.
  • 2.
    3. Microbial Kinetics •Microorganisms fuel their lives by performing redox reaction that generate the energy and reducing power needed to maintain and construct themselves. • Because redox reactions are nearly always very slow unless catalyzed, microorganisms produce enzyme catalysts that increase the kinetics of their redox reactions to exploit chemical resources in their environment. • Engineers want to take advantage of these microbially catalyzed reaction because the chemical resources of the microorganisms usually are the pollutants that the engineers must control : e.g., Organics (BOD, COD, e- donor), NH4 + (e- donor, nutrient), NO3 - (e- acceptor, nutrient), PO4 3- (nutrient), etc.
  • 3.
    3. Microbial Kinetics •Engineers who employ microorganisms for pollution control must recognize two interrelated principles: First : Active microorganisms catalyze the pollutant removing reactions. So the rate of pollutant removal depends on the concentration of the catalyst or the active biomass. Second : The active biomass is grown and sustained through the utilization of its energy - and electron (e-) - generating primary substrates. So the rate of biomass production is proportional to the utilization rate of the primary substrates. • The connection between the active biomass (the catalyst) and the primary substrates is the most fundamental factor needed for understanding and exploiting microbial systems for pollution control.
  • 4.
    3.1 Basic RateExpressions • A microbial process model is based on the mass balance on i) the active biomass and ii) the primary substrate that limits the growth rate of thebiomass. • In the vast majority of cases, the rate limiting substrate is the e- donor. So the term substrate now refers to the primary e- donor substrate. • Jacques Monod : Nobel prize winner, director of Pasteur Institute. • Monod equation : relationship most frequently used to represent bacterial growth kinetics developed in the 1940s. → His original work related the specific growth rateof fast-growing bacteria to the concentration of a rate limiting, e- donor substrate.
  • 5.
     Monod equation: largely empirical, but widely applied for microbial systems 𝜇𝑠𝑦𝑛 = 1 𝑋𝑎 𝑑𝑋𝑎 𝑑𝑡 𝑠𝑦𝑛 = Ƹ 𝜇 𝑆 𝐾 + 𝑆  K ∧ syn = specific growth rate due to synthesis(T-1) Xa = concentration of active biomass(MxL-3) t = Time (T) S = concentration of the rate-limiting substrate(MsL-3) = maximum specific growth rate (T-1) = substrate concentration giving one-half the maximum rate (MsL-3) 3.1 Basic Rate Expressions
  • 6.
    X dt syn dXa ) S a syn ∧   KS   ( 1 S M m K  S v  v Michaelis-Menten equation : - developed in 1913 - theory of enzyme action and kinetics • Compare Monod equation with Michaelis-Menten equation : Reaction velocity v • Microorganisms are “bags full of enzymes” so that it is not surprising that the growth rate of microorganisms (Monod eq.) is related to the reactions of the catalysts that mediate many reactions (Michaelis and Menten eq.) KM : Substrate concentration giving one-half of the maximum velocity 3.1 Basic Rate Expressions
  • 7.
     Endogenous decay: 1)Environmental engineers study more slowly growing bacteria that has an energy demand for maintenance. 2) Active biomass has an energy demand for maintenance of cell functions (motility, repair and re-synthesis, osmotic regulation, transport and heat loss). 3) Flow of energy and electrons are required to meet maintenance needs. 4) Cells oxidize themselves to meet maintenance- energy needs. b dec = endogenous-decay coefficient (T-1) = specific growth rate due to decay (T-1) 3.1 Basic Rate Expressions 𝜇𝑑𝑒𝑐 = 1 𝑋𝑎 𝑑𝑋𝑎 𝑑𝑡 𝑑𝑒𝑐𝑎𝑦 = −𝑏
  • 8.
    • The rateat which active biomass is converted to inert biomass μinert =μdec -μresp • Oxidation decay rate : Although most of the decayed biomass is oxidized, a small fraction accumulates as inert biomass. fd : inert biomass concentration (MxL-3) Xi : fraction of active biomass that is biodegradable 𝜇𝑟𝑒𝑠𝑝 = 1 𝑋𝑎 𝑑𝑋𝑎 𝑑𝑡 𝑑𝑒𝑐𝑎𝑦 = −𝑓𝑑𝑏 − 1 𝑋𝑎 𝑑𝑋𝑖 𝑑𝑡 = 1 𝑋𝑎 𝑑𝑋𝑎 𝑑𝑡 𝑖𝑛𝑒𝑟𝑡 = −𝑏 − −𝑓𝑑𝑏 = − 1 − 𝑓𝑑 𝑏 3.1 Basic Rate Expressions
  • 9.
    • The netspecific growth rate of active biomass (μ) is the sum of synthesis and decay -b X dt syn dec dXa S a ∧   K  S   1     3.1 Basic Rate Expressions Figure3.1 schematic of how the synthesis and net specific growth rates depend on the substrate conc entration. Maximum specific growth rate syn At S=20K,  = 0.95  ∧ If S = 0, then S dec syn  0 b -b ∧        K  S
  • 10.
    • The ultimateinterest is to remove substrate X a ut qS K  S r   q ∧ ∧   q Y rut = rate of substrate utilization (MsL-3T-1) ∧ x = maximum specific rate of substrate utilization (MsM -1T-1) where,  Rate of substrate utilization ∧ ∧ a a net X -bX r KS Y q S a a S X -bX ∧ K S rnet  Xa    Net rate of cell growth rnet = the net rate of active-biomass growth (MxL-3T-1) 3.1 Basic Rate Expressions Y = g Cell produced / g Substrate consumed
  • 11.
    𝜇 = 𝑌 ො 𝑞𝑆 𝐾+ 𝑆 − 𝑏 𝜇 = 𝑌( ො 𝑞𝑆 𝐾 + 𝑆 − 𝑚) 𝜇 = 𝑌( −𝑑𝑆/𝑑𝑡 𝑋𝑎 − 𝑚) Xa Y dS / dt  m  b • At the starvation state, the specific substrate utilization rate becomes less than m.  0 When Xa Y dS / dt  m  b  0 3.1 Basic Rate Expressions Because b =Ym in Ch. 2  Starvation A t s t e a d y - s t a t e ( d x a /d t = 0) m: maintenance energy (M/MT) (= the substrate utilization rate per unit mass of organisms at SS)
  • 12.
  • 13.
     H2-Oxidizing sulfatereducers:  Aerobic heterotrophs:  Denitrifying heterotrophs: 3.2 Parameter Values Y = g Cell produced / g Substrate consumed
  • 15.
     Experimental estimationof Y • A small inoculum is grown to exponential phase and harvested from batch growth. Measure the changes in biomass and substrate concentration from inoculum until the time of harvesting. • The true yield is estimated from Y  -  X /  S • The batch technique is adequate for rapidly growingcells, but can create errors when the cells grow slowly so that biomass decay cannot be neglected. 3.2 Parameter Values
  • 16.
    ∧ ∧ (T-TR ) qT qTR(1.07) ∧ ∧ (1.07)(T-20) T 20 q = q ∧ ∧ e e q  q / f 0 e q  about 1 e- eq /VSS-d at200 C ∧ • q is temperature-dependent.  is controlled largely by e- flow to the electronacceptor. • For 20 oC, the maximum flow to the energy reaction is about 1 e- eq / gVSS-d, where 1 g VSS represents 1 g of biomass. ∧ q 0 ∧ ∧ e e L / gVSS-d L /VSS-d / 0.3  27g BOD q  q / f 8g BOD e.g., if fs 0 = 0.7, then fe 0 = 0.3 3.2 Parameter Values ∧
  • 17.
    • b =0.1- 0.3 /d for aerobic heterotrophs b < 0.05 /d for slower-growing species • Biodegradable fraction (fd) is quite reproducible and has a value near 0.8 for a wide range of microorganisms  b is depends on microbial species and temperature. TR T b  b (1.07)(T-TR) 3.2 Parameter Values  K : the Monod half-maximum-rate concentration • Most variable and least predictable parameter • Its value can be affected by the substrate`s affinity for transport or metabolic enzymes • Mass-transport resistances (approaching of substrate and microorganisms to each other) ignored for suspended growth are lumped into the Monod kinetics by an increase in K 𝜇 = 𝑌 ො 𝑞𝑆 𝐾 + 𝑆 − 𝑏
  • 18.
    Q = feedflow rate So = feed substrateconcentration  Chemostat: a completely mixed reactor, having uniform and steady concentrations of active cell, substrate, inert biomass and any other constituents. • Active biomass 0  XaV QXa • Substrate 0 ut S  S 0  r V Q 3.3 Basic Mass Balances
  • 19.
    • From themass-balance equation of active biomass 0  XaV  QXa q̂S a XaV  bXaV  QX K  S 0 Y 3.3 Basic Mass Balances 𝑆 = 𝐾 1 + 𝑏 𝑉 𝑄 𝑌ො 𝑞 𝑉 𝑄 − 1 + 𝑏 𝑉 𝑄 𝜇 = 𝑌 ො 𝑞𝑆 𝐾 + 𝑆 − 𝑏 • From the mass-balance equation of substrate 0 ut S  S 0  r V Q X q̂S a ut K  S r   0 a S  S X V  Q qS K  S 0   ∧ 𝑋𝑎 = 𝑌(𝑆0 − 𝑆) 1 1 + 𝑏 𝑉 𝑄 Y bXaV  QXa X V = a K  S q̂S
  • 20.
     HRT :Hydraulic Retention (or residence, detention) Time  SRT : Solids Retention Time = MCRT : Mean Cell Residence Time = Sludge age hydraulic retention time (T)  V /Q dilution rate (T1 )  D  Q / V  1    Active biomass in the system Production rate of active biomass -b X dt syn dec 1 dXa S a ∧       K S   3.3 Basic Mass Balances
  • 21.
     SRT withquantitative parameters   Yq̂  1 b  1 b S  K a        S 0  S  X Y  1 b 𝑆 = 𝐾 1 + 𝑏 𝑉 𝑄 𝑌ො 𝑞 𝑉 𝑄 − 1 + 𝑏 𝑉 𝑄 𝑉 𝑄 = 𝜃 = 𝜃𝑥 𝑋𝑎 = 𝑌(𝑆0 − 𝑆) 1 1 + 𝑏 𝑉 𝑄 3.3 Basic Mass Balances SRT = HRT in our chemostat    𝜃𝑥 = 𝑉𝑋𝑎 𝑄𝑋𝑎 = 𝑉 𝑄 = 𝜃 = 1 𝐷
  • 22.
     S andXa are controlled by SRT ( ) 𝑆 = 𝐾 1 + 𝑏𝜃𝑥 𝑌ො 𝑞𝜃𝑥 − (1 + 𝑏𝜃𝑥) 𝑋𝑎 = 𝑌 𝑆0 − 𝑆 1 + 𝑏𝜃𝑥 3.3 Basic Mass Balances    then Q (V  const.)   V /Q,
  • 23.
    S0 YqˆbbK K  S0  min   •At very small  (S =S0, Xa = 0) min   washout :    Yqˆ  1 b  1 b S  K min   :  value at which washout begins by letting S = S0 in the eq below and solving for  3.3 Basic Mass Balances
  • 24.
    0 min Yqˆb  K / S0 1 lim S Yqˆ bbK K  S0 ]lim  lim so  YqˆbbK / S0 1 so  [ min ] [ lim defines an absolute minimum  (ormaximum) boundary for having steady- state biomass. It is a fundamental delimiter of a biological process. K  S 0 S0 YqˆbbK  min   decreases with increasing S0  min 3.3 Basic Mass Balances • Absolute minimum  (S0 → )
  • 25.
    • For all >  min S declines monotonically with increasing  3.3 Basic Mass Balances
  • 26.
    • For verylarge  S approaches another key limiting value (S min). 1 b Yqˆ  1b  S  K b K  K Yqˆb S min  lim K  lim  x  x Yqˆ1/  b 1/ b 1 b Yqˆ 1b  3.3 Basic Mass Balances - Smin is the minimum concentration capable of supporting steady-state biomass. - If S < Smin , the cells net specific growth rate becomes negative (Biomass will not accumulate and gradually disappear. - Therefore, steady-state biomass can be sustained only when S > Smin .
  • 27.
    - However, Xareaches a maximum and declines. as the decay (b) becomes dominant, and the increase in (S0 – S) slows down. • When  > ,Xa = ? min - If  were to extend to infinity, Xa would approach zero.  - Xa rises initially because (S0 – S) increases with increasing  𝑋𝑎 = 𝑌 𝑆0 − 𝑆 1 + 𝑏𝜃𝑥 3.3 Basic Mass Balances
  • 28.
    - The exactvalue of  we pick depends on a balancing of substrate removal (S0 – S), biomass production (= Q Xa), reactor volume (V) and other factors. - We can reduce S from So to Smin as we increase  from  min toinfinity. - In practice, engineers often specify a microbiological safety factor, defined by / min - Typical safety factor = 5 ~ 100 • Microbiological safety factor 3.3 Basic Mass Balances
  • 29.
    • Because somefraction of newly synthesized biomass is refractory to self-oxidation, endogenous respiration leads to the accumulation of inactive biomass ((1-fd)bXaV). • Real influents often contain refractory volatile suspended solids (Xi 0) that we cannot differentiate easily from inactive biomass. • Steady-state mass balance on inert biomass Formation rate of inert biomass from active biomass decay 0 d a i X  Xi 1 bX V  Q 0   f  Xi Xi 0  Xa1 fdb Xi = concentration of inert biomass = input concentration of inert biomass i X 0  V Q  3.4 Mass Balances on Inert Biomass and Volatile Solids Influent inert biomass Inert biomass formed from active biomass decay (Inert biomass represents a fraction of active biomass)  Inert biomass (Xi) and volatile solids (Xv)
  • 30.
     𝑋𝑎 = 𝑌 𝑆0− 𝑆 1 + 𝑏𝜃𝑥 𝑋𝑖 = 𝑋𝑖 0 + 𝑌(𝑆0 − 𝑆) (1 − 𝑓𝑑)𝑏𝜃𝑥 1 + 𝑏𝜃𝑥 3.4 Mass Balances on Inert Biomass and Volatile Solids Xi Xi 0  Xa1 fdb 𝑋𝑖 𝑚𝑎𝑥 = lim 𝜃𝑥 →∞ 𝑋𝑖 0 + 𝑌 𝑆0 − 𝑆 1 + 𝑏𝜃𝑥 (1 − 𝑓𝑑)𝑏𝜃𝑥 = lim 𝜃𝑥 →∞ 𝑋𝑖 0 + 𝑌 𝑆0 − 𝑆 1 𝑏𝜃𝑥 + 1 (1 − 𝑓𝑑) 𝑋𝑖 𝑚𝑎𝑥 = 𝑋𝑖 0 + 𝑌(𝑆0 − 𝑆𝑚𝑖𝑛)(1 − 𝑓𝑑)
  • 31.
    - Xi increasesmonotonically from Xi 0 to a maximum Xi max - Operation at a large 𝑥 results in greater accumulation of inert biomass Greatest accumulation of inert biomass 3.4 Mass Balances on Inert Biomass and Volatile Solids
  • 32.
    Xv = Xi+ Xa Xv: volatile suspended solids concentration (VSS) 0 0 0   ) i a  a  v i 1 b Y(S 0  S)[1 (1 fd )b ]  Xi   X  X (1 (1 fd )b   Xa X (1 fd )b X  X  3.4 Mass Balances on Inert Biomass and Volatile Solids - Xv generally follow the trend of Xa, but it is higher than Xa (When Xa goes to zero, Xv equals Xi). - If x< x min, Xv = Xi 0 , S = S0
  • 33.
    Yn: net yieldor observed yield (Yobs) x x d 1 b  ) b  1 (1 f Yn  Y  • The above equation is parallel to the relationship between fs andfs 0: x s s 1 b  0  1 (1 fd ) b x  f  f Net accumulation of biomass from synthesis and decay 𝑋𝑣 = 𝑋𝑖 0 + 𝑌 𝑆0 − 𝑆 ∙ 1 + (1 − 𝑓𝑑)𝑏𝜃𝑥 1 + 𝑏𝜃𝑥 = 𝑋𝑖 0 + 𝑌𝑛 𝑆0 − 𝑆  Net yield (Yn) 3.4 Mass Balances on Inert Biomass and Volatile Solids
  • 34.
     SMP (SolubleMicrobial Products) • Much of the soluble organic matter in the effluent from a biological reactor is of microbial origin. • It is produced by the microorganisms as they degrade the organic substrate in the influent to the reactor. • The major evidence for this phenomenon comes from experiments; “single soluble substrates of known composition were fed to microbial cultures and the resulting organic compounds in the effluent were examinedfor the presence of the influent substrate.” “The bulk of the effluent organic matter was not the original substrate and was of high molecular weight, suggesting that it was of microbial origin.” • It is called “Soluble Microbial Products (SMP)”. 3.5 Soluble Microbial Products
  • 35.
     SMP • Biodegradable,although some at a very low rate • Moderate formula weights (100 to 1000) • The majority of the effluent COD and BOD • They can complex metals, foul membranes and cause color or foaming. • They are thought to arise from two processes: 1) growth associated (UAP), 2) non-growth associated (BAP) SMP = UAP + BAP  UAP (Substrate-Utilization-Associated Products) • Growth associated • They are generated from substrate utilization and biomass growth • They are not intermediates of catabolic pathways  BAP (Biomass-Associated Products) • Non-growth associated • Related to decay and lysis of cell • Release of soluble cellular constituents through lysis and solubilization of particulate cellular components 3.5 Soluble Microbial Products
  • 36.
     UAP formationkinetics : rUAP = - k1 rut rUAP = k1 = rate of UAP-formation (MpL-3T-1) UAP- formation coefficient (MpMs -1)  BAP formation kinetics : rBAP = k2 Xa rBAP = rate of BAP-formation (MpL-3T-1) k2 = BAP- formation coefficient (MpMx -1T-1) 3.5 Soluble Microbial Products
  • 37.
    • Biotechnological Processmust provide sufficient nutrients and electron acceptors to support biomass growth and energy generation. • Nutrients, being elements comprising the physical structure of the cells, are needed in proportion to the net production of biomass. • Active and inert biomass contain nutrients, as long as they areproduced microbiologically. • e- acceptors are consumed in proportion to e- donor utilization multiplied by the sum of exogenous and endogenous flows of e- to the terminalacceptor. 3.6 Nutrients and Electron Acceptors
  • 38.
    rn = rateof nutrient consumption (MnL-3T-1) (negative value) n = the stochiometric ratio of nutrient mass to VSS for the biomass [MnMx -1] < C5H7O2N > N = 14 g N/113 g cell VSS = 0.124 g N/g VSS P = 0.2 * N =0.025 g P/g VSS x n u t 1  b r Y 1  (1 fd )bx  rn   n rut Yn x n Y 1 b   Y  1 (1 fd ) b x • Nutrients are needed in proportion to the net production of biomass (rut Yn) • In chemostat model, rate of nutrients consumption (rn) 3.6 Nutrients and Electron Acceptors e.g., rn   Nutrient consumption rate (rn)
  • 39.
    0  QC 0  Q C  r V n n n Cn  Cn 0  rn  Cn 0 n C : influent concentration of nutrient ( Mn L-3) : effluent concentration of nutrient ( Mn L-3) • The supply of nutrients must be supplemented if Cn becomes negative. rn : rate of nutrient consumption (MnL-3T-1) (negative value)  Mass balance for nutrients in a chemostat 3.6 Nutrients and Electron Acceptors
  • 40.
    • Mass balanceon electron equivalents expressed as oxygen demand (OD) • The e- acceptor consumption rate as e- acceptor equivalents Sa/t =OD inputs – OD outputs a = 1 g O2/g COD for oxygen a = 0.35 g NO3 --N/g COD for NO3 --N 0 gVSS gCOD v OD inputs  QS0 1.42 X Q gVSS v OD outputs  QS  Q(SMP) 1.42 gCOD X Q 0 v v a t Sa   QS  S  SMP 1.42(X 0  X ) O2 (32 g) + 4H+ + 4e-  2H2O NO3 - (14 g) + 6H+ + 5e-  1/2N2 +3H2O (14 g /5e-) / (32 g /4e- ) =0.35 g NO3 --N/g O2 3.6 Nutrients and Electron Acceptors  Use rate of electron acceptors (Sa/t)
  • 41.
    • The e-acceptors can be supplied in the influent flow or by other means, such as aeration to provide oxygen (Ra). Acceptor consumption rate Ra: the required mass rate of e- acceptor supply (MaT-1) Sa 0 : influent concentration of e- acceptor ( Ma L-3) Sa : effluent concentration of e- acceptor ( Ma L-3) ∆𝑆𝑎 ∆𝑡 = 𝑄 𝑆𝑎 0 − 𝑆𝑎 + 𝑅𝑎 3.6 Nutrients and Electron Acceptors
  • 42.
     Three circumstancesfor inputs of active biomass: • When processes are operated in series, the downstream process often receives biomass from the upstream process. • Microorganisms may be discharged in a waste stream or grown in the sewers. • Bioaugmentation is the deliberate addition of microorganisms to improve performance.  When active biomass is input, the previous steady-state mass balance for active biomass must be modified. 3.7 Input Active Biomass 0 = 𝑌 ො 𝑞𝑆 𝐾 + 𝑆 𝑋𝑎𝑉 − 𝑏𝑋𝑎𝑉 − 𝑄𝑋𝑎 0 = 𝑄𝑋𝑎 0 − 𝑄𝑋𝑎 + 𝑌 ො 𝑞𝑆 𝐾 + 𝑆 𝑋𝑎𝑉 − 𝑏𝑋𝑎𝑉
  • 43.
    • The aboveequation can be solved for S. • The solution for S is exactly the same as the one without Xa 0 input. However,x is now redefined. When the SRT is redefined as the reciprocal of the net specific growth rate, 0 = 𝑄𝑋𝑎 0 − 𝑄𝑋𝑎 + 𝑌 ො 𝑞𝑆 𝐾 + 𝑆 𝑋𝑎𝑉 − 𝑏𝑋𝑎𝑉 𝑆 = 𝐾 1 + 𝑏𝜃𝑥 𝑌ො 𝑞𝜃𝑥 − (1 + 𝑏𝜃𝑥) 𝜃𝑥 = 𝜇 _1 = 𝑋𝑎𝑉 𝑄𝑋𝑎 − 𝑄𝑋𝑎 0 3.7 Input Active Biomass 𝜃𝑥 = 𝑉𝑋𝑎 𝑄𝑋𝑎 Without Xa 0 input, it was
  • 44.
    • Xa 0= 0,washout occurs for θx of about 0.6 d. • As Xa 0 increases, complete washout is eliminated, because the reactor always contains some biomass. • Increasing Xa 0, also makes S lower, and the effect is most dramatic near washout.  How does Xa 0 affect S and washout? 3.7 Input Active Biomass
  • 45.
    qS K  S •Due to the change in definition of θx, solutions of the mass balances differ. 0 ˆ a S  S X V  Q 0   • For active biomass, • For substrate, • For inert biomass 0 i i d a X  X  1 bX V  Q 0   f  3.7 Input Active Biomass 0 = 𝑄𝑋𝑎 0 − 𝑄𝑋𝑎 + 𝑌 ො 𝑞𝑆 𝐾 + 𝑆 𝑋𝑎𝑉 − 𝑏𝑋𝑎𝑉
  • 46.
    Homework Derive Xa, Xi,and Xv as a function of 𝜃𝑥 (or 𝜃𝑥 and S).
  • 47.
     Organic substrateof particles (large polymers) • Organic substrates that originate as particles or large polymerstake important application in environmental biotechnology.  Effect of hydrolysis • Before the bacteria can begin the oxidation reaction, the particlesor large polymers must be hydrolyzed to smaller molecules. • Extracellular enzymes catalyze these hydrolysis reactions. • Hydrolysis kinetics is not settled, because the hydrolytic enzymes are not necessarily associated with or proportional to the active biomass. • The level of hydrolytic enzymes is not established, and themeasurement is neither simple. 3.8 Hydrolysis of Particulate and Polymeric Substrates
  • 48.
     Kinetics ofhydrolysis • A reliable approach is the first-order kinetics. rhyd  khyd S p rhyd: rate of accumulation of particulate substrate due to hydrolysis (MsL-3T-1) Sp : concentration of the particulate (or large-polymer) substrate (MsL-3) khyd : first-order hydrolysis rate coefficient (T-1) • khyd is proportional to the concentration of hydrolytic enzymes as wellas to the intrinsic hydrolysis kinetics of the enzymes • Some researchers include the active biomass concentration as part of khyd (k´hyd = specific hydrolysis rate coefficient) khyd = k´hyd Xa 3.8 Hydrolysis of Particulate and Polymeric Substrates
  • 49.
    0 = 𝑄𝑆𝑝 0 − 𝑆𝑝 − 𝑘ℎ𝑦𝑑𝑆𝑝𝑉 𝑆𝑝 = 𝑆𝑝 0 1 + 𝑘ℎ𝑦𝑑𝜃 - θ should not be substituted by θx 3.8 Hydrolysis of Particulate and Polymeric Substrates • Mass balance on Sp • The destruction of particulate substrate results in the formation of soluble substrate. q̂S a hyd p K S 0  (S0  S)  X V / Q  k S V / Q S0 effectively is increased by khyd SpV /Q • The steady-state mass balance on soluble substrate q̂S X V  Q(S 0  S) a K  S 0   Mass balance for substrate
  • 50.
    rhydn: rate ofaccumulation of a soluble form of nutrient n by hydrolysis (MnL-3T-1)  n : stoichiometric ratio of nutrient n in the particulate substrate (MnMs -1) • Other constituents of particulate substrate are also conserved during hydrolysis. • Good examples of particulate substrate: nutrient nitrogen,phosphate, sulfur rhydn  nkhyd S p 3.8 Hydrolysis of Particulate and Polymeric Substrates
  • 51.
     Example 3.6 3.8Hydrolysis of Particulate and Polymeric Substrates
  • 52.
    𝑋𝑎 = 𝑌(𝑆0− 𝑆) 1 1 + 𝑏𝜃𝑥 𝜃𝑥 𝜃 Y of casein (pp. 170) [3.54] [3.55]'  Xa Sp Xv  Xi X  X 0  (1 f )bX  i i d a Xv  Xi  Xa [3.55]  1 2 COD’/weight = the conversion factor (pp. 129,181) 3 The biodegradable fraction = 0.8 (pp. 171) [3.53] 3.8 Hydrolysis of Particulate and Polymeric Substrates