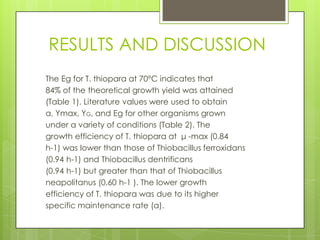
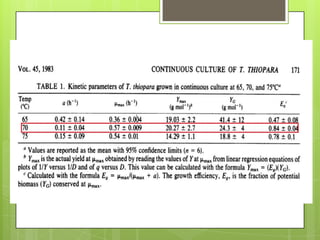
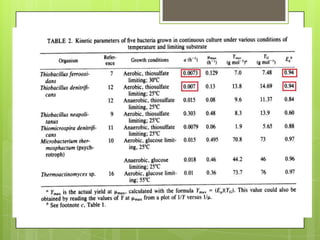
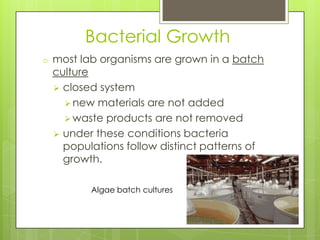
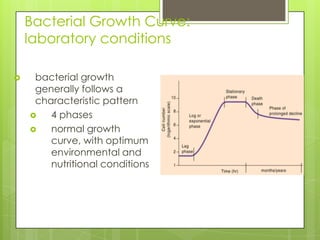
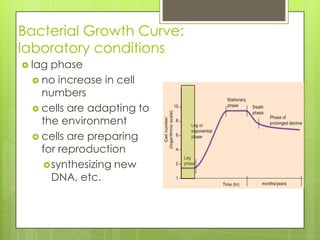
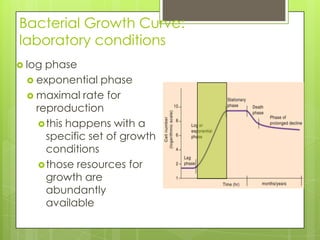
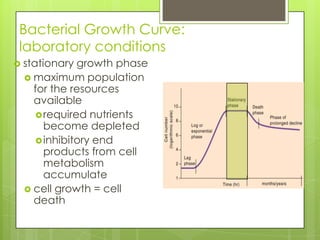
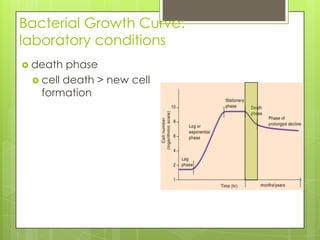
The document discusses bacterial growth in batch and continuous cultures, detailing the phases of growth—including lag, log, stationary, and death phases. It specifically examines the growth kinetics and yield coefficients of the extreme thermophile Thermothrix thiopara under varying temperatures in continuous culture, highlighting methods for determining specific growth rates and growth efficiency. The findings indicate that T. thiopara achieves 84% of the theoretical growth yield, with a growth efficiency lower than some other thiobacilli species due to a higher specific maintenance rate.


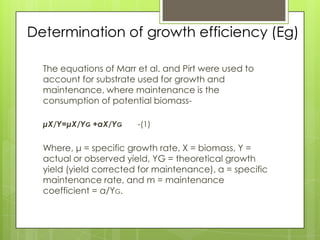
![When μ = μmax, the equation becomes:
μ –maxX/Y = μ–maxX/YG + aX/Y; -(2)
Thus, the total rate of substrate utilization at μ max (μ maxX/YT)
equals the rate used for growth (μ-maxX/YG) plus that used for
maintenance (aX/YG). The fraction
(F) of substrate used for growth at μ -max is:
F = (μ –max X/YG)(μ-maxX/Y) -(3)
Substituting for μ-maxX/Y from equation (2) results in the
following ratio:
F = (μ –max X/YG)/[μ–maxX/YG + aX/Y] -(4)
By cancelling terms and defining F as the growth
efficiency, the following equation is obtained:
Eg = μ-max/(μ-max + a).
Growth efficiency (Eg) can then be determined from
μ -max and the specific maintenance rate (a).](https://image.slidesharecdn.com/vikash-140501033823-phpapp01/85/Vikash-14-320.jpg)