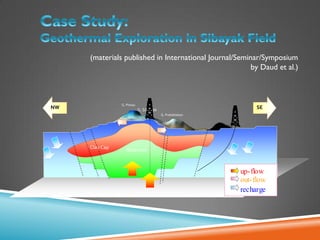
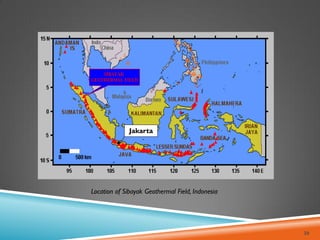
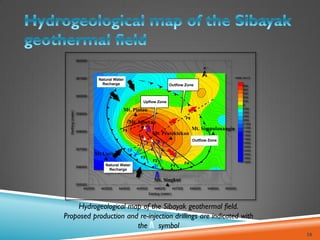
1. Magnetotelluric (MT) methods were used to develop a geothermal conceptual model and drilling strategy for the Sibayak geothermal field in Indonesia.
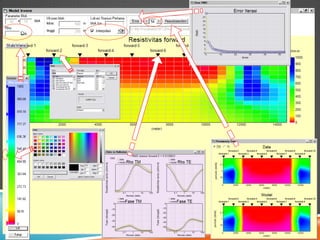
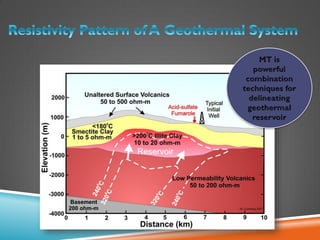
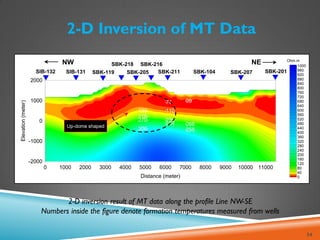
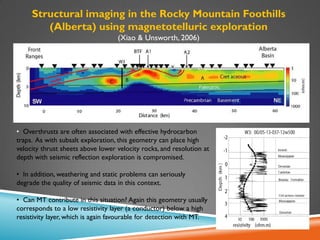
2. 2D inversion of MT data revealed an up-dome shaped resistive layer below an alteration cap, indicating the potential geothermal reservoir.
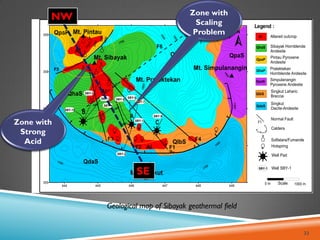
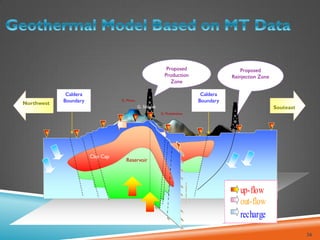
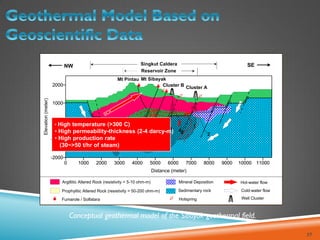
3. Integration of MT data, geology, geochemistry and well data allowed construction of a conceptual model depicting the reservoir zone, alteration zones, and fluid flow paths that guided successful production well siting.