Download to read offline


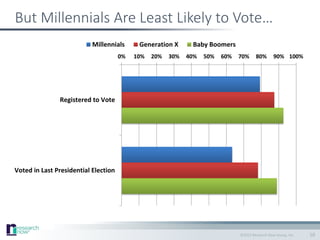

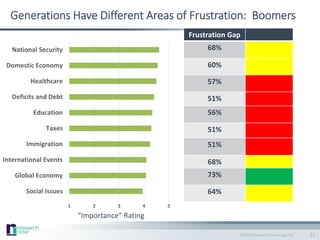


This presentation compares the political and economic sentiments of millennials, Generation X, and baby boomers based on primary research conducted by Research Now. It highlights that millennials are optimistic about the economy, outnumber baby boomers in the workforce, and have different areas of concern compared to older generations. The findings suggest millennials are less likely to vote and more liberal, while baby boomers express greater pessimism regarding national security and immigration.


