


![Chapter 9: Religious Beliefs and Behaviors 85
Chapter 9: Religious Beliefs and Behaviors
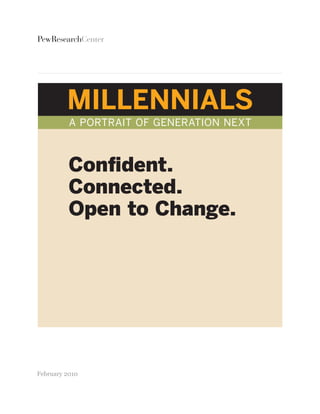
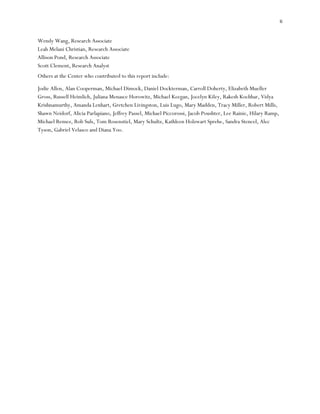
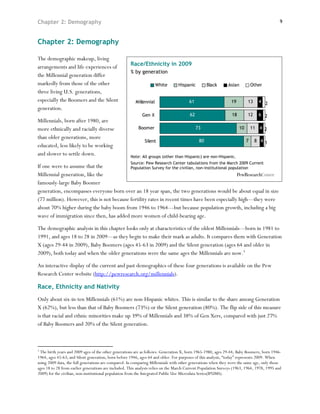
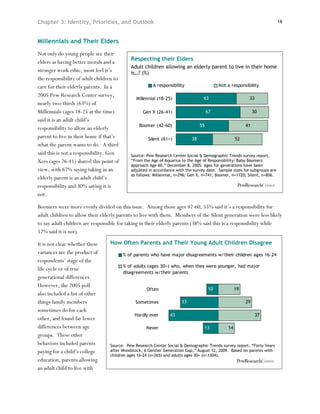
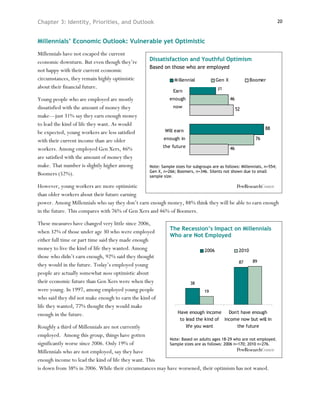
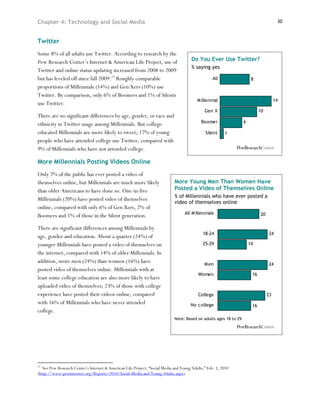
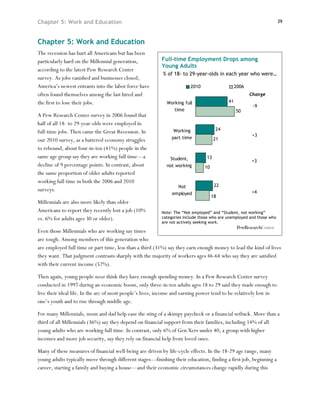
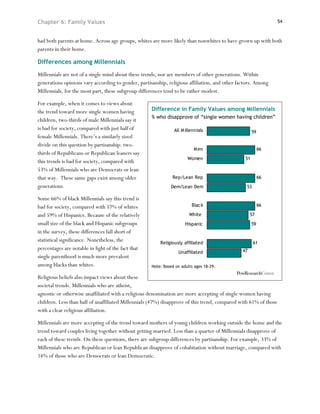
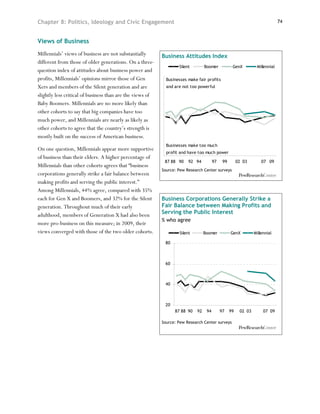
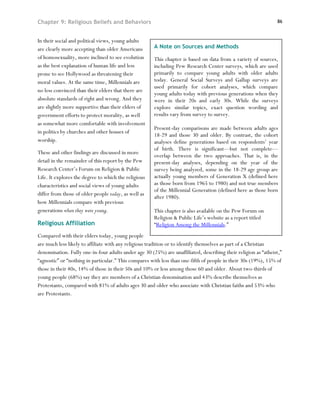
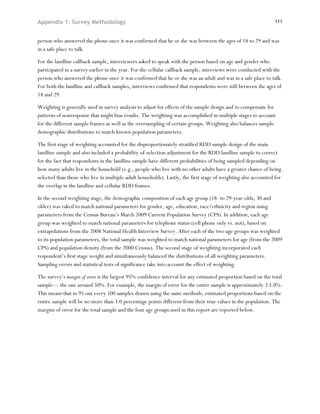
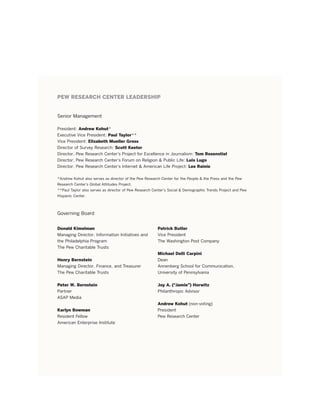
By some key measures, Americans ages 18 to 29 are considerably less religious than older Americans. Fewer
young adults belong to any particular faith than older people do today. They also are less likely to be affiliated
than their parents’ and grandparents’ generations were when they were young. Fully one-in-four members of
the Millennial generation are
unaffiliated with any particular faith. Young People Less Religiously Affiliated
Millennials are also more unaffiliated % unaffiliated with a religion, by generation
than members of Gen Xers were at a
comparable point in their life cycle
(20% in the late 1990s) and twice as
unaffiliated as Baby Boomers were as
young adults (13% in the late 1970s).
Young adults also attend religious
services less often than older
Americans today. And compared
with their elders today, fewer young
people say that religion is very
important in their lives.
Yet in other ways, Millennials remain
fairly traditional in their religious
beliefs and practices. Pew Research
Source: General Social Surveys
Center surveys show, for instance, Question wording: What is your religious preference? Is it Protestant,
Catholic, Jewish, some other religion or no religion?
that young adults’ beliefs about life
after death and the existence of
heaven, hell and miracles closely
resemble the beliefs of older people today. Though young adults pray less often than their elders do today, the
number of young adults who say they pray every Daily Prayer Among Young Adults, by Decade
day rivals the portion of young people who said Among adults ages 18-29 in the…
the same in prior decades. And though belief in 1980s 1990s 2000s
God is lower among young adults than among Pray daily 41 40 45
older adults, Millennials say they believe in God Pray less often 59 60 55
100 100 100
with absolute certainty at rates similar to those
N 2,130 1,224 1,679
seen among Gen Xers a decade ago. This suggests
that some of the religious differences between
Source: General Social Surveys
younger and older Americans today are not Question wording: About how often do you pray? [RESPONSE
entirely generational but result in part from CATEGORIES INCLUDE: Several times a day, once a day, several
times a week, once a week, less than once a week, never.]
people’s tendency to place greater emphasis on
religion as they age.](https://image.slidesharecdn.com/millennials-confident-connected-open-to-change-100302155840-phpapp02/85/Millennials-Confident-Connected-Open-To-Change-92-320.jpg)


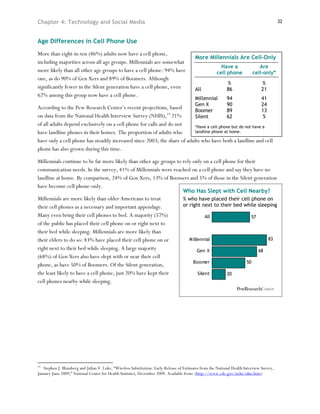
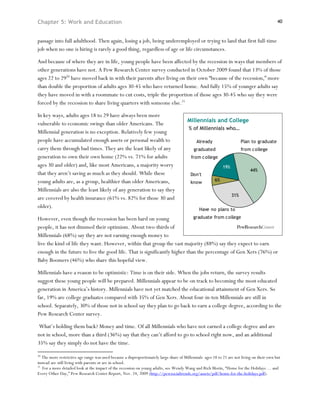
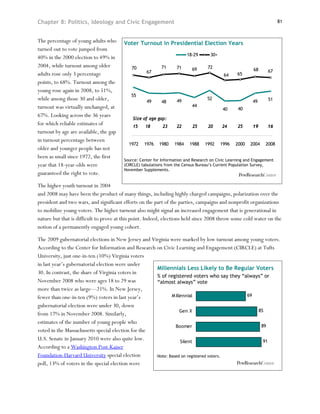
![Chapter 9: Religious Beliefs and Behaviors 89
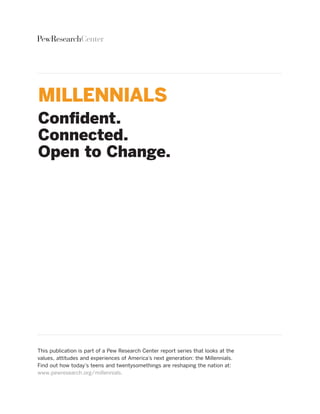
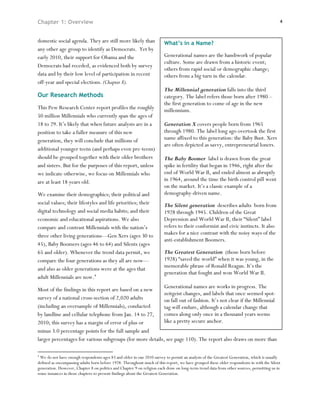
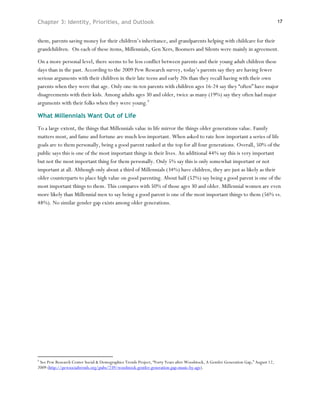
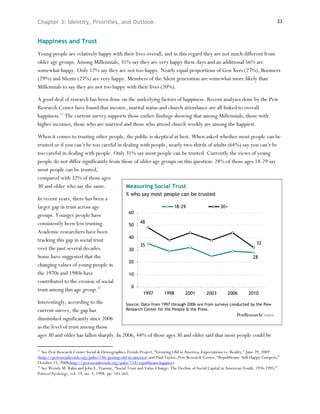
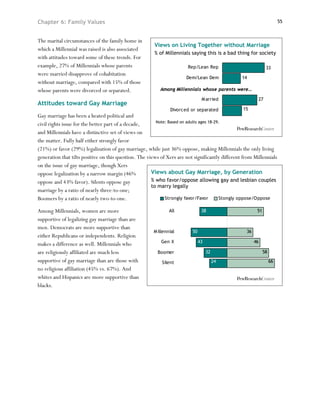
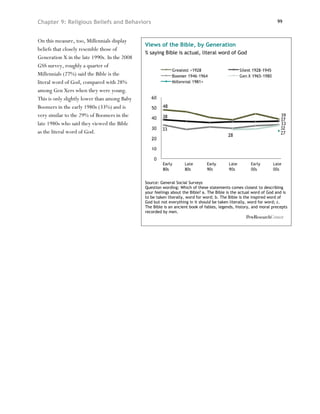
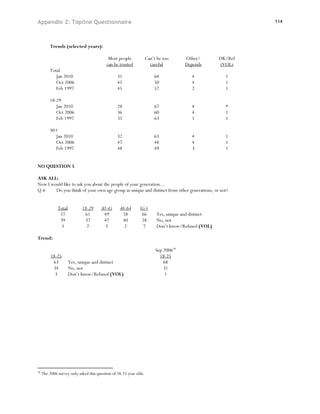
Data from the General Social Surveys
Religious Affiliation Among Young Adults, by Decade
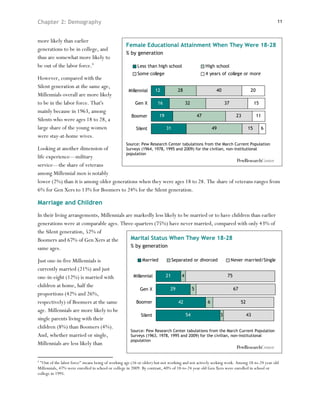
(GSS), which have been conducted
Among adults ages 18-29 in the…
regularly since 1972, confirm that
1970s 1980s 1990s 2000s
young adults are not just more
Unaffiliated % % % %
unaffiliated than their elders today but (no religion) 12 12 16 23
are also more unaffiliated than young Affiliated 88 88 84 77
people have been in recent decades. In 100 100 100 100
GSS surveys conducted since 2000, N 2,722 3,434 2,525 2,711
nearly one-quarter of people ages 18- Source: General Social Surveys
29 have described their religion as
Question wording: What is your religious preference? Is it Protestant, Catholic,
“none.” By comparison, only about Jewish, some other religion or no religion?
half as many young adults were Percentages have been adjusted to exclude nonresponse.
unaffiliated in the 1970s and 1980s.
Among Millennials who are affiliated with a
religion, however, the intensity of their Intensity of Religious Affiliation, by Generation
% saying they are a “strong” member of their religion
religious affiliation is as strong today as
among previous generations when they
were young. More than one-third of
religiously affiliated Millennials (37%)
say they are a “strong” member of their
faith, the same as the 37% of Gen Xers
who said this at a similar age and not
significantly different than among Baby
Boomers when they were young (31%).
Source: General Social Surveys. Based on those affiliated with a religion.
Question wording: Would you call yourself a strong [INSERT RELIGIOUS
PREFERENCE] or a not very strong [INSERT RELIGIOUS PREFERENCE]?](https://image.slidesharecdn.com/millennials-confident-connected-open-to-change-100302155840-phpapp02/85/Millennials-Confident-Connected-Open-To-Change-96-320.jpg)

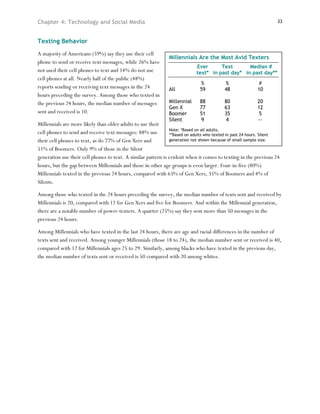
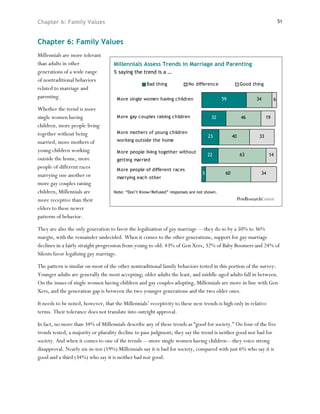
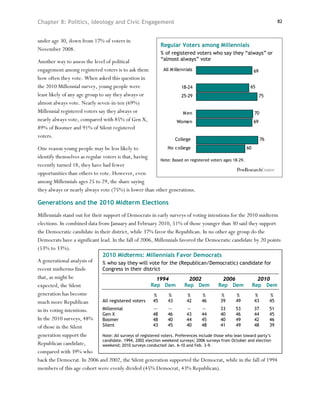
![Chapter 9: Religious Beliefs and Behaviors 91
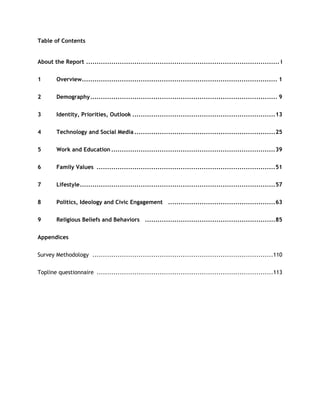
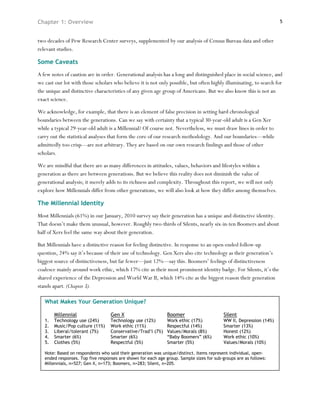
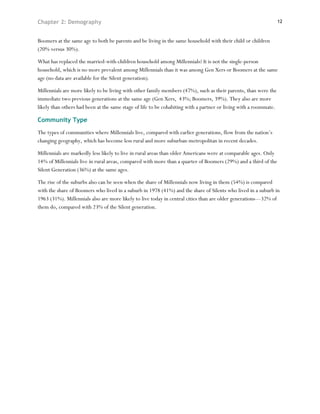
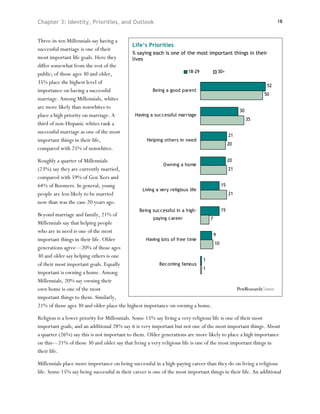
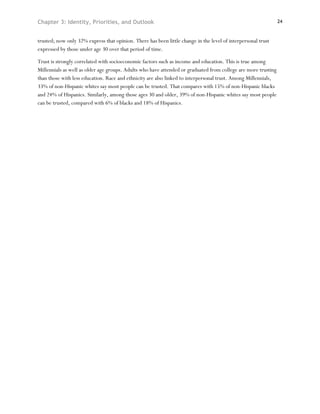
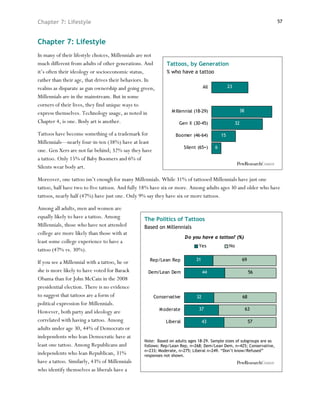
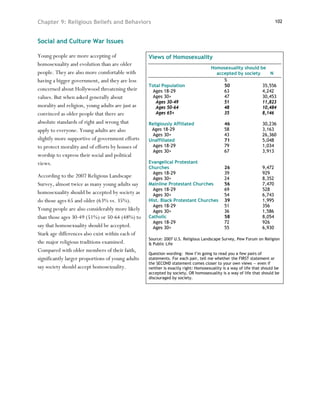
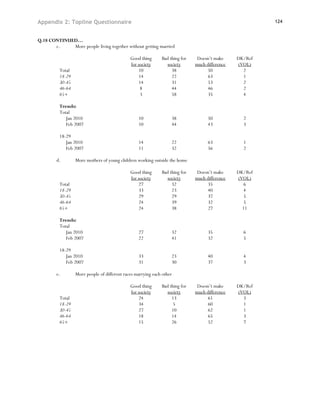
The long-running GSS also finds that
Attendance at Religious Services, by Generation
young people attend religious services
% saying they attend several times a week, every week or
less often than their elders. Furthermore, nearly every week
Millennials currently attend church or
worship services at lower rates than Baby
Boomers did when they were younger;
18% of Millennials currently report
attending religious services weekly or
nearly weekly, compared with 26% of
Boomers in the late 1970s. But
Millennials closely resemble members of
Generation X when they were in their
20s and early 30s, when one-in-five Gen
Xers (21%) reported attending religious
services weekly or nearly weekly.
Source: General Social Surveys.
Question wording: How often do you attend religious services?
[RESPONSE CATEGORIES, USED AS PROBES AS NECESSARY: Never, less
than once a year, about once or twice a year, several times a year,
about once a month, two to three times a month, nearly every week,
every week, several times a week.]](https://image.slidesharecdn.com/millennials-confident-connected-open-to-change-100302155840-phpapp02/85/Millennials-Confident-Connected-Open-To-Change-98-320.jpg)
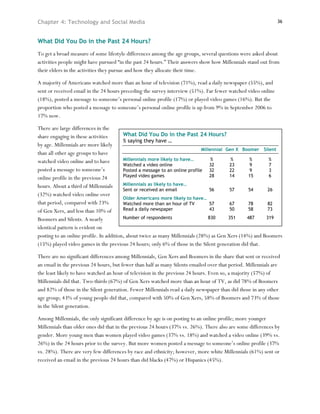
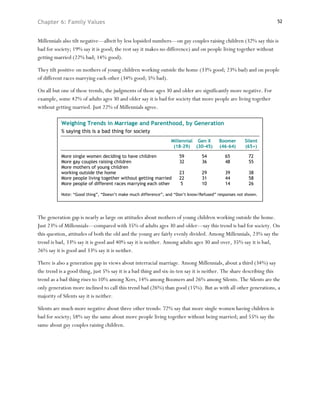
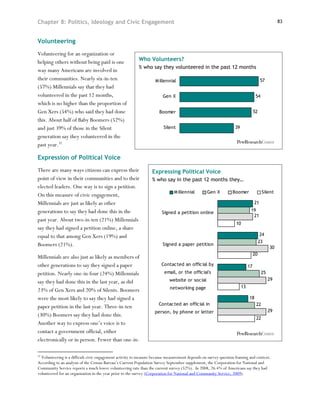
![Chapter 9: Religious Beliefs and Behaviors 92
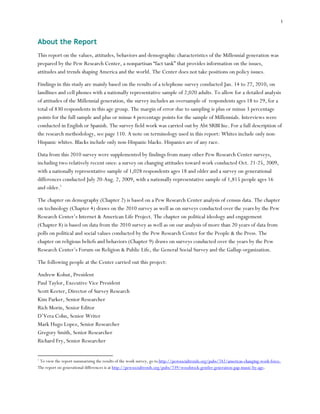
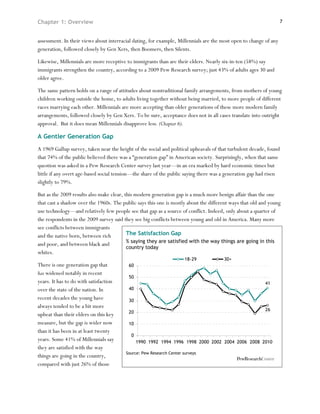
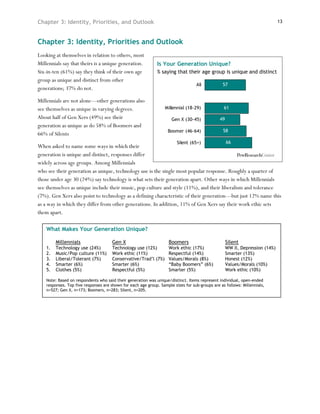
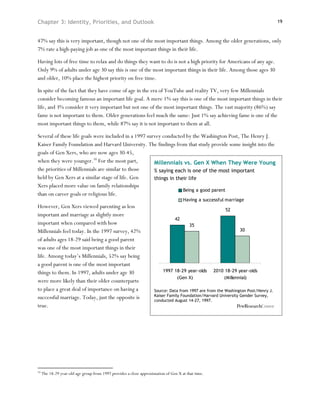
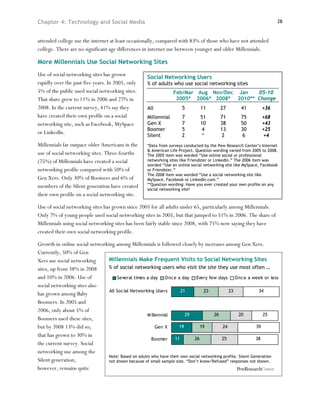
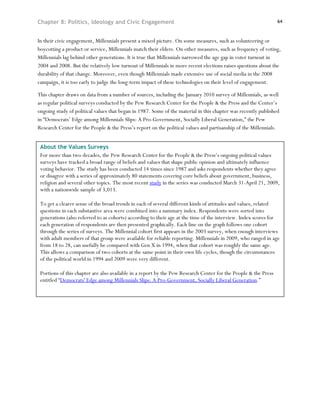
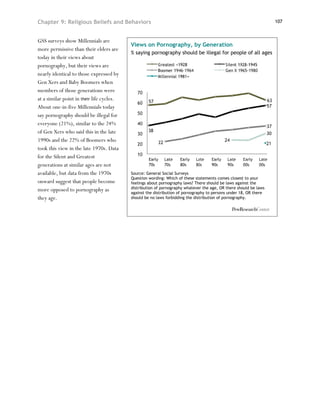
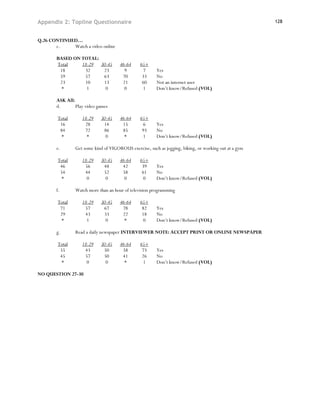
Other Religious Practices
Consistent with their lower levels of affiliation, young adults engage in a number of religious practices less often
than do older Americans, especially the oldest group in the population (those 65 and older). For example, the
2007 Religious Landscape Survey finds that 27% of young adults say they read Scripture on a weekly basis,
compared with 36% of those 30
and older. And one-quarter of Scripture Reading, Prayer and Meditation
adults under 30 say they meditate
on a weekly basis (26%), Read Scripture Pray Meditate
weekly daily weekly N
compared with more than four-in-
ten adults 30 and older (43%).
% % %
These patterns hold true across a Total Population 35 58 39 35,556
variety of religious groups. Ages 18-29 27 48 26 4,242
Ages 30+ 36 60 43 30,453
Ages 30-49 33 56 35 11,823
In addition, less than half of adults Ages 50-64 37 61 46 10,484
under age 30 say they pray every Ages 65+ 43 68 56 8,146
day (48%), compared with 56% Religiously Affiliated 40 65 42 30,236
of Americans ages 30-49, 61% of Ages 18-29 34 58 28 3,163
Ages 30+ 41 66 45 26,360
those in their 50s and early 60s, Unaffiliated 9 22 26 5,048
and more than two-thirds of those Ages 18-29 8 18 21 1,034
Ages 30+ 10 24 28 3,913
65 and older (68%). Age
differences in frequency of prayer Evangelical Protestant
Churches 60 78 46 9,472
are most pronounced among Ages 18-29 51 73 28 929
members of historically black Ages 30+ 62 79 50 8,352
Mainline Protestant Churches 27 53 35 7,470
Protestant churches (70% of those Ages 18-29 23 49 18 528
under age 30 pray every day, Ages 30+ 28 54 37 6,743
Hist. Black Protestant Churches 60 80 55 1,995
compared with 83% among older Ages 18-29 45 70 37 356
members) and Catholics (47% of Ages 30+ 64 83 61 1,586
Catholic 21 58 36 8,054
Catholics under 30 pray every Ages 18-29 17 47 24 926
day, compared with 60% among Ages 30+ 22 60 39 6,930
older Catholics). The differences
are smaller among evangelical and Source: 2007 U.S. Religious Landscape Survey, Pew Forum on Religion & Public Life
mainline Protestants. Question wording: Please tell me how often you do each of the following. How often
do you [read Scripture outside of religious services/meditate]? Would you say at
least once a week, once or twice a month, several times a year, seldom, or never?
People practice their religion in different ways. Outside of attending religious
services, do you pray several times a day, once a day, a few times a week, once a
week, a few times a month, seldom, or never?](https://image.slidesharecdn.com/millennials-confident-connected-open-to-change-100302155840-phpapp02/85/Millennials-Confident-Connected-Open-To-Change-99-320.jpg)
![Chapter 9: Religious Beliefs and Behaviors 93
Although Millennials report praying
Daily Prayer, by Generation
less often than their elders do today,
% saying they pray daily
the GSS shows that Millennials are in
sync with Generation X and Baby
Boomers when members of those
generations were younger. In the 2008
GSS survey, roughly four-in-ten
Millennials report praying daily (41%),
as did 42% of members of Generation
X in the late 1990s. Baby Boomers
reported praying at a similar rate in the
early 1980s (47%), when the first data
are available for them. GSS data show
that daily prayer increases as people get
older.
Source: General Social Surveys
Question wording: About how often do you pray? [RESPONSE CATEGORIES,
USED AS PROBES AS NECESSARY: Several times a day, once a day, several
times a week, once a week, less than once a week, never.]](https://image.slidesharecdn.com/millennials-confident-connected-open-to-change-100302155840-phpapp02/85/Millennials-Confident-Connected-Open-To-Change-100-320.jpg)

![Chapter 9: Religious Beliefs and Behaviors 95
Gallup surveys conducted over the past
Importance of Religion, by Generation
30 years that use a similar measure of
% saying religion is very important in their lives
religion’s importance confirm that
religion is somewhat less important for
Millennials today than it was for
members of Generation X when they
were of a similar age. In Gallup surveys
in the late 2000s, 40% of Millennials
said religion is very important, as did
48% of Gen Xers in the late 1990s.
However, young people today look
very much like Baby Boomers did at a
similar point in their life cycle; in a
1978 Gallup poll, 39% of Boomers said
religion was very important to them.
Source: Gallup surveys
Question wording: How important would you say religion is in your [own]
life … [would you say] very important, fairly important, or not very
important?](https://image.slidesharecdn.com/millennials-confident-connected-open-to-change-100302155840-phpapp02/85/Millennials-Confident-Connected-Open-To-Change-102-320.jpg)
![Chapter 9: Religious Beliefs and Behaviors 96
Similarly, young adults are less convinced of Belief in God
God’s existence than their elders are today;
Absolutely certain
64% of young adults say they are absolutely belief in God N
certain of God’s existence, compared with %
73% of those ages 30 and older. In this case, Total Population 71 35,556
Ages 18-29 64 4,242
differences are most pronounced among Ages 30+ 73 30,453
Catholics, with younger Catholics being 10 Ages 30-49 71 11,823
Ages 50-64 73 10,484
points less likely than older Catholics to believe Ages 65+ 77 8,146
in God with absolute certainty. In other
Religiously Affiliated 79 30,236
religious traditions, age differences are smaller. Ages 18-29 74 3,163
Ages 30+ 80 26,360
Unaffiliated 36 5,048
Ages 18-29 34 1,034
Ages 30+ 37 3,913
Evangelical Protestant
Churches 90 9,472
Ages 18-29 86 929
Ages 30+ 91 8,352
Mainline Protestant
Churches 73 7,470
Ages 18-29 70 528
Ages 30+ 73 6,743
Hist. Black Protestant
Churches 90 1,995
Ages 18-29 88 356
Ages 30+ 91 1,586
Catholic 72 8,054
Ages 18-29 64 926
Ages 30+ 74 6,930
Source: 2007 U.S. Religious Landscape Survey, Pew Forum on
Religion & Public Life
Question wording: Do you believe in God or a universal spirit? [IF
YES, ASK:] How certain are you about this belief? Are you absolutely
certain, fairly certain, not too certain, or not at all certain?](https://image.slidesharecdn.com/millennials-confident-connected-open-to-change-100302155840-phpapp02/85/Millennials-Confident-Connected-Open-To-Change-103-320.jpg)

![Chapter 9: Religious Beliefs and Behaviors 98
Differences between young people and their elders today are also apparent in views of the Bible, although the
differences are somewhat less pronounced. Overall, young people are slightly less inclined than those in older
age groups to view the Bible as the literal word of God. Interestingly, age differences on this item are most
dramatic among young evangelicals and are virtually nonexistent in other groups. Although younger evangelicals
are just as likely as older evangelicals (and more likely than people in most other religious groups) to see the
Bible as the word of God, they are less likely than older evangelicals to see it as the literal word of God. Less
than half of young evangelicals interpret the Bible literally (47%), compared with 61% of evangelicals 30 and
older.
Views of Scripture
Scripture is word of God
Not word of
NET word Literal, word Not God / Other /
of God for word literal Don’t know N
% % % %
Total Population 63 33 30 37=100 35,556
Ages 18-29 59 28 31 41=100 4,242
Ages 30+ 64 34 30 36=100 30,453
Ages 30-49 63 32 30 37=100 11,823
Ages 50-64 62 33 29 38=100 10,484
Ages 65+ 70 39 31 30=100 8,146
Religiously Affiliated 71 37 34 29=100 30,236
Ages 18-29 71 35 37 29=100 3,163
Ages 30+ 71 38 33 29=100 26,360
Unaffiliated 25 11 14 75=100 5,048
Ages 18-29 26 11 15 74=100 1,034
Ages 30+ 25 11 14 75=100 3,913
Evangelical Protestant Churches 88 59 29 12=100 9,472
Ages 18-29 88 47 41 12=100 929
Ages 30+ 88 61 27 12=100 8,352
Mainline Protestant Churches 61 22 38 39=100 7,470
Ages 18-29 60 21 39 40=100 528
Ages 30+ 61 23 39 39=100 6,743
Hist. Black Protestant Churches 84 62 22 16=100 1,995
Ages 18-29 83 59 24 17=100 356
Ages 30+ 84 63 21 16=100 1,586
Catholic 62 23 39 38=100 8,054
Ages 18-29 62 25 36 38=100 926
Ages 30+ 62 22 40 38=100 6,930
Source: 2007 U.S. Religious Landscape Survey, Pew Forum on Religion & Public Life
Question wording: Which comes closest to your view? [HOLY BOOK*] is the word of God, or [HOLY BOOK] is
a book written by men and is not the word of God? [IF WORD OF GOD, ASK:] And would you say that [HOLY
BOOK] is to be taken literally, word for word, OR not everything in [HOLY BOOK] should be taken literally,
word for word?
*For Christians and the unaffiliated, "the Bible" was inserted for HOLY BOOK; for Jews, "the Torah" was
inserted; for Muslims, "the Koran" was inserted; for members of other faiths, "the holy scripture" was
inserted.](https://image.slidesharecdn.com/millennials-confident-connected-open-to-change-100302155840-phpapp02/85/Millennials-Confident-Connected-Open-To-Change-105-320.jpg)
![Chapter 9: Religious Beliefs and Behaviors 100
On still other measures of religious belief, there are few differences in the beliefs of young people compared
with their elders today. Adults under 30, for instance, are just as likely as older adults to believe in life after
death (75% vs. 74%), heaven (74% each), hell (62% vs. 59%) and miracles (78% vs. 79%). In fact, on several
of these items, young mainline Protestants and members of historically black Protestant churches exhibit
somewhat higher levels of belief than their elders.
Beliefs about Afterlife, Miracles, and Angels and Demons
Believe in…
Life after Angels and
death Heaven Hell Miracles demons N
% % % % %
Total Population 74 74 59 79 68 35,556
Ages 18-29 75 74 62 78 67 4,242
Ages 30+ 74 74 59 79 69 30,453
Ages 30-49 74 75 61 79 71 11,823
Ages 50-64 75 72 58 80 69 10,484
Ages 65+ 71 74 57 76 62 8,146
Religiously Affiliated 79 81 65 83 74 30,236
Ages 18-29 82 84 72 85 76 3,163
Ages 30+ 79 80 64 83 74 26,360
Unaffiliated 48 41 30 55 40 5,048
Ages 18-29 54 46 34 58 42 1,034
Ages 30+ 45 39 28 53 40 3,913
Evangelical Protestant Churches 86 86 82 88 87 9,472
Ages 18-29 86 89 85 87 85 929
Ages 30+ 86 86 81 89 87 8,352
Mainline Protestant Churches 78 77 56 81 65 7,470
Ages 18-29 86 85 70 84 68 528
Ages 30+ 77 77 54 81 65 6,743
Hist. Black Protestant Churches 79 91 82 88 87 1,995
Ages 18-29 84 94 88 93 92 356
Ages 30+ 77 90 80 87 86 1,586
Catholic 77 82 60 83 69 8,054
Ages 18-29 78 82 63 85 70 926
Ages 30+ 77 82 59 83 69 6,930
Source: 2007 U.S. Religious Landscape Survey, Pew Forum on Religion & Public Life
Question wording: Do you believe in life after death?
Do you think there is a heaven, where people who have led good lives are eternally rewarded?
Do you think there is a hell, where people who have led bad lives and die without being sorry are eternally punished?
Here are a few statements. For each one, please tell me if you completely agree with it, mostly agree with it, mostly
disagree with it, or completely disagree with it. The first/next one is [miracles still occur today as in ancient times/angels
and demons are active in the world].](https://image.slidesharecdn.com/millennials-confident-connected-open-to-change-100302155840-phpapp02/85/Millennials-Confident-Connected-Open-To-Change-107-320.jpg)


![Chapter 9: Religious Beliefs and Behaviors 104
Roughly half of young adults
Views on Abortion
(52%) say abortion should be
Abortion should be…
legal in all or most cases. On
this issue, young adults Legal in all/ Illegal in all/ Don’t
most cases most cases know N
express slightly more % % %
permissive views than do Total Population 47 44 9=100 5,534
Ages 18-29 52 44 5=100 761
adults ages 30 and older. Ages 30+ 46 45 10=100 4,679
However, the group that Ages 30-49 48 44 8=100 1,627
Ages 50-64 48 42 10=100 1,664
truly stands out on this issue Ages 65+ 37 51 12=100 1,388
is people 65 and older, just
Religiously Affiliated 42 49 9=100 4,648
37% of whom say abortion Ages 18-29 45 50 5=100 541
should be legal in most or all Ages 30+ 42 49 10=100 4,039
Unaffiliated 68 25 7=100 807
cases. Ages 18-29 67 28 5=100 210
Ages 30+ 69 23 8=100 582
Interestingly, this pattern
White Evangelical Protestant 23 71 6=100 1,266
represents a significant change Ages 18-29 Sample size too small for analysis
from earlier polling. Ages 30+ 23 70 6=100 1,162
White Mainline Protestant 55 34 11=100 1,116
Previously, people in the Ages 18-29 55 37 8=100 115
middle age categories (i.e., Ages 30+ 56 34 11=100 980
Catholic 45 45 10=100 1,199
those ages 30-49 and 50-64) Ages 18-29 45 51 4=100 156
Ages 30+ 44 44 11=100 1,025
tended to be more supportive
of legal abortion, while the Source: Aggregated Pew Research Center surveys, 2009
youngest and oldest age Question wording: Do you think abortion should be legal in all cases, legal in most
cases, illegal in most cases or illegal in all cases? [Response categories read in reverse
groups were more opposed. order for half of sample]
In 2009, however, attitudes
Note: Most of the analyses in this report compare responses among Protestant groups
toward abortion moved in a as defined by denominational affiliation. In this table, however, Protestants are
categorized as "white evangelicals" or "white mainline Protestants" on the basis of
more conservative direction their race and their responses to a question asking if they think of themselves as
among most groups in the "born-again or evangelical" Christians.
population, with the notable
exception of young people. The result of this conservative turn among those in the 30-49 and 50-64 age brackets
means that their views now more closely resemble those of the youngest age group, while those in the 65-and-
older group now express the most conservative views on abortion of any age group.](https://image.slidesharecdn.com/millennials-confident-connected-open-to-change-100302155840-phpapp02/85/Millennials-Confident-Connected-Open-To-Change-111-320.jpg)
![Chapter 9: Religious Beliefs and Behaviors 105
Surveys also show that large Evolution, Hollywood and Size of Government
numbers of young adults (67%)
Evolution best Agree Prefer bigger
say they would prefer a bigger explanation for Hollywood government,
human life threatens values more services N
government that provides more
% % %
services over a smaller Total Population 48 42 46 35,556
Ages 18-29 55 33 67 4,242
government that provides fewer Ages 30+ 47 44 41 30,453
services. Among older Ages 30-49 49 41 48 11,823
Ages 50-64 47 46 39 10,484
Americans, only 41% feel this Ages 65+ 40 48 31 8,146
way. Fewer young people than
Religiously Affiliated 44 45 46 30,236
older people see their moral Ages 18-29 49 36 68 3,163
values as under assault from Ages 30+ 43 47 41 26,360
Unaffiliated 72 28 48 5,048
Hollywood; one-third of adults Ages 18-29 73 25 64 1,034
under age 30 agree that Ages 30+ 71 29 41 3,913
Hollywood and the entertainment Evangelical
industry threatens their values, Protestant Churches 24 53 41 9,472
Ages 18-29 27 42 65 929
compared with 44% of people 30 Ages 30+ 23 55 36 8,352
and older. And more than half of Mainline Protestant
Churches 51 41 37 7,470
young adults (55%) believe that Ages 18-29 52 32 62 528
evolution is the best explanation Ages 30+ 50 42 33 6,743
Hist. Black
for the development of human Protestant Churches 38 35 72 1,995
life, compared with 47% of Ages 18-29 47 29 81 356
Ages 30+ 36 36 69 1,586
people in older age groups. These Catholic 58 43 51 8,054
patterns are seen both in the total Ages 18-29 68 35 73 926
Ages 30+ 56 45 46 6,930
population and within a variety of
Source: 2007 U.S. Religious Landscape Survey, Pew Forum on Religion & Public Life
religious traditions, though the
link between age and views on Question wording: Now, as I read some statements on a few different topics, please
tell me if you completely agree, mostly agree, mostly DISagree or completely
evolution is strongest among disagree with each one. [Evolution is the best explanation for the origins of human
life on earth / I often feel that my values are threatened by Hollywood and the
Catholics and members of entertainment industry]
historically black Protestant
If you had to choose, would you rather have a smaller government providing fewer
churches. services, or a bigger government providing more services?](https://image.slidesharecdn.com/millennials-confident-connected-open-to-change-100302155840-phpapp02/85/Millennials-Confident-Connected-Open-To-Change-112-320.jpg)


![Chapter 9: Religious Beliefs and Behaviors 109
Selected Religious Beliefs and Practices among Ages 18-29 by Decade
1970s 1980s 1990s 2000s
Religious Affiliation % % % %
Unaffiliated 12 12 16 23
Affiliated 88 88 84 77
100 100 100 100
N 2,722 3,434 2,525 2,711
Question wording: What is your religious preference? Is it Protestant, Catholic, Jewish, some other religion or no religion?
Service Attendance
Attend nearly weekly 26 25 22 21
Attend less 74 75 78 79
100 100 100 100
N 2,722 3,432 2,486 2,697
Question wording: How often do you attend religious services? [Response categories, used as probes if necessary: Never, less than
once a year, about once or twice a year, several times a year, about once a month, 2-3 times a month, nearly every week, every
week, several times a week]
Frequency of prayer
Pray daily NA 41 40 45
Pray less 59 60 55
100 100 100
N 2,130 1,224 1,679
Question wording: About how often do you pray? [Response categories, use as probes if necessary: include: Several times a day,
once a day, several times a week, once a week, less than once a week, never.]
Belief in God
Certain God exists NA 55 59 53
Less certain/doesn’t exist 45 41 47
100 100 100
N 356 1,041 1,097
Question wording: Please look at this card and tell me which statement comes closest to expressing what you believe about God:
I don't believe in God; I don't know whether there is a God and I don't believe there is any way to find out; I don't believe in a
personal God, but I do believe in a Higher Power of some kind; I find myself believing in God some of the time but not at others;
While I have doubts, I feel that I do believe in God; I know God really exists and I have no doubts about it.
Belief in an afterlife
Believe in afterlife 73 79 80 82
Don’t believe 27 21 20 18
100 100 100 100
N 1,439 2,298 1,587 1,654
Question wording: Do you believe there is a life after death?
View of the Bible
Bible literal word of God NA 33 31 30
Not literal/book of fables 67 69 70
100 100 100
N 1,205 1,755 1,810
Question wording: Which of these statements comes closest to describing your feelings about the Bible? The Bible is the actual
word of God and is to be taken literally, word for word; The Bible is the inspired word of God but not everything in it should be
taken literally, word for word; The Bible is an ancient book of fables, legends, history, and moral precepts recorded by men.
Source for all items: General Social Surveys. Results based on total answering.](https://image.slidesharecdn.com/millennials-confident-connected-open-to-change-100302155840-phpapp02/85/Millennials-Confident-Connected-Open-To-Change-116-320.jpg)


![Appendix 2: Topline Questionnaire 115
ASK IF YES (Q.6=1) [n=1,205]:
Q.7 Can you tell me some ways in which your generation is unique or distinct? [OPEN-ENDED; RECORD VERBATIM
RESPONSE. PROBE ONCE IF RESPONDENT ANSWERS “DON’T KNOW”; ACCEPT UP TO THREE
RESPONSES]
BASED ON ALL MENTIONS:
All 18-29 30-45 46-64 65+
56 (NET) Different Values/Traits/Attitudes 47 47 63 66
11 Work ethic/Hardworking/Motivated 5 11 17 10
8 Respectful 2 5 14 8
7 Smarter/More well-educated/Wiser 6 6 5 13
5 Values/Morals/Religious beliefs 1 2 8 10
4 Conservative/Old-fashioned/Traditional 1 7 4 5
4 Trustworthy/Honest/Honorable 1 1 3 12
3 Caring/Giving/Helpful/Compassionate 1 3 5 5
3 Liberal/Open to change/Open- 7 3 2 1
minded/Tolerant/Progressive
3 Responsible/Reliable 1 3 5 2
2 Laid back/Relaxed/Carefree/Down to earth 1 3 2 2
2 More rebellious/ disobedient/ unruly/ 3 1 2 1
disrespectful
2 General attitude/the way we act/think/do things 5 2 * 1
2 Thrifty/Careful with money * 1 1 5
2 Politically active/Civically engaged 2 1 2 2
2 Selfish/Spoiled/Self-centered 2 1 2 1
2 Expressive/Outspoken/Outgoing/Bold 4 2 0 0
1 Creative/Innovative/Artistic 2 1 1 1
1 Lazy/Not hard-working 3 1 * 1
1 Independent 2 1 1 *
1 More environmentally aware * 1 2 0
4 Other different values/traits/attitudes mentions 5 4 4 5
13 (NET) Different Use of Modern Technology 27 15 6 5
10 Technology use 24 12 3 2
2 Communication 4 0 1 2
2 Other different use of technology mentions 1 3 3 2
12 (NET) Different Behaviors and Lifestyles 17 15 8 9
5 Music/Pop culture/Style/Lifestyle/Trend setters 11 3 4 2
2 Clothes/the way we dress 5 2 1 0
1 Different outlook on jobs/careers 1 2 1 1
1 More violence/drugs/crime 1 * * 1
1 More opportunity/More choice 1 1 * 1
4 Other different behaviors and lifestyles mentions 4 6 3 5
9 (NET) Different Historical Experiences 2 4 14 18
4 Seen many changes/Lived through hard 1 1 3 14
times(WWII, Depression)
2 Lived through the sixties/Vietnam 0 1 5 2
Era/Hippies/Flower children
2 Baby Boomers 0 * 6 1
2 Other historical experiences mentions 1 2 2 2
8 (NET) General 8 7 6 11
3 Just different 4 2 2 2
1 Better/Stronger * 0 * 4](https://image.slidesharecdn.com/millennials-confident-connected-open-to-change-100302155840-phpapp02/85/Millennials-Confident-Connected-Open-To-Change-122-320.jpg)
![Appendix 2: Topline Questionnaire 116
4 Other general miscellaneous mentions 4 5 4 4
3 Family dynamics/Family-oriented/Different approach 2 3 5 3
to families
1 Other different demographics mentions 2 1 * 1
2 Don’t know/Refused 1 0 3 3
ASK ALL:
Thinking about the government,
Q.7a Which comes closer to your view, even if neither is exactly right? [READ AND RANDOMIZE]?
Total 18-29 30-45 46-64 65+
45 53 45 43 39 Government should do more to solve problems [OR]
47 42 47 50 47 Government is doing too many things better left to
businesses and individuals
8 6 8 7 14 Don’t know/Refused (VOL)
Trend for comparison (among 2008 voters):
Government is doing too
Government should do many things better left to DK/Ref
more to solve problems businesses and individuals (VOL)
Total
Jan 2010 43 51 6
Nov 2008 NEP exit poll 50 44 6
18-29
Jan 2010 50 45 5
Nov 2008 NEP exit poll 69 27 4
ASK ALL:
Q.8 Here are some goals that people value in their lives. Some people say these things are very important to them. Others
say they are not so important. Please tell me how important each is to you personally. First [INSERT FIRST ITEM;
RANDOMIZE], is that one of the most important things in your life, very important but not the most, somewhat
important, or not important? How about [INSERT NEXT ITEM]? [REPEAT AS NECESSARY “is that one of the
most important things in your life, very important but not the most, somewhat important, or not important?”]
a. Being successful in a high-paying career or profession
Washington Post /
Kaiser /Harvard
Aug 1997
Total 18-29 30-45 46-64 65+ Total 18-29
9 15 10 4 5 One of the most important things 9 13
36 47 40 28 28 Very important but not the most 32 45
34 27 33 41 32 Somewhat important 39 31
21 10 17 25 32 Not important 20 10
1 * 0 1 3 Don’t know/Refused (VOL) * 0](https://image.slidesharecdn.com/millennials-confident-connected-open-to-change-100302155840-phpapp02/85/Millennials-Confident-Connected-Open-To-Change-123-320.jpg)

![Appendix 2: Topline Questionnaire 118
Q.8 CONTINUED….
g. Helping other people who are in need
Total 18-29 30-45 46-64 65+
20 21 19 20 21 One of the most important things
60 60 59 61 59 Very important but not the most
18 17 19 17 19 Somewhat important
1 2 2 1 * Not important
1 1 1 1 1 Don’t know/Refused (VOL)
h. Owning your own home
Total 18-29 30-45 46-64 65+
20 20 19 18 28 One of the most important things
53 53 55 57 43 Very important but not the most
20 21 20 18 20 Somewhat important
7 6 6 7 9 Not important
1 0 0 1 1 Don’t know/Refused (VOL)
ASK ALL:
On another subject…
INT1 Do you use the internet, at least occasionally?
INT2 Do you send or receive email, at least occasionally?
Total 18-29 30-45 46-64 65+
77 90 87 79 40 Yes to either (internet users)
23 10 13 21 60 No to both (non internet users)
0 0 0 0 0 Don’t know/Refused (VOL)
ASK ALL:
Q.9 Here are some activities some people do and others do not. For each, please tell me if you have done this in the past 12
months or not. (First/next) In the past 12 months, have you... [READ AND RANDOMIZE ITEMS IN BLOCKS
a-d AND e-f. ALSO RANDOMIZE WITHIN BLOCKS],or not?
a. Contacted a government official in person, by phone or by letter
Total 18-29 30-45 46-64 65+
23 18 22 29 22 Yes, did this
76 82 78 71 78 No, did not
* 1 * * 0 Don’t know/Refused (VOL)
ASK Q.9b AND 9c OF ALL INTERNET USERS (INT1=1 OR INT2=1):
b. Contacted a government official by sending an email or posting a message on their website or social
networking page
BASED ON TOTAL:
Total 18-29 30-45 46-64 65+
22 17 25 29 13 Yes, did this
55 74 61 50 28 No, did not
23 10 13 21 60 Not an internet user
* 0 * * 0 Don’t know/Refused (VOL)](https://image.slidesharecdn.com/millennials-confident-connected-open-to-change-100302155840-phpapp02/85/Millennials-Confident-Connected-Open-To-Change-125-320.jpg)
![Appendix 2: Topline Questionnaire 119
Q.9 CONTINUED….
c. Signed a petition online
BASED ON TOTAL:
Total 18-29 30-45 46-64 65+
19 21 19 21 10 Yes, did this
58 68 67 57 31 No, did not
23 10 13 21 60 Not an internet user
1 1 1 1 0 Don’t know/Refused (VOL)
ASK ALL:
d. Signed a paper petition
Total 18-29 30-45 46-64 65+
25 24 23 30 20 Yes, did this
75 75 77 69 80 No, did not
1 1 1 1 * Don’t know/Refused (VOL)
e. Bought a certain product or service because you like the social or political values of the company that provides it
Total 18-29 30-45 46-64 65+
28 34 30 27 18 Yes, did this
70 65 69 71 78 No, did not
2 1 1 2 4 Don’t know/Refused (VOL)
f. Decided NOT to buy a certain product or service because you disagree with the social or political values of the
company that provides it
Total 18-29 30-45 46-64 65+
33 35 34 36 25 Yes, did this
65 64 65 62 70 No, did not
2 1 1 2 5 Don’t know/Refused (VOL)
ASK ALL:
Q.10 In the 2008 presidential election between Barack Obama and John McCain, did things come up that kept you from
voting, or did you happen to vote?
Total 18-29 30-45 46-64 65+
73 59 68 81 82 Voted
27 40 31 19 17 Did not vote (includes too young to vote)
* 1 * 0 0 Don't remember if voted (VOL)
* * * 0 1 Refused (VOL)
ASK IF YES (Q.10=1) [n=1,474]:
Q.10a Did you vote for Obama, McCain or someone else?
Total 18-29 30-45 46-64 65+
49 63 51 45 42 Obama
36 29 33 41 39 McCain
5 4 8 4 4 Other candidate
2 1 1 2 2 Don't remember which candidate (VOL)
8 3 8 8 12 Refused (VOL)
(n=505) (n=256) (n=400) (n=282)](https://image.slidesharecdn.com/millennials-confident-connected-open-to-change-100302155840-phpapp02/85/Millennials-Confident-Connected-Open-To-Change-126-320.jpg)
![Appendix 2: Topline Questionnaire 120
ASK IF NO OR DK/REF (Q.10=2,8,9) [n=546]:
Q.10b Did you favor Obama, McCain or someone else?
Total 18-29
43 48 Obama
14 15 McCain
19 18 Other candidate
11 10 Don't remember which candidate (VOL)
13 10 Refused (VOL)
(n=325)
NO QUESTIONS 11-12
ASK ALL:
Thinking more generally,
Q.13 How often would you say you vote... [READ]
Total 18-29 30-45 46-64 65+
47 33 40 52 65 Always
23 19 24 27 17 Nearly always
9 14 9 8 7 Part of the time[OR]
10 14 13 7 7 Seldom
10 18 13 6 3 Never vote (VOL)
1 2 * * 1 Other response (VOL)
* * 0 * 1 Don’t know/Refused (VOL)
ASK ALL:
Q.14 Thinking about the 2008 election, Barack Obama said that if he was elected president, he would change the way things
work in Washington. Since he’s been in office, do you think the way things work in Washington has changed, or not?
Total 18-29 30-45 46-64 65+
47 46 51 41 49 Yes, has changed
47 48 43 52 43 No, has not changed
7 6 6 7 8 Don’t know/Refused (VOL)
IF NO (Q.14=2), ASK [n=946]:
Q.15 What do you think is the main reason things have not changed in Washington? Is it because … [READ AND
RANDOMIZE]?
Total 18-29 30-45 46-64 65+
25 30 25 26 17 Obama hasn’t really tried to change things [OR]
60 56 60 62 64 Opponents and special interests have prevented change
15 15 15 12 19 Neither (VOL)/ Don’t know/Refused (VOL)
(n=384) (n=160) (n=245) (n=140)
ASK ALL:
EDUC What is the last grade or class that you completed in school? [DO NOT READ]
Total 18-29 30-45 46-64 65+
14 16 14 10 21 Less than high school
36 34 30 40 42 High school graduate (Grade 12 or GED certificate)
22 31 21 20 15 Some college, no 4-year degree (including associate degree)
28 19 35 30 22 College graduate+ (B.S., B.A., or other 4-year degree)
* * 0 0 0 Don’t know/Refused (VOL)](https://image.slidesharecdn.com/millennials-confident-connected-open-to-change-100302155840-phpapp02/85/Millennials-Confident-Connected-Open-To-Change-127-320.jpg)
![Appendix 2: Topline Questionnaire 121
ASK IF AGE < 65 [n=1,668]:
SCHL Are you currently enrolled in school?
[IF YES, PROBE TO DETERMINE IF ATTENDING HIGH SCHOOL, TECHNICAL TRADE OR
VOCATIONAL SCHOOL, A COLLEGE UNDERGRADUATE OR IN GRADUATE SCHOOL]
Total 18-29 30-45 46-64
16 39 11 5 Yes
2 5 1 * in High School
1 3 1 1 in Technical, trade, or vocational school
10 26 5 3 in College (Undergraduate)
3 5 4 1 in Graduate School
84 61 89 95 No
0 * 0 0 Don’t know/Refused (VOL)
Trend:
Sep 200635
18-29 18-29
39 Yes 36
5 in High School 5
3 in Technical, trade, or vocational school 2
26 in College (Undergraduate) 25
5 in Graduate School 4
61 No 63
* Don’t know/Refused (VOL) 1
ASK IF AGE < 65 AND CURRENTLY ENROLLED IN SCHOOL (SCHL=1,2,3,4) [n=409]:
SCHL2 How much further in school do you plan to go? [DO NOT READ]
Sep 2006
18-29 18-29
1 Finish high school 2
5 Technical, trade, or vocational school 3
8 Attend college, no degree or 2 year/associate degree 12
34 Attend college, bachelor’s degree 30
47 Graduate or professional school or degree 50
0 No further (VOL) 1
2 Other [Specify] (VOL) 1
3 Don’t know/Refused (VOL) 1
(n=349)
NO QUESTION 16
35
The 2006 survey only asked 18-39 year olds of this question.](https://image.slidesharecdn.com/millennials-confident-connected-open-to-change-100302155840-phpapp02/85/Millennials-Confident-Connected-Open-To-Change-128-320.jpg)
![Appendix 2: Topline Questionnaire 122
ASK IF AGE < 65 AND NOT ENROLLED IN SCHOOL (SCHL=5,9) [n=1,259]:
RSCHL Do you ever plan to return to school?
18-64 18-29 30-45 46-64
36 65 39 20 Yes
57 29 53 74 No
7 6 9 6 Don’t know/Refused (VOL)
(n=481) (n=312) (n=466)
Trend:
Sep 2006
18-29 18-29
65 Yes 65
29 No 27
6 Don’t know/Refused (VOL) 8
ASK IF AGE < 65 AND PLANS TO RETURN TO SCHOOL (RSCHL=1) [n=553]:
RSCHL2 How much further in school do you plan to go? [DO NOT READ]
18-64 18-29 30-45
3 4 2 Finish high school
9 9 7 Technical, trade, or vocational school
12 15 10 Attend college, no degree or 2 year/associate degree
25 30 28 Attend college, bachelor’s degree
32 32 36 Graduate or professional school or degree
1 0 1 No further (VOL)
8 2 9 Other [Specify] (VOL)
11 6 7 Don’t know/Refused (VOL)
(n=330) (n=128)
Trend:
Sep 2006
18-29 18-29
4 Finish high school 10
9 Technical, trade, or vocational school 10
15 Attend college, no degree or 2 year/associate degree 11
30 Attend college, bachelor’s degree 35
32 Graduate or professional school or degree 23
0 No further (VOL) *
2 Other [Specify] (VOL) 5
6 Don’t know/Refused (VOL) 6
ASK IF <30 AND NO COLLEGE DEGREE AND NOT ENROLLED IN SCHOOL (AGE=18-29 AND EDUC=1-5 AND
SCHL=5,9) [n=347]:
Q.17 Which of the following is the MOST important reason why you are not currently in school
[READ AND RANDOMIZE]?
18-29
36 You can’t afford school right now
14 You don’t need more education right now
1 You couldn’t get into a school you wanted to attend
35 You don’t have time to be in school right now
12 Other [SPECIFY] (VOL)
1 Don’t know/Refused (VOL)](https://image.slidesharecdn.com/millennials-confident-connected-open-to-change-100302155840-phpapp02/85/Millennials-Confident-Connected-Open-To-Change-129-320.jpg)
![Appendix 2: Topline Questionnaire 123
ASK ALL:
On a different subject…
Q.18 Please tell me if you think each of the following trends is generally a good thing for our society, a bad thing for our
society, or doesn’t make much difference? (First/Next) [INSERT ITEM; RANDOMIZE] [READ IF NECESSARY:
Is this generally a good thing for our society, a bad thing for our society, or doesn’t it make much difference?]
a. More single women deciding to have children without a male partner to help raise them
Good thing Bad thing for Doesn’t make DK/Ref
for society society much difference (VOL)
Total 6 62 30 3
18-29 6 59 34 1
30-45 8 54 33 4
46-64 5 65 28 2
65+ 3 72 21 4
Trends:
Total
Jan 2010 6 62 30 3
Feb 2007 6 66 25 3
18-29
Jan 2010 6 59 34 1
Feb 2007 7 65 24 4
b. More gay and lesbian couples raising children
Good thing Bad thing for Doesn’t make DK/Ref
for society society much difference (VOL)
Total 13 42 40 4
18-29 19 32 46 2
30-45 17 36 42 4
46-64 9 48 40 3
65+ 8 55 31 7
Trends:
Total
Jan 2010 13 42 40 4
Feb 2007 11 50 34 5
18-29
Jan 2010 19 32 46 2
Feb 2007 17 47 35 1](https://image.slidesharecdn.com/millennials-confident-connected-open-to-change-100302155840-phpapp02/85/Millennials-Confident-Connected-Open-To-Change-130-320.jpg)
![Appendix 2: Topline Questionnaire 125
ASK ALL INTERNET USERS (INT1=1 OR INT2=1):
On another subject…
Q.19 Have you ever created your own profile on any social networking site like MySpace, Facebook or LinkedIn, or haven’t
you done this?
BASED ON TOTAL:
Total 18-29 30-45 46-64 65+
41 75 50 30 6 Yes
35 16 37 49 34 No
23 10 13 21 60 Not an internet user
* 0 0 * 0 Don’t know/Refused (VOL)
ASK IF HAS SNS PROFILE (Q.19=1): [n=1,027]
Q.20 How often do you visit the social networking site you use most often… several times a day, about once a day, every
few days, once a week or less often?
Total 18-29 30-45 46-64
21 29 19 11 Several times a day
23 26 19 26 About once a day
23 20 24 25 Every few days
16 10 19 19 Once a week
18 15 20 19 Less often
* * 0 0 Don’t know/Refused (VOL)
(n=655) (n=189) (n=152)
ASK ALL INTERNET USERS (INT1=1 OR INT2=1):
Q.21 Do you ever use Twitter, or haven’t you done this?
BASED ON TOTAL:
Total 18-29 30-45 46-64 65+
8 14 10 6 1 Yes
69 77 77 73 40 No
23 10 13 21 60 Not an internet user
* 0 0 0 0 Don’t know/Refused (VOL)
ASK ALL INTERNET USERS (INT1=1 OR INT2=1):
Q.22 When you are away from home or work, do you ever connect to the internet wirelessly using a laptop or handheld
device, or not?
BASED ON TOTAL:
Total 18-29 30-45 46-64 65+
41 62 48 35 11 Yes
36 28 38 44 29 No
23 10 13 21 60 Not an internet user
* * 0 0 0 Don’t know/Refused (VOL)](https://image.slidesharecdn.com/millennials-confident-connected-open-to-change-100302155840-phpapp02/85/Millennials-Confident-Connected-Open-To-Change-132-320.jpg)
![Appendix 2: Topline Questionnaire 126
ASK ALL:
Q.23 I’m going to read some statements about technology such as the internet and cell phones. As I read each pair, please
tell me which comes closer to your own views, even if neither is exactly right. The (first/next) pair is [INSERT
ITEM; RANDOMIZE ITEMS a. THRU c. AND RANDOMIZE STATEMENTS WITHIN ITEMS] [REPEAT
AS NECESSARY “which statement come closer to your own views, even if neither is exactly right?”]
a. New technology makes people closer to their friends and family [OR]
New technology makes people more isolated
Total 18-29 30-45 46-64 65+
50 54 52 48 44 New technology makes people closer to their friends and family
39 35 36 42 44 New technology makes people more isolated
2 1 2 2 3 Neither equally (VOL)
7 9 8 7 4 Both equally (VOL)
2 1 2 1 5 Don’t know/Refused (VOL)
b. New technology makes people waste too much time [OR]
New technology allows people to use their time more efficiently
Total 18-29 30-45 46-64 65+
35 33 34 35 41 New technology makes people waste too much time
52 56 52 54 41 New technology allows people to use their time more efficiently
3 1 2 2 7 Neither equally (VOL)
8 9 10 8 5 Both equally (VOL)
2 1 1 2 5 Don’t know/Refused (VOL)
c. New technology makes life easier [OR]
New technology makes life more complicated
Total 18-29 30-45 46-64 65+
64 74 69 60 50 New technology makes life easier
26 18 21 30 36 New technology makes life more complicated
2 1 1 2 4 Neither equally (VOL)
8 7 9 8 7 Both equally (VOL)
1 * 0 1 4 Don’t know/Refused (VOL)
ASK ALL CELL PHONE USERS (L1=1 OR CELL PHONE SAMPLE):
Q.24 Do you ever use your cell phone to send or receive text messages, or not?
BASED ON TOTAL:
Total 18-29 30-45 46-64 65+
59 88 77 51 9 Yes
26 6 13 37 53 No
14 6 10 11 38 Not a cell phone user
* * 0 0 0 Don’t know/Refused (VOL)](https://image.slidesharecdn.com/millennials-confident-connected-open-to-change-100302155840-phpapp02/85/Millennials-Confident-Connected-Open-To-Change-133-320.jpg)
![Appendix 2: Topline Questionnaire 127
ASK IF SENDS/RECEIVES TEXT MESSAGES (Q.24=1):
Q.25 Thinking about the past 24 hours, about how many text messages did you send and receive on your cell phone?
ASK IF DON’T KNOW/REFUSED HOW MANY (Q.25=999):
Q.25a Well, in the past 24 hours, did you send or receive [READ]
BASED ON TOTAL:
Total 18-29 30-45 46-64
12 8 14 17 No text messages in past 24 hours
24 29 31 26 1-10 text messages
8 12 12 4 11-20
8 16 11 3 21-50
5 13 6 2 51-100
2 6 1 * 101-200
1 5 1 0 More than 200 text messages
14 6 10 11 Not a cell phone user
26 7 13 37 Cell phone user but does not text
* * 0 0 Don’t know/Refused (VOL)
Median (among cell phone users who texted in the past 24 hours)
10 20 12 5
ASK ALL:
Q.26 [IF USES CELL PHONE TO TEXT (Q.24=1)]: Still thinking about the past 24 HOURS, did you [INSERT FIRST
ITEM; RANDOMIZE] or not? In the past 24 hours, did you [INSERT NEXT ITEM], or not?
[IF NO CELL PHONE (L1=2,9) OR DOESN’T USE CELL PHONE TO TEXT (Q.24=2,9)]: Thinking about the
past 24 HOURS, did you [INSERT FIRST ITEM; RANDOMIZE] or not? In the past 24 hours, did you [INSERT
NEXT ITEM], or not?
ASK ITEMS a, b AND c ONLY OF INTERNET USERS (INT1=1 OR INT2=1):
a. Post a message to someone’s personal online profile
BASED ON TOTAL:
Sep 2006
Total 18-29 30-45 46-64 65+ Total 18-29
17 32 22 9 3 Yes 9 20
60 58 65 69 37 No 66 69
23 10 13 21 60 Not an internet user 25 11
* 0 0 0 0 Don’t know/Refused (VOL) * 0
b. Send or receive an email message
BASED ON TOTAL:
Sep 2006
Total 18-29 30-45 46-64 65+ Total 18-29
51 56 57 54 26 Yes 49 50
26 34 29 24 14 No 26 38
23 10 13 21 60 Not an internet user 25 11
* * * * * Don’t know/Refused (VOL) * 0](https://image.slidesharecdn.com/millennials-confident-connected-open-to-change-100302155840-phpapp02/85/Millennials-Confident-Connected-Open-To-Change-134-320.jpg)
![Appendix 2: Topline Questionnaire 129
ASK ALL:
On another subject…
EMPLOY Are you now employed full-time, part-time or not employed?
ASK IF NOT EMPLOYED (EMPLOY=3):
EMPLOY2 Is that because you are a student, because you are retired, because you choose not to work, or because you’ve
lost or quit a job?
Total 18-29 30-45 46-64 65+
60 64 75 68 16 Employed
46 41 65 54 7 Full-time
14 24 10 14 9 Part-time
40 35 25 32 84 Not employed
3 13 1 * 0 Student
17 * 1 13 75 Retired
4 4 7 3 1 Choose not to work
7 10 7 8 1 Lost or quit a job
8 8 8 8 6 Other reason [Specify] (VOL)
* 0 1 * 0 Don't know/Refused (VOL)
* * 0 0 0 Don't know/Refused (VOL)
ASK IF EMPLOYED (EMPLOY=1,2) [n=1,239]:
EMPLOY3 Are you self-employed, do you work for someone else, or do you do both?
Total 18-29 30-45 46-64
13 6 12 18 Self-employed/own a business
76 82 78 71 Work for someone else
10 12 10 10 Both
* * * 0 Don’t know/Refused (VOL)
(n=554) (n=266) (n=346)
ASK IF EMPLOYED (EMPLOY=1,2) [n=1,239]:
Q.31 Do you think of your current job as a career, a stepping stone to a career, or do you think of it as just a job to get you
by?
Total 18-29 30-45 46-64
51 28 53 64 A career
18 33 24 5 A stepping stone to a career
29 38 22 28 Just a job to get you by
2 * 1 2 Don’t know/Refused (VOL)
Trend for comparison:
Public Agenda
Aug 200536
18-25 18-25
18 A career 18
36 A stepping stone to a career 36
45 Just a job to get you by 46
0 Don’t know/Refused (VOL) 0
36
National random sample of 1,000 young adults ages 18-25, conducted August 14-September 4, 2004.](https://image.slidesharecdn.com/millennials-confident-connected-open-to-change-100302155840-phpapp02/85/Millennials-Confident-Connected-Open-To-Change-136-320.jpg)
![Appendix 2: Topline Questionnaire 130
ASK IF EMPLOYED (EMPLOY=1,2) [n=1,239]:
Q.32 Do you now earn enough money to lead the kind of life you want, or not?
ASK IF NO (Q.32=2):
Q.33 Do you think you will be able to earn enough money in the future to lead the kind of life you want, or not?
No Yes, will No, will not DK/Ref DK/Ref
Yes (NET) in future in future (VOL ) (VOL)
Total 45 55 37 16 2 1
18-29 31 68 60 7 1 1
30-45 46 54 40 12 1 0
46-64 52 47 22 23 3 1
Trends (selected years):
Total
Jan 2010 45 55 37 16 2 1
Sep 2006 49 50 33 15 2 1
Nov 1997 41 59 33 24 2 *
18-29
Jan 2010 31 68 60 7 1 1
Sep 2006 32 67 62 5 * 1
Nov 1997 30 69 53 16 0 1
ASK IF NOT EMPLOYED OR DK/REF (EMPLOY=3,9) [n=781]:
Q.34 Do you now have enough income to lead the kind of life you want, or not?
ASK IF NO (Q.34=2):
Q.35 Do you think you will have enough income in the future to lead the kind of life you want, or not?
No Yes, will No, will not DK/Ref DK/Ref
Yes (NET) in future in future (VOL ) (VOL)
Total 42 57 31 22 4 1
18-29 (n=276) 19 79 70 8 1 2
46-64 (n=141) 29 70 33 35 3 1
65+ (n=264) 65 34 4 24 6 *
Trend (selected years):
Total
Jan 2010 42 57 31 22 4 1
Sep 2006 53 44 22 18 4 2
18-29
Jan 2010 19 79 70 8 1 2
Sep 2006 38 60 52 6 2 2](https://image.slidesharecdn.com/millennials-confident-connected-open-to-change-100302155840-phpapp02/85/Millennials-Confident-Connected-Open-To-Change-137-320.jpg)
![Appendix 2: Topline Questionnaire 131
ASK ALL:
Q.36 How closely do you watch the amount of money you spend [READ]?
Oct 2006
Total 18-29 30-45 46-64 65+ Total 18-29
57 55 59 57 57 Very closely 46 43
31 30 27 34 33 Fairly closely 41 41
8 11 8 7 6 Not too closely 8 11
3 3 4 1 2 Not at all closely 3 5
1 * 1 1 2 Don’t know/Refused (VOL) 1 *
ASK IF EMPLOYED (EMPLOY=1,2) [n=1,239]:
Q.37 Have you ever switched careers—that is, switched from one TYPE of work to another TYPE of work?
Total 18-29 30-45 46-64
61 58 63 61 Yes
39 42 36 38 No
* * * * Don’t know/Refused (VOL)
(n=554 ) (n=266 ) (n=346)
Trends:
DK/Ref
Yes No (VOL)
Total
Jan 2010 61 39 *
Jun 2006 61 38 1
PSRAI Jul 1997 63 37 0
USAToday April 1987 52 48 0
USAToday Dec 1986 54 47 0
18-29
Jan 2010 58 42 *
Jun 2006 61 38 1
PSRAI Jul 1997 57 43 0
ASK IF EMPLOYED (EMPLOY=1,2) [n=1,239]:
Q.38 How likely is it that you will switch careers (IF SWITCHED Q.37=1: again) sometime during your working life?
[READ]
Total 18-29 30-45 46-64
24 39 28 14 Very likely
23 27 28 17 Somewhat likely
23 20 21 27 Not very likely
29 13 22 41 Not at all likely
1 1 1 1 Don’t know/Refused (VOL)
(n=554) (n=266) (n=346)](https://image.slidesharecdn.com/millennials-confident-connected-open-to-change-100302155840-phpapp02/85/Millennials-Confident-Connected-Open-To-Change-138-320.jpg)
![Appendix 2: Topline Questionnaire 132
Trends:
Very Somewhat Not very Not at all DK/Ref.
likely likely likely likely (VOL)
Total
Jan 2010 24 23 23 29 1
Jun 2006 28 19 25 27 1
PSRAI Jul 199737 29 21 25 24 1
USAToday April 1987 23 20 24 32 1
18-29
Jan 2010 39 27 20 13 1
Jun 2006 50 21 17 11 *
PSRAI Jul 1997 50 24 13 12 *
ASK IF EMPLOYED (EMPLOY=1,2) [n=1,239]
Q.39 [IF NOT SELF-EMPLOYED (EMPLOY3>1)]: How likely is it that you will stay with your present employer for the
remainder of your working life? Is it… [READ]
[IF SELF-EMPLOYED (EMPLOY3=1)]: How likely is it you will stay self-employed for the remainder of your
working life? Is it…[READ]
Total 18-29 30-45 46-64
40 16 32 60 Very likely
26 26 30 23 Somewhat likely
16 21 21 8 Not very likely
16 36 15 6 Not at all likely
2 1 2 2 Don’t know/Refused (VOL)
(n=554) (n=266) (n=346)
Trends:
Very Somewhat Not very Not at all DK/Ref
likely likely likely likely (VOL)
Total
Jan 2010 40 26 16 16 2
Jun 2006 42 27 13 17 1
PSRAI Jul 199738 41 24 18 17 *
USAToday April 1987 44 20 20 15 1
USA Today Dec 1986 45 19 13 23 1
18-29
Jan 2010 16 26 21 36 1
Jun 2006 21 26 16 37 0
PSRAI Jul 1997 15 24 24 36 *
ASK ALL:
Q.40 Which of these do you think has the most influence over how you live your life these days [READ AND
RANDOMIZE]?
Total 18-29 30-45 46-64 65+
42 40 39 42 48 The government [OR]
35 42 41 35 18 Business corporations
10 10 7 10 12 Both (VOL)
13 8 13 13 22 Don’t know/Refused (VOL)
37
The response category for the PSRAI and USA Today trends from 1997 and 1987 was “Not likely at all”.
38
The response category for the PSRAI and USA Today trends from 1997 and 1987 was “Not likely at all”.](https://image.slidesharecdn.com/millennials-confident-connected-open-to-change-100302155840-phpapp02/85/Millennials-Confident-Connected-Open-To-Change-139-320.jpg)
![Appendix 2: Topline Questionnaire 133
ASK ALL:
Q.41 Do you strongly favor, favor, oppose, or strongly oppose allowing gay and lesbian couples to marry legally?
Total 18-29 30-45 46-64 65+
14 21 17 10 6 Strongly favor
24 29 27 22 18 Favor
23 18 19 26 34 Oppose
28 19 27 32 32 Strongly oppose
11 14 11 10 10 Don’t know/Refused (VOL)
Trends:
Strongly Strongly DK/Ref
favor Favor Oppose oppose (VOL)
Total
Jan 2010 14 24 23 28 11
July 2006 12 23 25 31 9
June 1996 6 21 24 41 8
18-29
Jan 2010 21 29 18 19 14
July 2006 21 32 18 20 9
June 1996 8 33 21 31 6
ASK ALL:
Q.42 On the whole, would you say you are saving and investing as much money as you should, or do you feel you should
probably be saving and investing more?
Oct 2006
Total 18-29 30-45 46-64 65+ Total 18-29
26 22 18 26 44 Saving and investing as much as you should 32 26
69 77 78 71 40 Should be saving and investing more 63 72
5 1 3 3 16 Don’t know/Refused (VOL) 5 2
ASK ALL:
Q.43 Have you ever spent time participating in any community service or volunteer activity, or haven’t you had time to do
this? By volunteer activity, I mean actually working in some way to help others for no pay. [IF YES: Have you done
this in the last 12 months?]
Total 18-29 30-45 46-64 65+
52 57 54 52 39 Yes have done it in last 12 months
21 18 18 21 30 Yes, but have not done it in last 12 months (or unsure if done
in last 12 months)
27 25 28 26 30 No, have not ever done it
* * 0 * 1 Don’t know/Refused (VOL)](https://image.slidesharecdn.com/millennials-confident-connected-open-to-change-100302155840-phpapp02/85/Millennials-Confident-Connected-Open-To-Change-140-320.jpg)
![Appendix 2: Topline Questionnaire 134
Q.43 CONTINUED…
Trend for comparison:
Circle
April 200639
18-29 18-29
57 Yes have done it in last 12 months 31
18 Yes, but have not done it in last 12 months (or 29
unsure if done in last 12 months)
25 No, have not ever done it 40
* Don’t know/Refused (VOL) *
ASK ALL:
Q.44 And just a few questions about you. For each item, please just answer yes or no. First, [INSERT ITEM;
RANDOMIZE ITEMS a THRU f; WITH ITEMS g,h, and i LAST AND IN ORDER]
a. Do you recycle paper, plastic or glass from home?
Total 18-29 30-45 46-64 65+
74 69 77 72 77 Yes
25 30 22 27 22 No
* 1 * * 1 Don’t know/Refused (VOL)
b. Do you have a close friend or family member who is gay?
Total 18-29 30-45 46-64 65+
43 54 46 44 26 Yes
56 46 53 55 73 No
* 1 * 1 1 Don’t know/Refused (VOL)
c. Do you happen to have any guns, rifles or pistols in your home?
Total 18-29 30-45 46-64 65+
34 28 31 42 32 Yes
63 71 66 56 63 No
3 * 2 2 6 Don’t know/Refused (VOL)
ASK ITEM d. IF R USES INTERNET (INT1=1 OR INT2=1)
d. Have you ever posted a video of yourself online?
BASED ON TOTAL:
Total 18-29 30-45 46-64 65+
7 20 6 2 1 Yes
70 71 80 77 40 No
23 10 13 21 60 Not an internet user
* 0 0 0 0 Don’t know/Refused (VOL)
39
Survey by the Center for Information and Research on Civic Leaning & Engagement, April 27-June11, 2006, based on telephone and online
interviews with a national sample of ages 15 and older. The over sample of 467 African-Americans, Latinos and Asian-Americans age 15-25
were completed online.](https://image.slidesharecdn.com/millennials-confident-connected-open-to-change-100302155840-phpapp02/85/Millennials-Confident-Connected-Open-To-Change-141-320.jpg)

![Appendix 2: Topline Questionnaire 136
ASK ALL:
Q.45 Do you have [INSERT ITEM; RANDOMIZE]:
a. A tattoo
Total 18-29 30-45 46-64 65+
23 38 32 15 6 Yes
77 62 68 85 94 No
* * * 0 0 Don’t know/Refused (VOL)
Trend for comparison:
Sep 200640
Total 18-29
24 41 Yes
76 59 No
0 0 Don’t know/Refused (VOL)
b. A piercing in a place other than your earlobe
Total 18-29 30-45 46-64 65+
8 23 9 1 * Yes
92 77 91 99 100 No
* * * 0 0 Don’t know/Refused (VOL)
Trend for comparison:
Sep 200641
Total 18-29
15 33 Yes
85 67 No
0 0 Don’t know/Refused (VOL)
ASK IF HAVE A TATTOO (Q.45a=1):
Q.46 How many tattoos do you have? ENTER NUMBER (RANGE 1-50)
BASED ON TOTAL:
Total 18-29 30-45 46-64 65+
77 62 68 85 94 None
10 12 12 9 3 1
8 13 10 5 2 2-3
3 6 6 * 1 4-5
2 5 4 * 0 6-10
1 2 1 0 0 11+
* * * * 0 Don’t know/Refused (VOL)
40
The 2006 survey only asked this question of 18-64 year olds. The question wording was “Do you have, or have you ever had…?”
41
The 2006 survey only asked this question of 18-64 year olds. The question wording was “Do you have, or have you ever had…?”](https://image.slidesharecdn.com/millennials-confident-connected-open-to-change-100302155840-phpapp02/85/Millennials-Confident-Connected-Open-To-Change-143-320.jpg)
![Appendix 2: Topline Questionnaire 137
ASK IF ONE OR MORE TATTOOS (Q.45a=1) [n=492]:
Q.47 (IF Q.46=1) Is your tattoo usually visible or not? (IF Q.46>1:) Are your tattoos usually visible or not?
Total 18-29 30-45
18 21 14 Yes, visible
72 70 74 No, not visible
8 6 11 Depends on what I’m wearing (VOL)
1 4 0 Some visible, some not (VOL)
1 0 1 Don’t know/Refused (VOL)
(n=295) (n=112)
ASK ALL:
Q.48 Have you ever had a tattoo removed?
Total 18-29 30-45 46-64 65+
1 1 1 1 0 Yes
99 98 99 99 100 No
* * * 0 0 Don’t know/Refused (VOL)
ASK ALL:
MARITAL
Are you currently married, living with a partner, divorced, separated, widowed, or have you never been married? [IF
R SAYS “SINGLE,” PROBE TO DETERMINE WHICH CATEGORY IS APPROPRIATE]
Total 18-29 30-45 46-64 65+
51 23 59 64 48 Married
8 17 10 4 2 Living with a partner
9 2 8 16 8 Divorced
3 1 5 2 1 Separated
8 * 1 7 34 Widowed
20 55 17 7 6 Never been married
1 1 * * * Don’t know/Refused (VOL)
ASK ALL NOT LIVING WITH PARTNER (MARITAL=1,3,4,5,6,9) [n=1,847]:
LWP2 Have you ever lived together with a partner without being married, or not?
Total 18-29 30-45 46-64 65+
45 44 61 48 18 Yes
54 55 39 52 82 No
* * * * * Don’t know/Refused (VOL)
(n=709) (n=322) (n=469) (n=314)
ASK IF YES TO LWP2 AND MARRIED (LWP2=1 & MARITAL=1) [n=388]:
LWP3 Did you live with your current spouse before you got married, did you live with someone else, or have you done both?
Total 18-29 30-45 46-64
72 72 73 70 Lived with current spouse before married
6 4 7 5 Lived with someone else
21 23 20 24 Lived with both current spouse and someone else
1 1 0 1 Don’t know/Refused (VOL)
(n=109) (n=127) (124)](https://image.slidesharecdn.com/millennials-confident-connected-open-to-change-100302155840-phpapp02/85/Millennials-Confident-Connected-Open-To-Change-144-320.jpg)
![Appendix 2: Topline Questionnaire 138
ASK ALL:
KIDSA Do you have any children under the age of 18?
Total 18-29 30-45 46-64 65+
34 34 69 19 2 Yes
66 65 30 81 98 No
* * * * * Don’t know/Refused (VOL)
ASK ALL:
FAM1 During the time you were growing up, who did you live with MOST of the time? Did you live with … [READ]
Total 18-29 30-45 46-64 65+
73 61 68 80 80 Both parents
19 27 23 14 12 Only your mother
3 4 2 2 2 Only your father
6 7 7 4 6 Neither parent
* 1 * * * Don’t know/Refused (VOL)
ASK ALL:
FAM2 What was the marital status of your parents during most of the time you were growing up – were they married,
divorced, separated, widowed or never married to each other?
Total 18-29 30-45 46-64 65+
76 62 71 85 87 Married
12 19 14 8 5 Divorced
3 5 5 2 1 Separated
2 2 2 2 4 Widowed
5 11 7 2 1 Never married
1 1 * 1 2 Don’t know/Refused (VOL)
ASK ALL:
RELIG What is your present religion, if any? Are you Protestant, Roman Catholic, Mormon, Orthodox such as Greek or
Russian Orthodox, Jewish, Muslim, Buddhist, Hindu, atheist, agnostic, something else, or nothing in particular?
[INTERVIEWER: IF R VOLUNTEERS “nothing in particular, none, no religion, etc.” BEFORE
REACHING END OF LIST, PROMPT WITH: And would you say that’s atheist, agnostic, or just nothing
in particular?]
ASK IF SOMETHING ELSE OR DK/REF (RELIG=11, 99):
CHR Do you think of yourself as a Christian or not?
Total 18-29 30-45 46-64 65+
51 44 48 53 60 Protestant
23 20 22 25 24 Catholic
16 24 20 13 6 Unaffiliated
8 8 8 7 9 Other
2 3 2 2 1 Don't know/Refused (VOL)
ASK ALL:
ATTEND Aside from weddings and funerals, how often do you attend religious services... more than once a week,
once a week, once or twice a month, a few times a year, seldom, or never?
Total 18-29 30-45 46-64 65+
12 7 11 15 14 More than once a week
24 20 23 26 31 Once a week
13 14 17 12 11 Once or twice a month
18 21 17 17 19 A few times a year
18 20 19 17 15 Seldom
13 17 12 12 10 Never
1 1 1 1 1 Don't know/Refused (VOL)](https://image.slidesharecdn.com/millennials-confident-connected-open-to-change-100302155840-phpapp02/85/Millennials-Confident-Connected-Open-To-Change-145-320.jpg)
![Appendix 2: Topline Questionnaire 139
ASK ALL:
INCOME Last year, that is in 2009, what was your total family income from all sources, before taxes? Just stop me
when I get to the right category. [READ]
Total 18-29 30-45 46-64 65+
19 24 18 12 26 Less than $20,000
12 15 14 9 13 $20,000 to under $30,000
17 19 14 19 18 $30,000 to under $50,000
14 13 13 19 8 $50,000 to under $75,000
11 8 14 13 4 $75,000 to under $100,000
13 9 18 16 6 $100,000+
14 13 10 11 24 Don’t know/Refused (VOL)
ASK IF AGE <40: [n=1,026]
FINAN Do you depend on your parents or other family members for financial assistance, or not?
Total 18-29 30-39
23 36 6 Yes
76 63 94 No
1 1 * Don’t know/Refused (VOL)
(n=830) (n=196)
ASK ALL:
HEALTH
Are you, yourself, now covered by any form of health insurance or health plan or are you not covered at this time?
[READ IF NECESSARY: A health plan would include any private insurance plan through your employer or a plan that
you purchased yourself, as well as a government program like Medicare or Medicaid]
Total 18-29 30-45 46-64 65+
77 61 73 83 95 Covered by health insurance
22 37 26 17 3 Not covered by health insurance
1 2 * 0 2 Don’t know/Refused (VOL)
ASK ALL:
REGIST These days, many people are so busy they can't find time to register to vote, or move around so often they don't get a
chance to re-register. Are you NOW registered to vote in your precinct or election district or haven't you been able
to register so far?
ASK IF RESPONDENT ANSWERED '1' YES IN REGIST:
REGICERT Are you absolutely certain that you are registered to vote, or is there a chance that
your registration has lapsed because you moved or for some other reason?
Total 18-29 30-45 46-64 65+
78 66 73 85 88 Yes, registered
75 62 70 84 87 Absolutely certain
2 4 3 1 * Chance registration has lapsed
* 1 * * 0 Don't know/Refused (VOL)
21 31 27 14 11 No, not registered
1 2 * * 2 Don't know/Refused (VOL)](https://image.slidesharecdn.com/millennials-confident-connected-open-to-change-100302155840-phpapp02/85/Millennials-Confident-Connected-Open-To-Change-146-320.jpg)
![Appendix 2: Topline Questionnaire 140
ASK ALL:
PARTY In politics TODAY, do you consider yourself a Republican, Democrat, or Independent?
IF ANSWERED 3, 4, 5 OR 9 IN PARTY, ASK:
PARTYLN As of today do you lean more to the Republican Party or more to the Democratic Party?
BASED ON TOTAL:
Total 18-29 30-45 46-64 65+
24 20 22 28 25 Republican
33 33 33 32 38 Democrat
31 35 31 32 25 Independent
7 7 10 4 4 No preference (VOL)
1 * 1 0 1 Other party (VOL)
4 4 4 4 6 Don't know/Refused (VOL)
13 12 12 13 15 Lean Republican
12 16 17 10 4 Lean Democrat
18 19 17 17 18 Refused to lean (VOL)
ASK ALL:
IDEO In general, would you describe your political views as... [READ]
Total 18-29 30-45 46-64 65+
8 6 7 8 11 Very conservative
32 23 31 36 39 Conservative
32 32 33 33 29 Moderate
15 21 16 12 9 Liberal, OR
6 8 9 5 3 Very liberal
7 10 6 5 9 Don't know/Refused (VOL)
ASK IF AGE >29: [n=1,157]
HOME Do you own or rent your home?
30+
71 Own
25 Rent
3 Other arrangement
1 Don't know/Refused (VOL)
ASK IF AGE < 30: [n=830]
HOME2 Do you own your home, rent, live in a dorm or live with your parents?
22 Own
42 Rent
4 Live in a dorm
29 Live with parents
2 Other arrangement
2 Don't know/Refused (VOL)
HOME/HOME2
Total 18-29 30-45 46-64 65+
60 22 61 79 73 Own
28 42 35 18 19 Rent
10 35 3 2 5 Other
1 2 * * 2 Don't know/Refused (VOL)](https://image.slidesharecdn.com/millennials-confident-connected-open-to-change-100302155840-phpapp02/85/Millennials-Confident-Connected-Open-To-Change-147-320.jpg)


The document provides an overview of key findings about Millennials (ages 18-29) from a Pew Research Center report: 1) Millennials are more diverse, less religious, and on track to become the most educated generation. 2) They are deeply connected to technology and social media but also place privacy boundaries. Nearly two-thirds admit to texting while driving. 3) Most Millennials believe they will meet long-term financial goals despite struggling in a weak economy, with 37% unemployed or out of the workforce currently. 4) They are less overtly religious than older generations but pray about as often. Only about six-in-ten were raised by both parents


