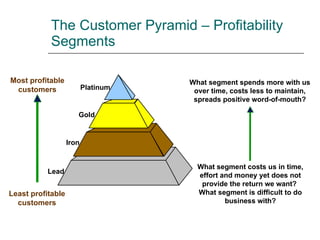
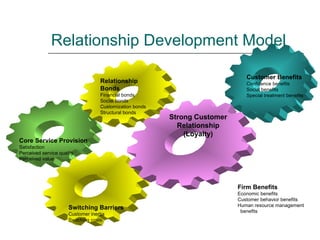
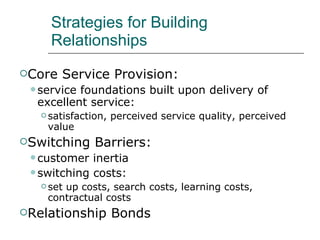
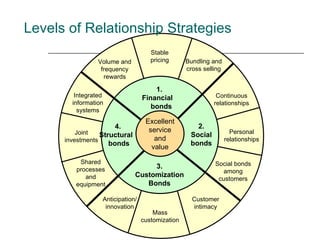
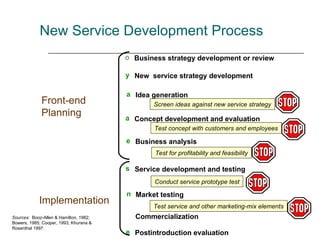
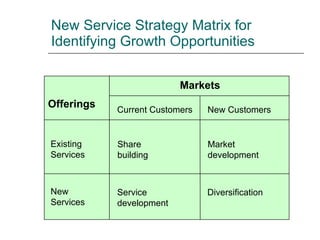
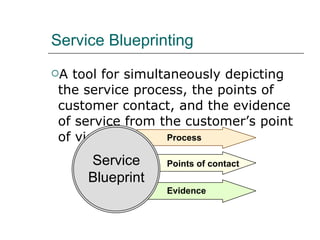
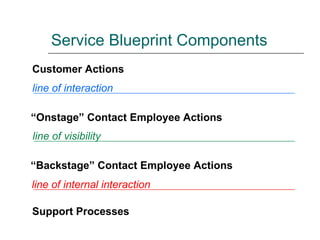
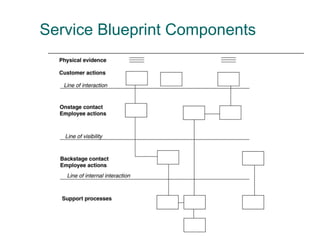
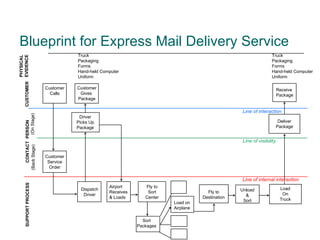
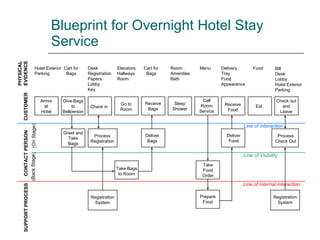
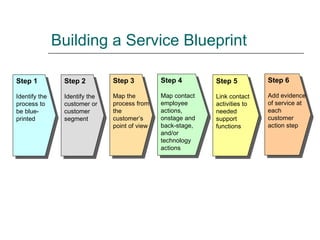
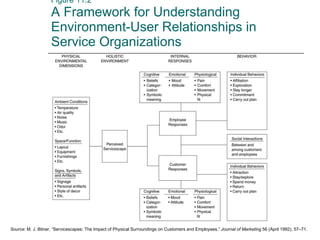
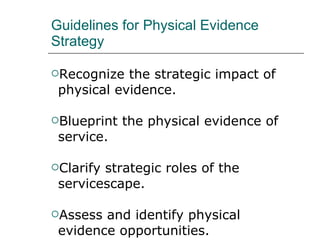
BM404 Lecture 5
Portfolio of Services Research Customer Complaint Solicitation/ CIStudies “ Relationship”/SERVQUAL Surveys  Post-Transaction Surveys  Customer Focus Groups  “ Mystery Shopping” of  Service Providers  Employee Surveys  Identify dissatisfied customers to attempt recovery; identify most common categories of service failure for remedial action Obtain customer feedback while service experience is fresh; act on feedback quickly if negative patterns develop Use as input for quantitative surveys; provide a forum for customers to suggest service-improvement ideas Assess company’s service performance compared to competitors; identify service-improvement priorities; track service improvement over time Measure individual employee service behaviors for use in coaching, training, performance evaluation, recognition and rewards; identify systemic strengths and weaknesses in service Measure internal service quality; identify employee-perceived obstacles to improve service; track employee morale and attitudes Determine the reasons why customers defect Research Objective Type of Research Lost Customer Research Future Expectations Research Forecast future expectations of customers; develop and test new service ideas
Tracking of Customer Expectations and Perceptions of Service Reliability Source : E. Sivadas, “Europeans Have a Different Take on CS [Customer Satisfaction] Programs,”  Marketing News , October 26, 1998, p. 39.
Service Quality Perceptions  Relative to Zones of Tolerance Retail Chain 9 8 7 6 5 4 3 2 1 0 Reliability  Responsiveness  Assurance  Empathy  Tangibles O O = Zone of Tolerance  = Service Quality Perception O O O O
Importance/Performance Matrix HIGH HIGH LOW Performance Importance           Attributes to Improve Attributes to Maintain High Leverage Attributes to De-emphasize Attributes to Maintain Low Leverage Low Leverage
Upward communication Executive visits to customers Executive/management listening to customers Research on intermediate customers Research on internal customers Executive/management listening to employees Employee suggestion
Building  customer relationships
Relationship Marketing Customer relationships Strangers Acquaintances Friends  Partners
Customer Goals of Relationship Marketing
Relationship marketing Benefits for customers Benefits for firms
Lifetime Value of an Average Business Customer at Telecheck International
The Customer Pyramid – Profitability Segments Most profitable customers Least profitable customers What segment spends more with us over time, costs less to maintain, spreads positive word-of-mouth? What segment costs us in time, effort and money yet does not provide the return we want?  What segment is difficult to do business with? Gold Iron Lead Platinum
Relationship Development Model Customer Benefits Confidence benefits Social benefits Special treatment benefits Relationship Bonds Financial bonds Social bonds Customization bonds Structural bonds Switching Barriers Customer inertia Switching costs Core Service Provision Satisfaction Perceived service quality Perceived value Strong Customer Relationship (Loyalty) Firm Benefits Economic benefits Customer behavior benefits Human resource management benefits
Strategies for Building Relationships Core Service Provision: service foundations built upon delivery of excellent service: satisfaction, perceived service quality, perceived value Switching Barriers: customer inertia switching costs: set up costs, search costs, learning costs, contractual costs Relationship Bonds
  Levels of Relationship Strategies Excellent service and value 1. Financial  bonds 2. Social bonds 4.  Structural  bonds 3. Customization Bonds Volume and frequency rewards Bundling and cross selling Stable pricing Social bonds among customers Personal relationships Continuous relationships Customer intimacy Mass customization Anticipation/ innovation Shared processes and equipment Joint investments Integrated information systems
Service recovery
Unhappy Customers’ Repurchase Intentions 82% 54% 19% 9% Complaints Resolved Quickly Complaints Resolved Complaints Not Resolved Unhappy Customers Who  Don’t  Complain Unhappy Customers Who  Do  Complain Percent of customers who will buy again after a major complaint (over $100 in losses) Source:  Adapted from data reported by the Technical Assistance Research Program.
Customer Complaint Actions Following Service Failure
Satisfaction consequences  McColl-Kennedy (2003)
Satisfaction consequences (cont.)  McColl-Kennedy (2003)
Types of complainers Passives Voicers Irates Activists Singh ‘ A typology of customer complaint styles’
Causes Behind Service Switching Service Switching Behavior High price Price increases Unfair pricing Deceptive pricing Pricing Location/hours Wait for appointment Wait for service Inconvenience Service mistakes Billing errors Service catastrophe Core Service Failure Uncaring Impolite Unresponsive Unknowledgeable Service Encounter Failures Negative response No response Reluctant response Response to Service Failure Found better service Competition Cheat Hard sell Unsafe Conflict of interest Ethical Problems Customer moved Provider closed Involuntary Switching Source : Sue Keaveney, “Customer Switching Behavior in Service Industries: An Exploratory Study,”  Journal of Marketing , April, 1995, pp. 71-82.
Service Recovery Strategies Treat Customers Fairly Learn from Recovery  Experiences Act Quickly Fail-safe the Service Cultivate Relationships with Customers Encourage and Track Complaints Provide Adequate Explanations Learn from Lost Customers Service Recovery Strategies
Service Guarantees in a business context, a guarantee is a pledge or assurance that a product offered by a firm will perform as promised and, if not, then some form of reparation will be undertaken by the firm for tangible products, a guarantee is often done in the form of a warranty services are often not guaranteed cannot return the service service experience is intangible (so what do you guarantee?)
Why a Good Guarantee Works forces company to focus on customers sets clear standards generates feedback forces company to understand why it failed builds “marketing muscle”
Characteristics of an Effective Service Guarantee Unconditional the guarantee should make its promise unconditionally – no strings attached Meaningful the firm should guarantee elements of the service that are important to the customer the payout should cover fully the customer’s dissatisfaction Easy to Understand and Communicate customers need to understand what to expect employees need to understand what to do Easy to Invoke and Collect the firm should eliminate hoops or red tape in the way of accessing or collecting on the guarantee Source : Christopher W.L. Hart, “The Power of Unconditional Guarantees,”  Harvard Business Review , July-August, 1988, pp. 54-62.
Service Guarantees Does everyone need a guarantee? Reasons companies might NOT want to offer a service guarantee: existing service quality is poor guarantee does not fit the company’s image too many uncontrollable external variables fears of cheating or abuse by customers costs of the guarantee outweigh the benefits customers perceive little risk in the service customers perceive little variability in service quality among competitors
Service Guarantees service guarantees work for companies who are already customer-focused effective guarantees can be BIG deals – they put the company at risk in the eyes of the customer customers should be involved in the design of service guarantees the guarantee should be so stunning that it comes as a surprise – a WOW!! factor “it’s the icing on the cake, not the cake”
Service  Development and Design
Risks of Relying on Words Alone to  Describe Services Oversimplification Incompleteness Subjectivity Biased Interpretation
Types of New Services major or radical innovations start-up businesses new services for the currently served market service line extensions service improvements style changes
New Service Development Process Sources :  Booz-Allen & Hamilton, 1982; Bowers, 1985; Cooper, 1993; Khurana & Rosenthal 1997. Business strategy development or review New  service strategy development Idea generation Concept development and evaluation Business analysis Service development and testing Postintroduction evaluation Commercialization Market testing Screen ideas against new service strategy Test concept with customers and employees Test for profitability and feasibility Conduct service prototype test Test service and other marketing-mix elements Front-end Planning Implementation
New Service Strategy Matrix for Identifying Growth Opportunities Markets Offerings Existing Services New Services  Current Customers New Customers Share building Diversification Market development Service development
Service Blueprinting A tool for simultaneously depicting the service process, the points of customer contact, and the evidence of service from the customer’s point of view. Service Blueprint Process Points of contact Evidence
Service Blueprint Components Customer Actions line of interaction “ Onstage” Contact Employee Actions line of visibility “ Backstage” Contact Employee Actions line of internal interaction Support Processes
Service Blueprint Components
Blueprint for Express Mail Delivery Service Driver Picks Up Package Dispatch Driver Airport Receives & Loads Sort Packages Load on Airplane Fly to Destination Unload & Sort Load On Truck SUPPORT PROCESS CONTACT  PERSON (Back Stage) (On Stage) CUSTOMER PHYSICAL EVIDENCE Customer Gives  Package Truck Packaging Forms Hand-held Computer Uniform Truck Packaging Forms Hand-held Computer Uniform Deliver Package Customer Service Order Fly to Sort Center Line of interaction Line of visibility Line of internal interaction Customer Calls Receive Package
Blueprint for Overnight Hotel Stay Service SUPPORT PROCESS CONTACT PERSON (Back Stage) (On Stage) CUSTOMER Hotel Exterior Parking Cart for Bags Desk Registration Papers Lobby Key Elevators Hallways Room Cart for Bags Room Amenities Bath Menu Delivery Tray Food Appearance Food Bill Desk Lobby Hotel Exterior Parking Arrive at Hotel Give Bags to Bellperson Check in Go to Room Receive Bags Sleep Shower Call Room Service Receive Food Eat Check out and Leave Greet and Take Bags Process Registration Deliver Bags Deliver Food Process Check Out Take Bags to Room Take Food Order Registration System Prepare Food PHYSICAL EVIDENCE Line of Interaction Line of Visibility Line of Internal Interaction Registration System
Building a Service Blueprint Step 1 Identify the process to be blue-printed Step 2 Identify the customer or customer segment Step 3 Map the process from the customer’s point of view Step 4 Map contact employee actions, onstage and back-stage, and/or technology actions Step 5 Link contact activities to needed support functions Step 6 Add evidence of service at each customer action step
Application of Service Blueprints New Service Development concept development market testing Supporting a “Zero Defects” Culture managing reliability identifying empowerment issues Service Recovery Strategies identifying service problems conducting root cause analysis modifying processes
Blueprints Can Be Used By: Service Marketers creating realistic customer expectations: service system design promotion Operations Management rendering the service as promised: managing fail points training systems quality control Human Resources Management empowering the human element: job descriptions selection criteria appraisal systems System Technology providing necessary tools: system specifications personal preference databases
Customer-Defined Service Standards Factors Necessary for Appropriate Service Standards Types of Customer-Defined Service Standards Development of Customer-Defined Service Standards 10 Chapter
Customer-Defined Service Standards Distinguish between company-defined and customer-defined service standards. Differentiate among one-time service fixes and “hard” and “soft” customer-defined standards. Explain the critical role of the service encounter sequence in developing customer-defined standards. Illustrate how to translate customer expectations into behaviors and actions that are definable, repeatable, and actionable. Explain the process of developing customer-defined service standards. Emphasize the importance of service performance indexes in implementing strategy for service delivery.
Examples of Hard Customer-Defined Standards
Examples of Soft Customer-Defined Standards
AT&T’s Process Map for Measurements Source : R. E. Kordupleski, R. T. Rust, and A. J. Zaharik, “Why Improving Quality Doesn’t Improve Quality (or Whatever Happened to Marketing?),”  California Management Review  35, no. 3 (Spring 1993).
AT&T’s Process Map for Measurements Reliability (40%) Easy To Use (20%) Features / Functions (40%) Knowledge (30%) Responsive (25%) Follow-Up (10%) Delivery Interval Meets Needs (30%) Does Not Break (25%) Installed When Promised (10%) No Repeat Trouble (30%) Fixed Fast (25%) Kept Informed (10%) Accuracy, No Surprise (45%) Resolve On First Call (35%) Easy To Understand (10%) Business Process Customer Need Internal Metric 30% Product 30% Sales 10% Installation 15% Repair 15% Billing % Repair Call % Calls for Help Functional Performance Test Supervisor Observations % Proposal Made on Time % Follow Up Made Average Order Interval % Repair Reports % Installed On Due Date % Repeat Reports Average Speed Of Repair % Customers Informed % Billing Inquiries % Resolved First Call % Billing Inquiries Total Quality Source: AT&T General Business Systems
Exercise for Creating Customer-Defined Service Standards Form a group of four people Use your school’s undergraduate or graduate program, or an approved alternative Complete the customer-driven service standards importance chart Establish standards for the most important and lowest-performed behaviors and actions Be prepared to present your findings to the class
Customer-Driven Standards and Measurements Exercise Service Encounter Customer Requirements Measurements Service Quality
Figure 10.3 What Customers Expect: Getting to Actionable Steps Satisfaction Relationship Reliability Empathy Assurance Tangibles Responsiveness Price Delivers on time Returns calls quickly Knows my industry  Delivers by Wednesday Returns calls in two hours Knows strengths of my competitors Requirements: Abstract Concrete  Dig  deeper Dig  deeper Dig  deeper Diagnosticity: Low High General concepts Dimensions Behaviors and actions Attributes Value Solution Provider
Figure 10.4 Process for Setting Customer-Defined Standards 2. Translate customer expectations into behaviors/actions 5. Develop feedback mechanisms Measure by audits or operating data Hard Soft Measure by transaction- based surveys 3. Select behaviors/actions for standards 6. Establish measures and target levels 7. Track measures against standards 8. Provide feedback about performance to employees 9. Update target levels and measures 1. Identify existing or desired service encounter sequence 4. Set hard or soft standards
Figure 10.5 Importance/Performance Matrix
Figure 10.6 Linkage between Soft Measures and Hard Measures for Speed of Complaint Handling 2  4  6  8  12  16  20  24 WORKING HOURS Large Customers Small Customers 10 9 8 7 6 5 4 3 2 1 0 SATISFACTION
Physical Evidence and the Servicescape Physical Evidence Types of Servicescapes Strategic Roles of the Servicescape Framework for Understanding Servicescape Effects on Behavior Guidelines for Physical Evidence Strategy 11 Chapter
Objectives for Chapter 11: Physical Evidence and the Servicescape Explain the profound impact of physical evidence, particularly the servicescape, on customer perceptions and experiences. Illustrate differences in types of servicescapes, the roles played by the servicescape, and the implications for strategy. Explain  why  the servicescape affects customer and employee behavior, using a framework based in marketing, organizational behavior, and environmental psychology. Present elements of an effective physical evidence strategy.
Figure 11.1 Speedi-Lube Spells Out the Service Offering
Table 11.1 Elements of Physical Evidence
Table 11.2  Examples of Physical Evidence from the Customer’s Point of View
Table 11.3  Typology of Service Organizations Based on Variations in Form and Use of the Servicescape
Roles of the Servicescape Package conveys expectations  influences perceptions Facilitator facilitates the flow of the service delivery process provides information (how am I to act?) facilitates the ordering process (how does this work?) facilitates service delivery Socializer facilitates interaction between: customers and employees customers and fellow customers Differentiator sets provider apart from competition in the mind of the consumer
Figure 11.2 A Framework for Understanding Environment-User Relationships in Service Organizations Source : M. J. Bitner, “Servicescapes: The Impact of Physical Surroundings on Customers and Employees,”  Journal of Marketing  56 (April 1992), 57–71.
Guidelines for Physical Evidence Strategy Recognize the strategic impact of physical evidence. Blueprint the physical evidence of service. Clarify strategic roles of the servicescape. Assess and identify physical evidence opportunities. Be prepared to update and modernize the evidence. Work cross-functionally.

Bm404 lecture5

  • 1.
  • 2.
    Portfolio of ServicesResearch Customer Complaint Solicitation/ CIStudies “ Relationship”/SERVQUAL Surveys Post-Transaction Surveys Customer Focus Groups “ Mystery Shopping” of Service Providers Employee Surveys Identify dissatisfied customers to attempt recovery; identify most common categories of service failure for remedial action Obtain customer feedback while service experience is fresh; act on feedback quickly if negative patterns develop Use as input for quantitative surveys; provide a forum for customers to suggest service-improvement ideas Assess company’s service performance compared to competitors; identify service-improvement priorities; track service improvement over time Measure individual employee service behaviors for use in coaching, training, performance evaluation, recognition and rewards; identify systemic strengths and weaknesses in service Measure internal service quality; identify employee-perceived obstacles to improve service; track employee morale and attitudes Determine the reasons why customers defect Research Objective Type of Research Lost Customer Research Future Expectations Research Forecast future expectations of customers; develop and test new service ideas
  • 3.
    Tracking of CustomerExpectations and Perceptions of Service Reliability Source : E. Sivadas, “Europeans Have a Different Take on CS [Customer Satisfaction] Programs,” Marketing News , October 26, 1998, p. 39.
  • 4.
    Service Quality Perceptions Relative to Zones of Tolerance Retail Chain 9 8 7 6 5 4 3 2 1 0 Reliability Responsiveness Assurance Empathy Tangibles O O = Zone of Tolerance = Service Quality Perception O O O O
  • 5.
    Importance/Performance Matrix HIGHHIGH LOW Performance Importance           Attributes to Improve Attributes to Maintain High Leverage Attributes to De-emphasize Attributes to Maintain Low Leverage Low Leverage
  • 6.
    Upward communication Executivevisits to customers Executive/management listening to customers Research on intermediate customers Research on internal customers Executive/management listening to employees Employee suggestion
  • 7.
    Building customerrelationships
  • 8.
    Relationship Marketing Customerrelationships Strangers Acquaintances Friends Partners
  • 9.
    Customer Goals ofRelationship Marketing
  • 10.
    Relationship marketing Benefitsfor customers Benefits for firms
  • 11.
    Lifetime Value ofan Average Business Customer at Telecheck International
  • 12.
    The Customer Pyramid– Profitability Segments Most profitable customers Least profitable customers What segment spends more with us over time, costs less to maintain, spreads positive word-of-mouth? What segment costs us in time, effort and money yet does not provide the return we want? What segment is difficult to do business with? Gold Iron Lead Platinum
  • 13.
    Relationship Development ModelCustomer Benefits Confidence benefits Social benefits Special treatment benefits Relationship Bonds Financial bonds Social bonds Customization bonds Structural bonds Switching Barriers Customer inertia Switching costs Core Service Provision Satisfaction Perceived service quality Perceived value Strong Customer Relationship (Loyalty) Firm Benefits Economic benefits Customer behavior benefits Human resource management benefits
  • 14.
    Strategies for BuildingRelationships Core Service Provision: service foundations built upon delivery of excellent service: satisfaction, perceived service quality, perceived value Switching Barriers: customer inertia switching costs: set up costs, search costs, learning costs, contractual costs Relationship Bonds
  • 15.
    Levelsof Relationship Strategies Excellent service and value 1. Financial bonds 2. Social bonds 4. Structural bonds 3. Customization Bonds Volume and frequency rewards Bundling and cross selling Stable pricing Social bonds among customers Personal relationships Continuous relationships Customer intimacy Mass customization Anticipation/ innovation Shared processes and equipment Joint investments Integrated information systems
  • 16.
  • 17.
    Unhappy Customers’ RepurchaseIntentions 82% 54% 19% 9% Complaints Resolved Quickly Complaints Resolved Complaints Not Resolved Unhappy Customers Who Don’t Complain Unhappy Customers Who Do Complain Percent of customers who will buy again after a major complaint (over $100 in losses) Source: Adapted from data reported by the Technical Assistance Research Program.
  • 18.
    Customer Complaint ActionsFollowing Service Failure
  • 19.
    Satisfaction consequences McColl-Kennedy (2003)
  • 20.
    Satisfaction consequences (cont.) McColl-Kennedy (2003)
  • 21.
    Types of complainersPassives Voicers Irates Activists Singh ‘ A typology of customer complaint styles’
  • 22.
    Causes Behind ServiceSwitching Service Switching Behavior High price Price increases Unfair pricing Deceptive pricing Pricing Location/hours Wait for appointment Wait for service Inconvenience Service mistakes Billing errors Service catastrophe Core Service Failure Uncaring Impolite Unresponsive Unknowledgeable Service Encounter Failures Negative response No response Reluctant response Response to Service Failure Found better service Competition Cheat Hard sell Unsafe Conflict of interest Ethical Problems Customer moved Provider closed Involuntary Switching Source : Sue Keaveney, “Customer Switching Behavior in Service Industries: An Exploratory Study,” Journal of Marketing , April, 1995, pp. 71-82.
  • 23.
    Service Recovery StrategiesTreat Customers Fairly Learn from Recovery Experiences Act Quickly Fail-safe the Service Cultivate Relationships with Customers Encourage and Track Complaints Provide Adequate Explanations Learn from Lost Customers Service Recovery Strategies
  • 24.
    Service Guarantees ina business context, a guarantee is a pledge or assurance that a product offered by a firm will perform as promised and, if not, then some form of reparation will be undertaken by the firm for tangible products, a guarantee is often done in the form of a warranty services are often not guaranteed cannot return the service service experience is intangible (so what do you guarantee?)
  • 25.
    Why a GoodGuarantee Works forces company to focus on customers sets clear standards generates feedback forces company to understand why it failed builds “marketing muscle”
  • 26.
    Characteristics of anEffective Service Guarantee Unconditional the guarantee should make its promise unconditionally – no strings attached Meaningful the firm should guarantee elements of the service that are important to the customer the payout should cover fully the customer’s dissatisfaction Easy to Understand and Communicate customers need to understand what to expect employees need to understand what to do Easy to Invoke and Collect the firm should eliminate hoops or red tape in the way of accessing or collecting on the guarantee Source : Christopher W.L. Hart, “The Power of Unconditional Guarantees,” Harvard Business Review , July-August, 1988, pp. 54-62.
  • 27.
    Service Guarantees Doeseveryone need a guarantee? Reasons companies might NOT want to offer a service guarantee: existing service quality is poor guarantee does not fit the company’s image too many uncontrollable external variables fears of cheating or abuse by customers costs of the guarantee outweigh the benefits customers perceive little risk in the service customers perceive little variability in service quality among competitors
  • 28.
    Service Guarantees serviceguarantees work for companies who are already customer-focused effective guarantees can be BIG deals – they put the company at risk in the eyes of the customer customers should be involved in the design of service guarantees the guarantee should be so stunning that it comes as a surprise – a WOW!! factor “it’s the icing on the cake, not the cake”
  • 29.
  • 30.
    Risks of Relyingon Words Alone to Describe Services Oversimplification Incompleteness Subjectivity Biased Interpretation
  • 31.
    Types of NewServices major or radical innovations start-up businesses new services for the currently served market service line extensions service improvements style changes
  • 32.
    New Service DevelopmentProcess Sources : Booz-Allen & Hamilton, 1982; Bowers, 1985; Cooper, 1993; Khurana & Rosenthal 1997. Business strategy development or review New service strategy development Idea generation Concept development and evaluation Business analysis Service development and testing Postintroduction evaluation Commercialization Market testing Screen ideas against new service strategy Test concept with customers and employees Test for profitability and feasibility Conduct service prototype test Test service and other marketing-mix elements Front-end Planning Implementation
  • 33.
    New Service StrategyMatrix for Identifying Growth Opportunities Markets Offerings Existing Services New Services Current Customers New Customers Share building Diversification Market development Service development
  • 34.
    Service Blueprinting Atool for simultaneously depicting the service process, the points of customer contact, and the evidence of service from the customer’s point of view. Service Blueprint Process Points of contact Evidence
  • 35.
    Service Blueprint ComponentsCustomer Actions line of interaction “ Onstage” Contact Employee Actions line of visibility “ Backstage” Contact Employee Actions line of internal interaction Support Processes
  • 36.
  • 37.
    Blueprint for ExpressMail Delivery Service Driver Picks Up Package Dispatch Driver Airport Receives & Loads Sort Packages Load on Airplane Fly to Destination Unload & Sort Load On Truck SUPPORT PROCESS CONTACT PERSON (Back Stage) (On Stage) CUSTOMER PHYSICAL EVIDENCE Customer Gives Package Truck Packaging Forms Hand-held Computer Uniform Truck Packaging Forms Hand-held Computer Uniform Deliver Package Customer Service Order Fly to Sort Center Line of interaction Line of visibility Line of internal interaction Customer Calls Receive Package
  • 38.
    Blueprint for OvernightHotel Stay Service SUPPORT PROCESS CONTACT PERSON (Back Stage) (On Stage) CUSTOMER Hotel Exterior Parking Cart for Bags Desk Registration Papers Lobby Key Elevators Hallways Room Cart for Bags Room Amenities Bath Menu Delivery Tray Food Appearance Food Bill Desk Lobby Hotel Exterior Parking Arrive at Hotel Give Bags to Bellperson Check in Go to Room Receive Bags Sleep Shower Call Room Service Receive Food Eat Check out and Leave Greet and Take Bags Process Registration Deliver Bags Deliver Food Process Check Out Take Bags to Room Take Food Order Registration System Prepare Food PHYSICAL EVIDENCE Line of Interaction Line of Visibility Line of Internal Interaction Registration System
  • 39.
    Building a ServiceBlueprint Step 1 Identify the process to be blue-printed Step 2 Identify the customer or customer segment Step 3 Map the process from the customer’s point of view Step 4 Map contact employee actions, onstage and back-stage, and/or technology actions Step 5 Link contact activities to needed support functions Step 6 Add evidence of service at each customer action step
  • 40.
    Application of ServiceBlueprints New Service Development concept development market testing Supporting a “Zero Defects” Culture managing reliability identifying empowerment issues Service Recovery Strategies identifying service problems conducting root cause analysis modifying processes
  • 41.
    Blueprints Can BeUsed By: Service Marketers creating realistic customer expectations: service system design promotion Operations Management rendering the service as promised: managing fail points training systems quality control Human Resources Management empowering the human element: job descriptions selection criteria appraisal systems System Technology providing necessary tools: system specifications personal preference databases
  • 42.
    Customer-Defined Service StandardsFactors Necessary for Appropriate Service Standards Types of Customer-Defined Service Standards Development of Customer-Defined Service Standards 10 Chapter
  • 43.
    Customer-Defined Service StandardsDistinguish between company-defined and customer-defined service standards. Differentiate among one-time service fixes and “hard” and “soft” customer-defined standards. Explain the critical role of the service encounter sequence in developing customer-defined standards. Illustrate how to translate customer expectations into behaviors and actions that are definable, repeatable, and actionable. Explain the process of developing customer-defined service standards. Emphasize the importance of service performance indexes in implementing strategy for service delivery.
  • 44.
    Examples of HardCustomer-Defined Standards
  • 45.
    Examples of SoftCustomer-Defined Standards
  • 46.
    AT&T’s Process Mapfor Measurements Source : R. E. Kordupleski, R. T. Rust, and A. J. Zaharik, “Why Improving Quality Doesn’t Improve Quality (or Whatever Happened to Marketing?),” California Management Review 35, no. 3 (Spring 1993).
  • 47.
    AT&T’s Process Mapfor Measurements Reliability (40%) Easy To Use (20%) Features / Functions (40%) Knowledge (30%) Responsive (25%) Follow-Up (10%) Delivery Interval Meets Needs (30%) Does Not Break (25%) Installed When Promised (10%) No Repeat Trouble (30%) Fixed Fast (25%) Kept Informed (10%) Accuracy, No Surprise (45%) Resolve On First Call (35%) Easy To Understand (10%) Business Process Customer Need Internal Metric 30% Product 30% Sales 10% Installation 15% Repair 15% Billing % Repair Call % Calls for Help Functional Performance Test Supervisor Observations % Proposal Made on Time % Follow Up Made Average Order Interval % Repair Reports % Installed On Due Date % Repeat Reports Average Speed Of Repair % Customers Informed % Billing Inquiries % Resolved First Call % Billing Inquiries Total Quality Source: AT&T General Business Systems
  • 48.
    Exercise for CreatingCustomer-Defined Service Standards Form a group of four people Use your school’s undergraduate or graduate program, or an approved alternative Complete the customer-driven service standards importance chart Establish standards for the most important and lowest-performed behaviors and actions Be prepared to present your findings to the class
  • 49.
    Customer-Driven Standards andMeasurements Exercise Service Encounter Customer Requirements Measurements Service Quality
  • 50.
    Figure 10.3 WhatCustomers Expect: Getting to Actionable Steps Satisfaction Relationship Reliability Empathy Assurance Tangibles Responsiveness Price Delivers on time Returns calls quickly Knows my industry Delivers by Wednesday Returns calls in two hours Knows strengths of my competitors Requirements: Abstract Concrete Dig deeper Dig deeper Dig deeper Diagnosticity: Low High General concepts Dimensions Behaviors and actions Attributes Value Solution Provider
  • 51.
    Figure 10.4 Processfor Setting Customer-Defined Standards 2. Translate customer expectations into behaviors/actions 5. Develop feedback mechanisms Measure by audits or operating data Hard Soft Measure by transaction- based surveys 3. Select behaviors/actions for standards 6. Establish measures and target levels 7. Track measures against standards 8. Provide feedback about performance to employees 9. Update target levels and measures 1. Identify existing or desired service encounter sequence 4. Set hard or soft standards
  • 52.
  • 53.
    Figure 10.6 Linkagebetween Soft Measures and Hard Measures for Speed of Complaint Handling 2 4 6 8 12 16 20 24 WORKING HOURS Large Customers Small Customers 10 9 8 7 6 5 4 3 2 1 0 SATISFACTION
  • 54.
    Physical Evidence andthe Servicescape Physical Evidence Types of Servicescapes Strategic Roles of the Servicescape Framework for Understanding Servicescape Effects on Behavior Guidelines for Physical Evidence Strategy 11 Chapter
  • 55.
    Objectives for Chapter11: Physical Evidence and the Servicescape Explain the profound impact of physical evidence, particularly the servicescape, on customer perceptions and experiences. Illustrate differences in types of servicescapes, the roles played by the servicescape, and the implications for strategy. Explain why the servicescape affects customer and employee behavior, using a framework based in marketing, organizational behavior, and environmental psychology. Present elements of an effective physical evidence strategy.
  • 56.
    Figure 11.1 Speedi-LubeSpells Out the Service Offering
  • 57.
    Table 11.1 Elementsof Physical Evidence
  • 58.
    Table 11.2 Examples of Physical Evidence from the Customer’s Point of View
  • 59.
    Table 11.3 Typology of Service Organizations Based on Variations in Form and Use of the Servicescape
  • 60.
    Roles of theServicescape Package conveys expectations influences perceptions Facilitator facilitates the flow of the service delivery process provides information (how am I to act?) facilitates the ordering process (how does this work?) facilitates service delivery Socializer facilitates interaction between: customers and employees customers and fellow customers Differentiator sets provider apart from competition in the mind of the consumer
  • 61.
    Figure 11.2 AFramework for Understanding Environment-User Relationships in Service Organizations Source : M. J. Bitner, “Servicescapes: The Impact of Physical Surroundings on Customers and Employees,” Journal of Marketing 56 (April 1992), 57–71.
  • 62.
    Guidelines for PhysicalEvidence Strategy Recognize the strategic impact of physical evidence. Blueprint the physical evidence of service. Clarify strategic roles of the servicescape. Assess and identify physical evidence opportunities. Be prepared to update and modernize the evidence. Work cross-functionally.

Editor's Notes

  • #61 Dental laser “drill”