Download to read offline
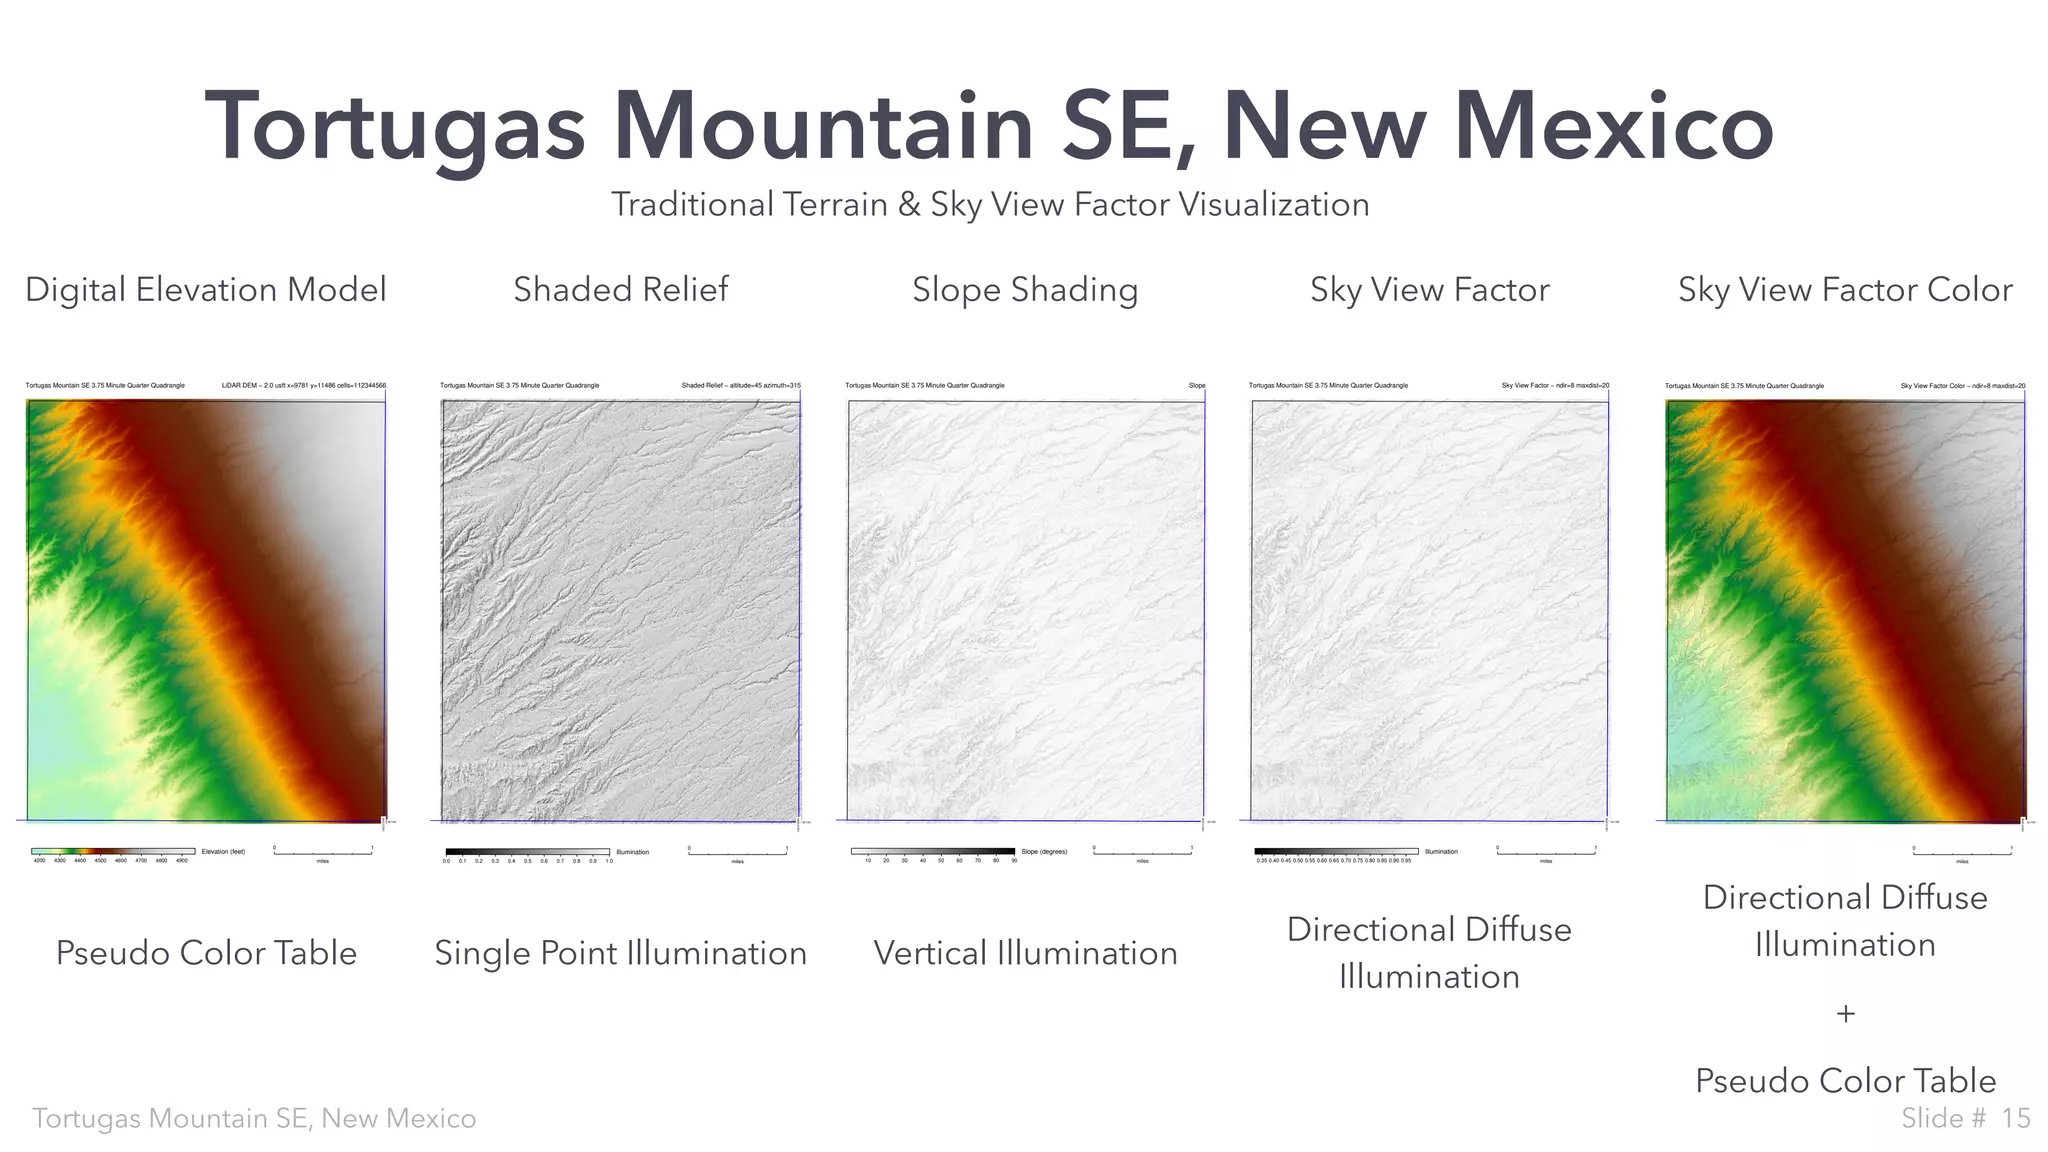
![Sky view factor | n. A model of terrain visualization that uses an input
digital elevation model (DEM) to calculate the degree to which each
grid cell location is visible to the sky. [3]
The resulting calculations are used to shade and simulate multi-
directional diffuse illumination over the surface model. [2]
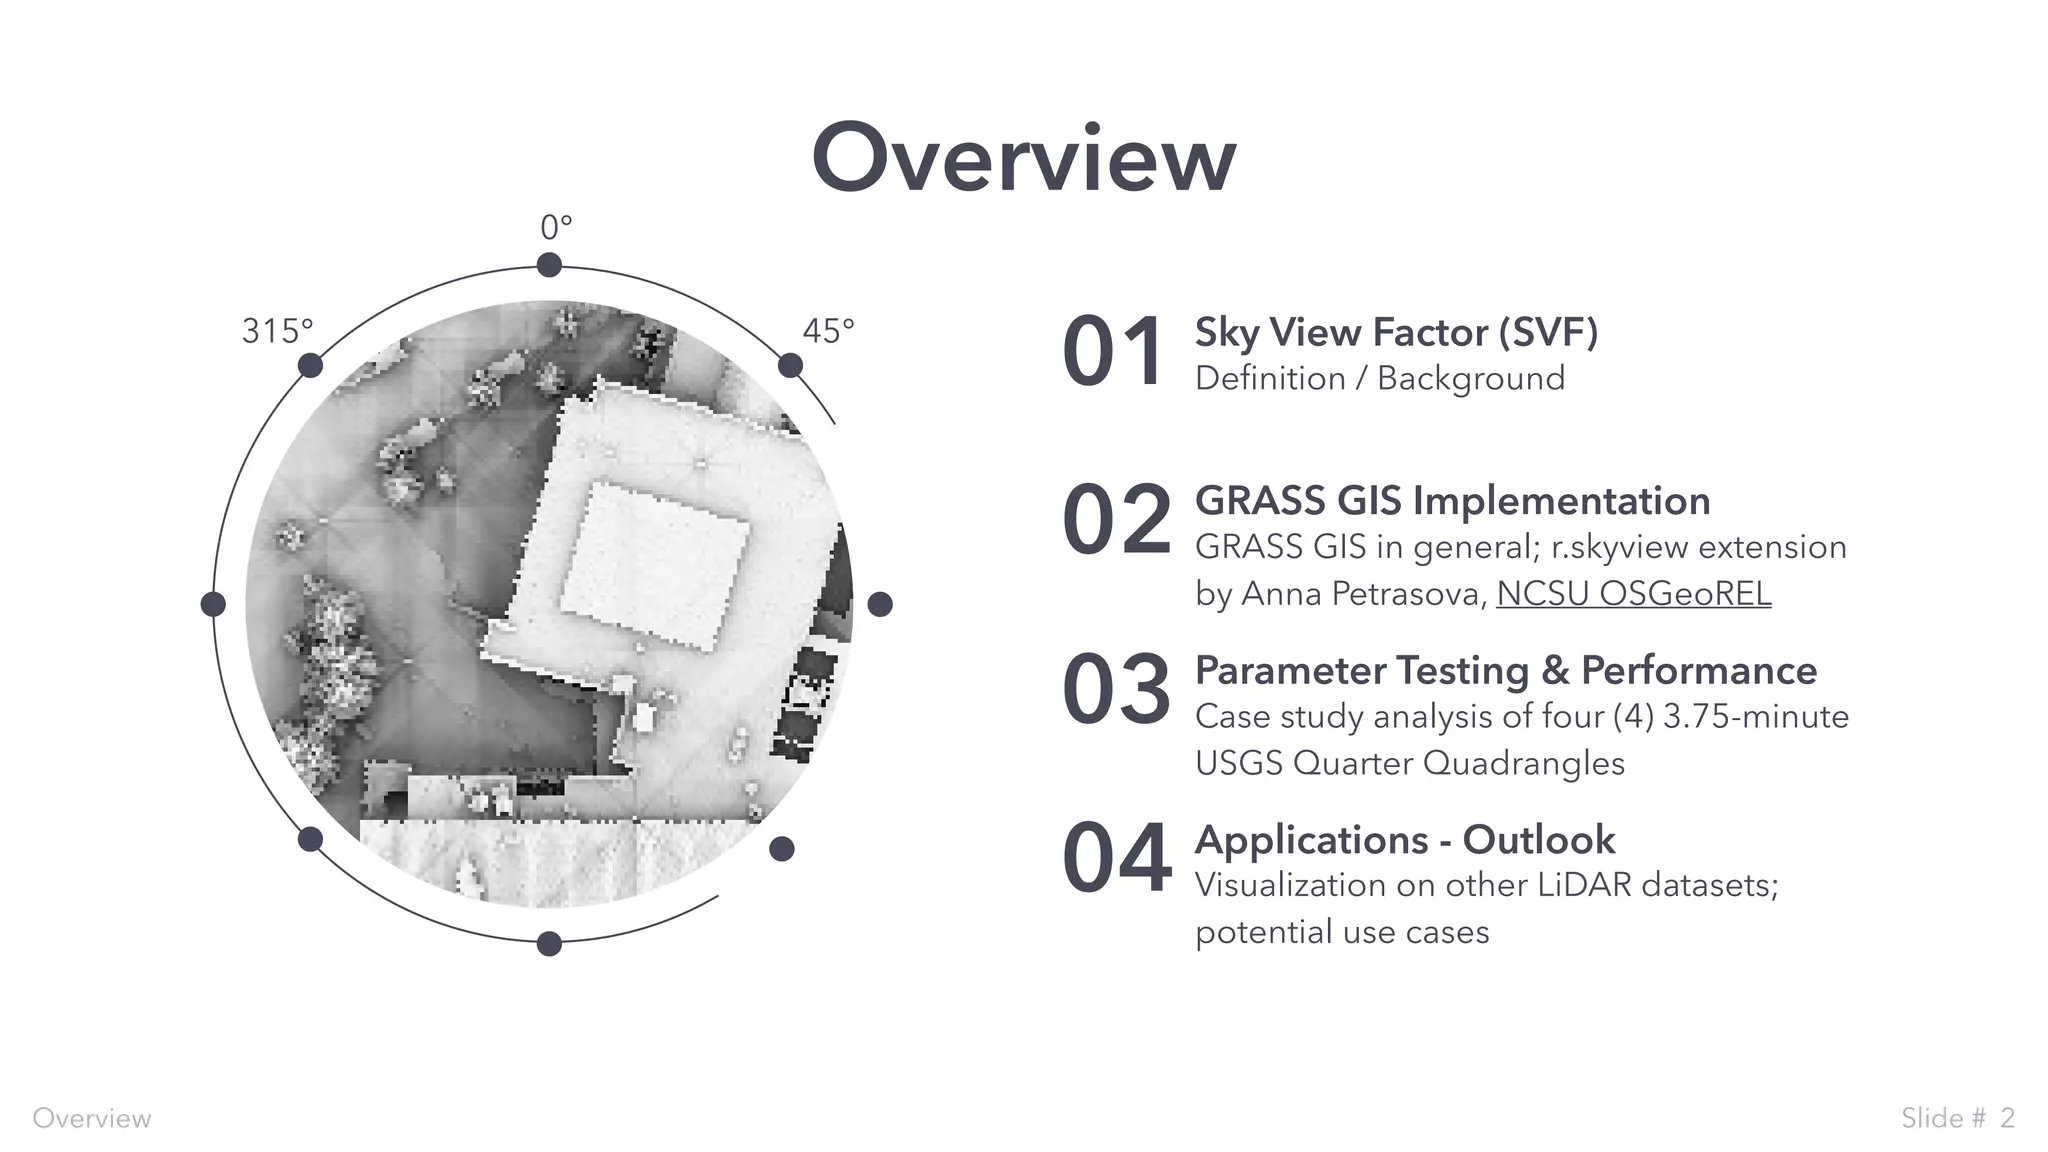
Sky View Factor (SVF)
Sky View Factor (SVF)
[1] B. Stular, Z. Kokalj, K. Ostir and L. Nuninger, "Visualization of lidar-derived
relief models for detection of archaeological features," Journal of
Archaeological Science, vol. 39, pp. 3354-3360, 2012.
[2] K. Zakšek, K. Oštir and Z. Kokalj, "Sky-View Factor as a Relief
Visualization Technique," Remote Sensing, vol. 3, pp. 398-415, 2011.
[3] Z. Kokalj, K. Zaksek and K. Ostir, "Application of sky-view factor for the
visualisation of historic landscape features in lidar-derived relief models,"
Antiquity, p. 263–273, March 2011.
[4] P. J. Kennelly and A. J. Stewart, "A Uniform Sky Illumination Model to
Enhance Shading of Terrain and Urban Areas," Cartography and
Geographic Information Science, vol. 33, no. 1, pp. 21-36, January 2006.
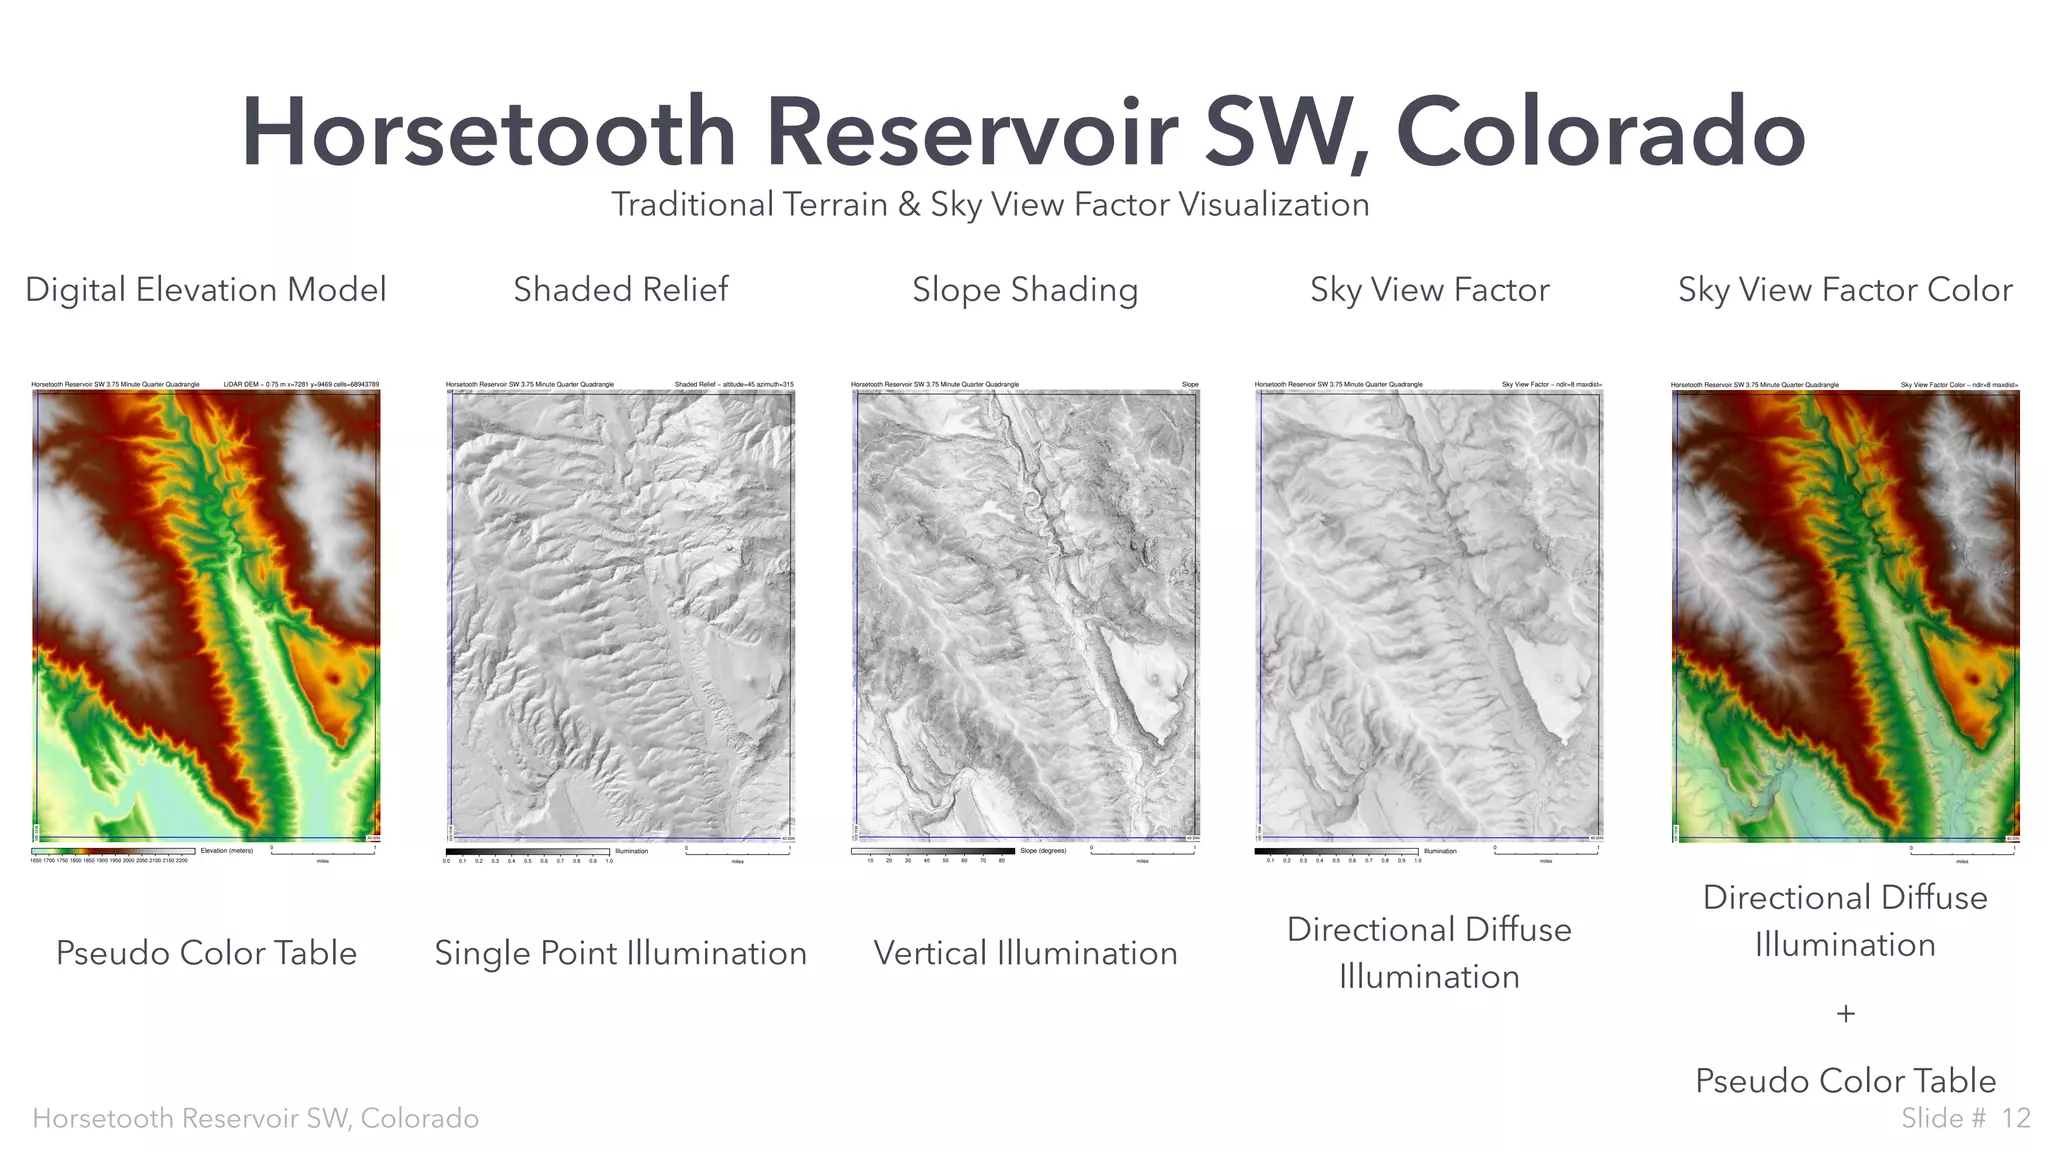
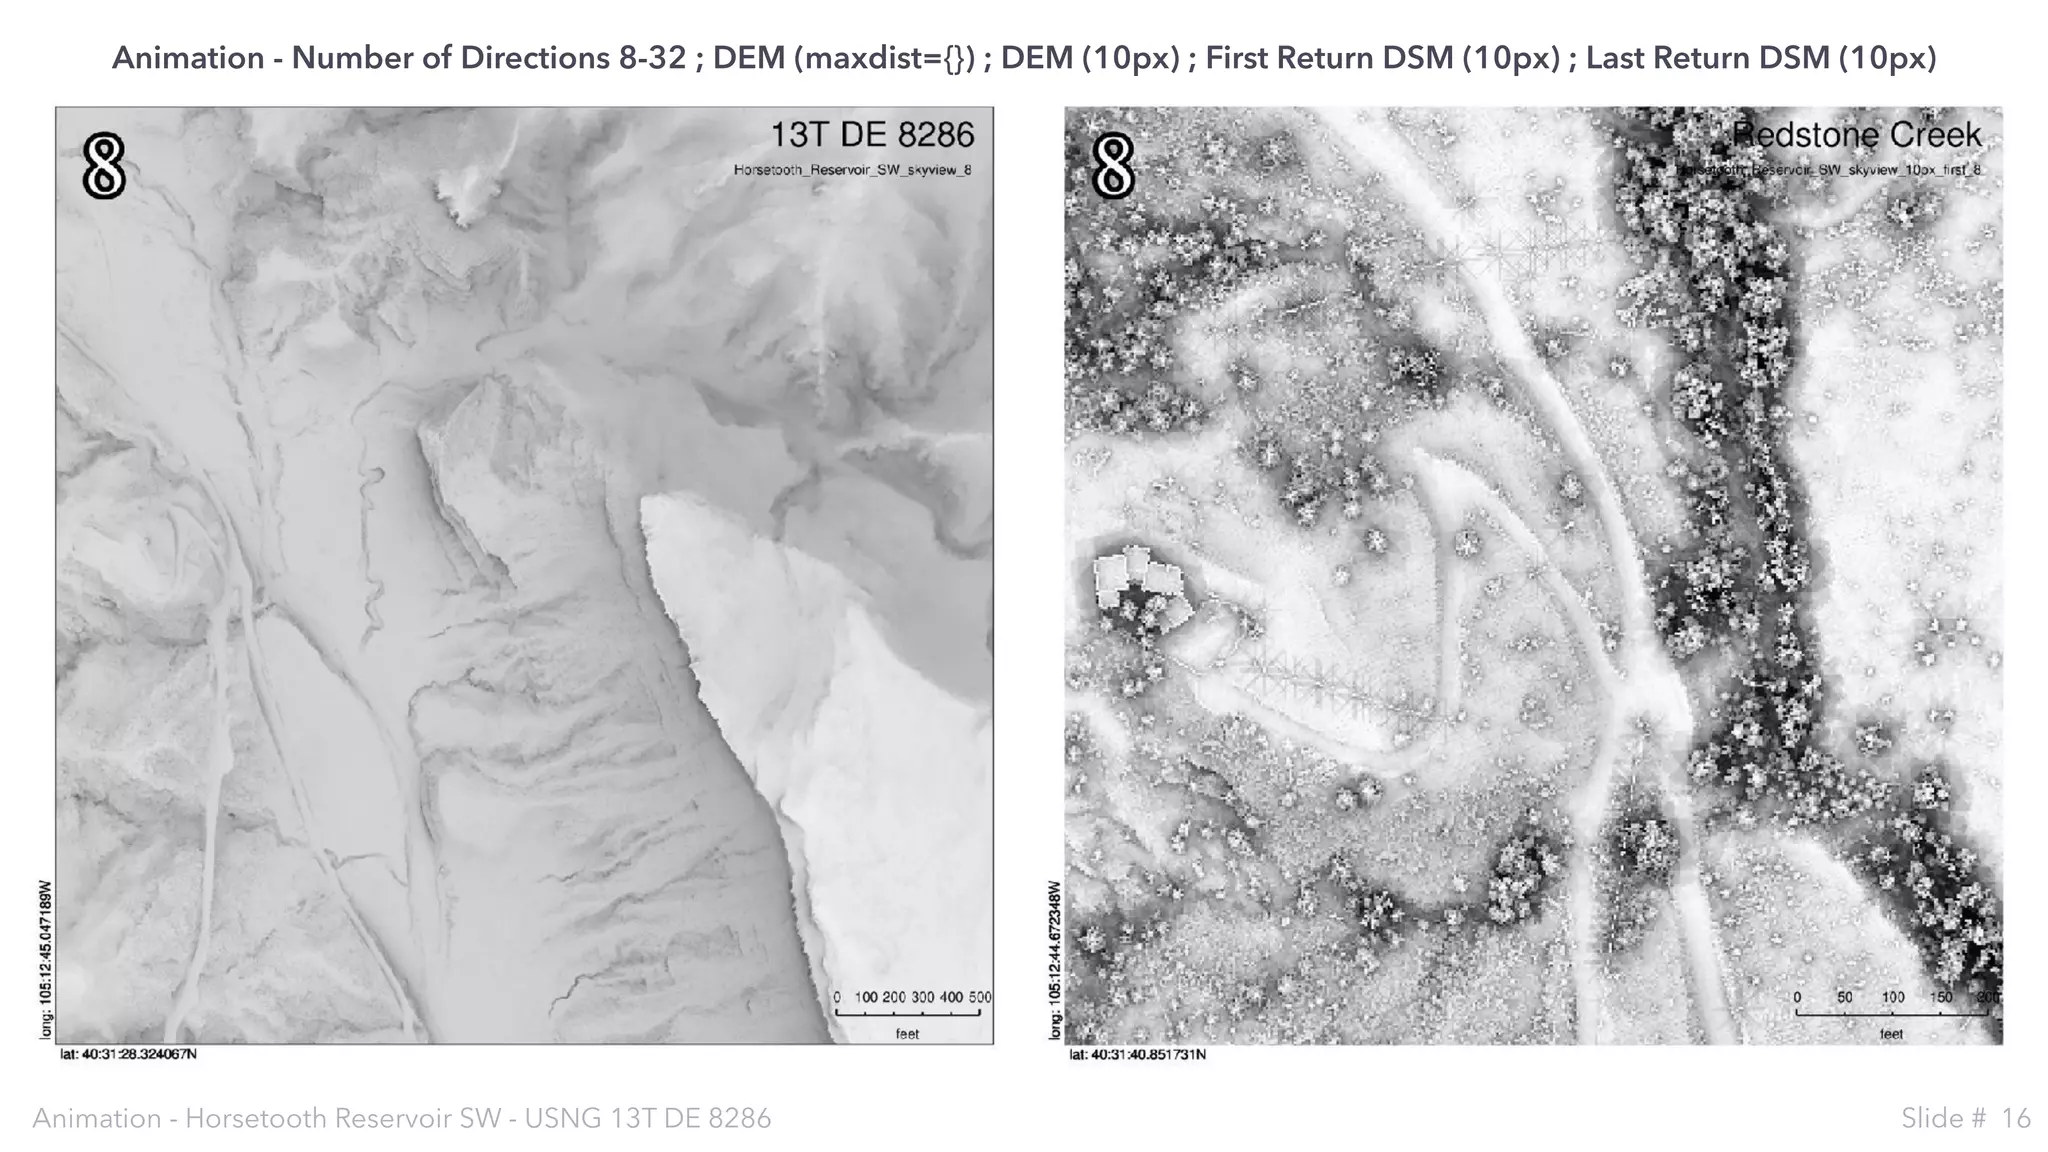
Horsetooth Reservoir SW
3Slide #](https://image.slidesharecdn.com/grassgisstrikingterrainvisualizationsintherockiesdzur-181003005517/75/2018-GIS-in-Development-Grass-GIS-Striking-Terrain-Visualizations-in-the-Rockies-3-2048.jpg)
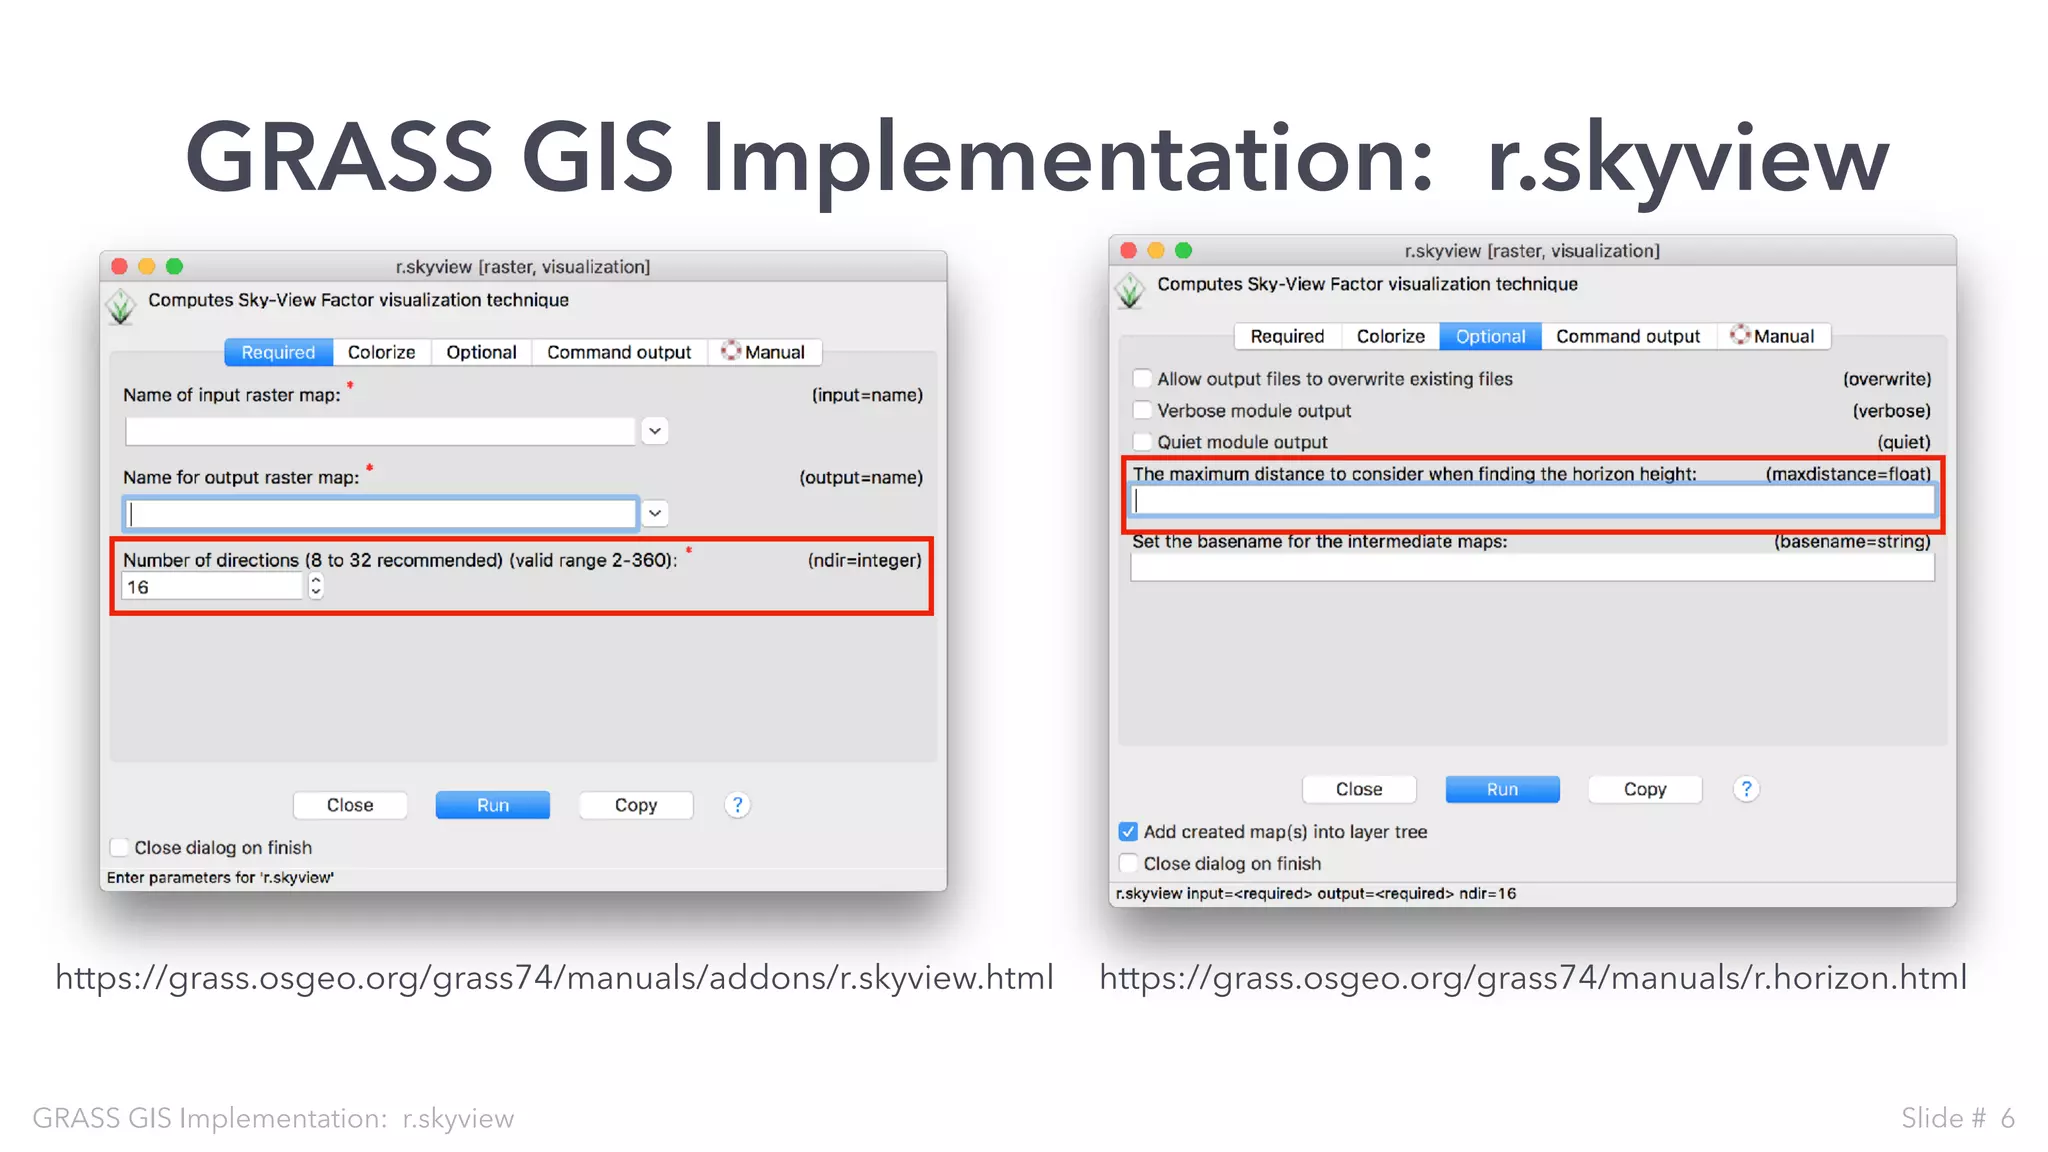
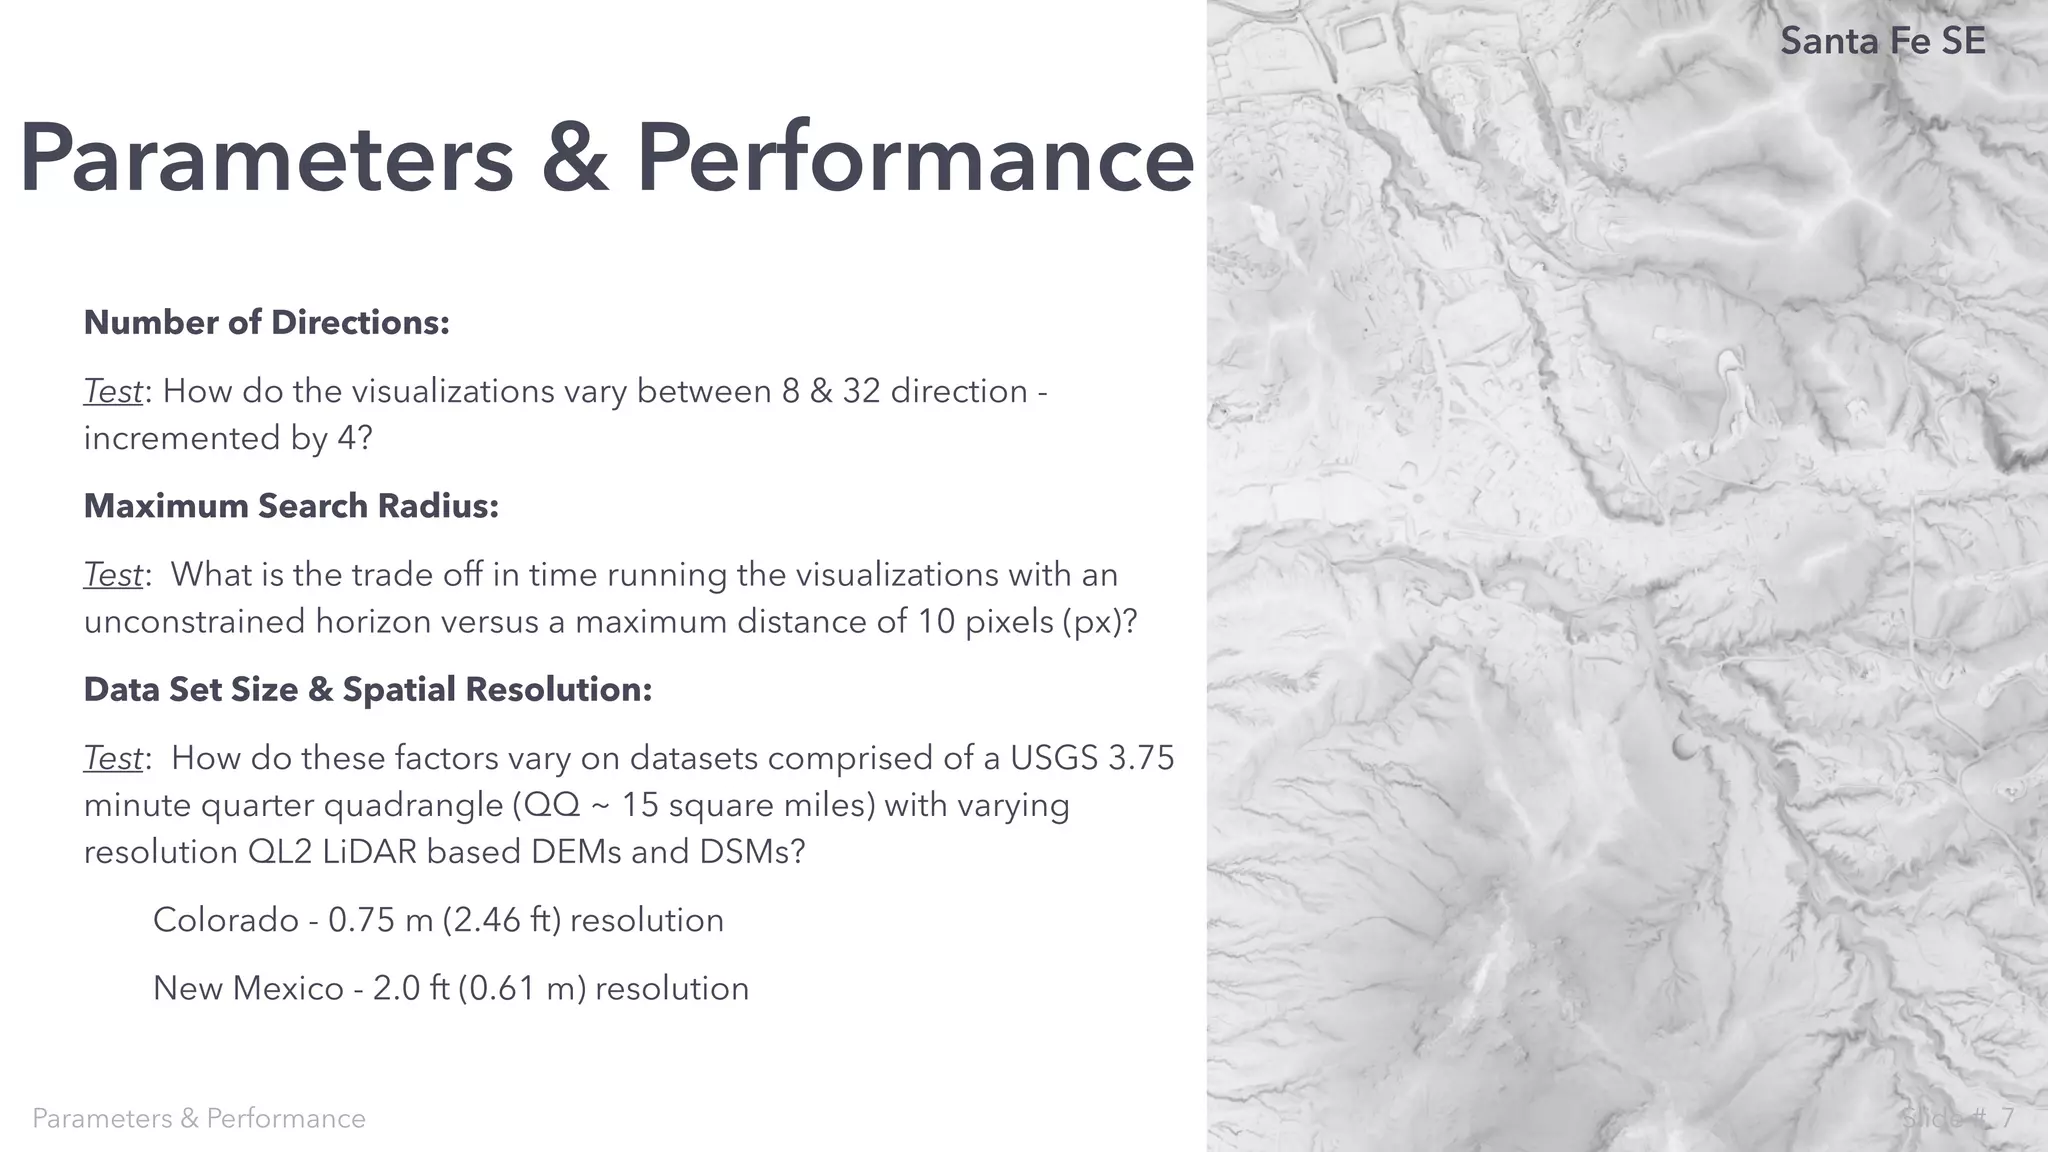
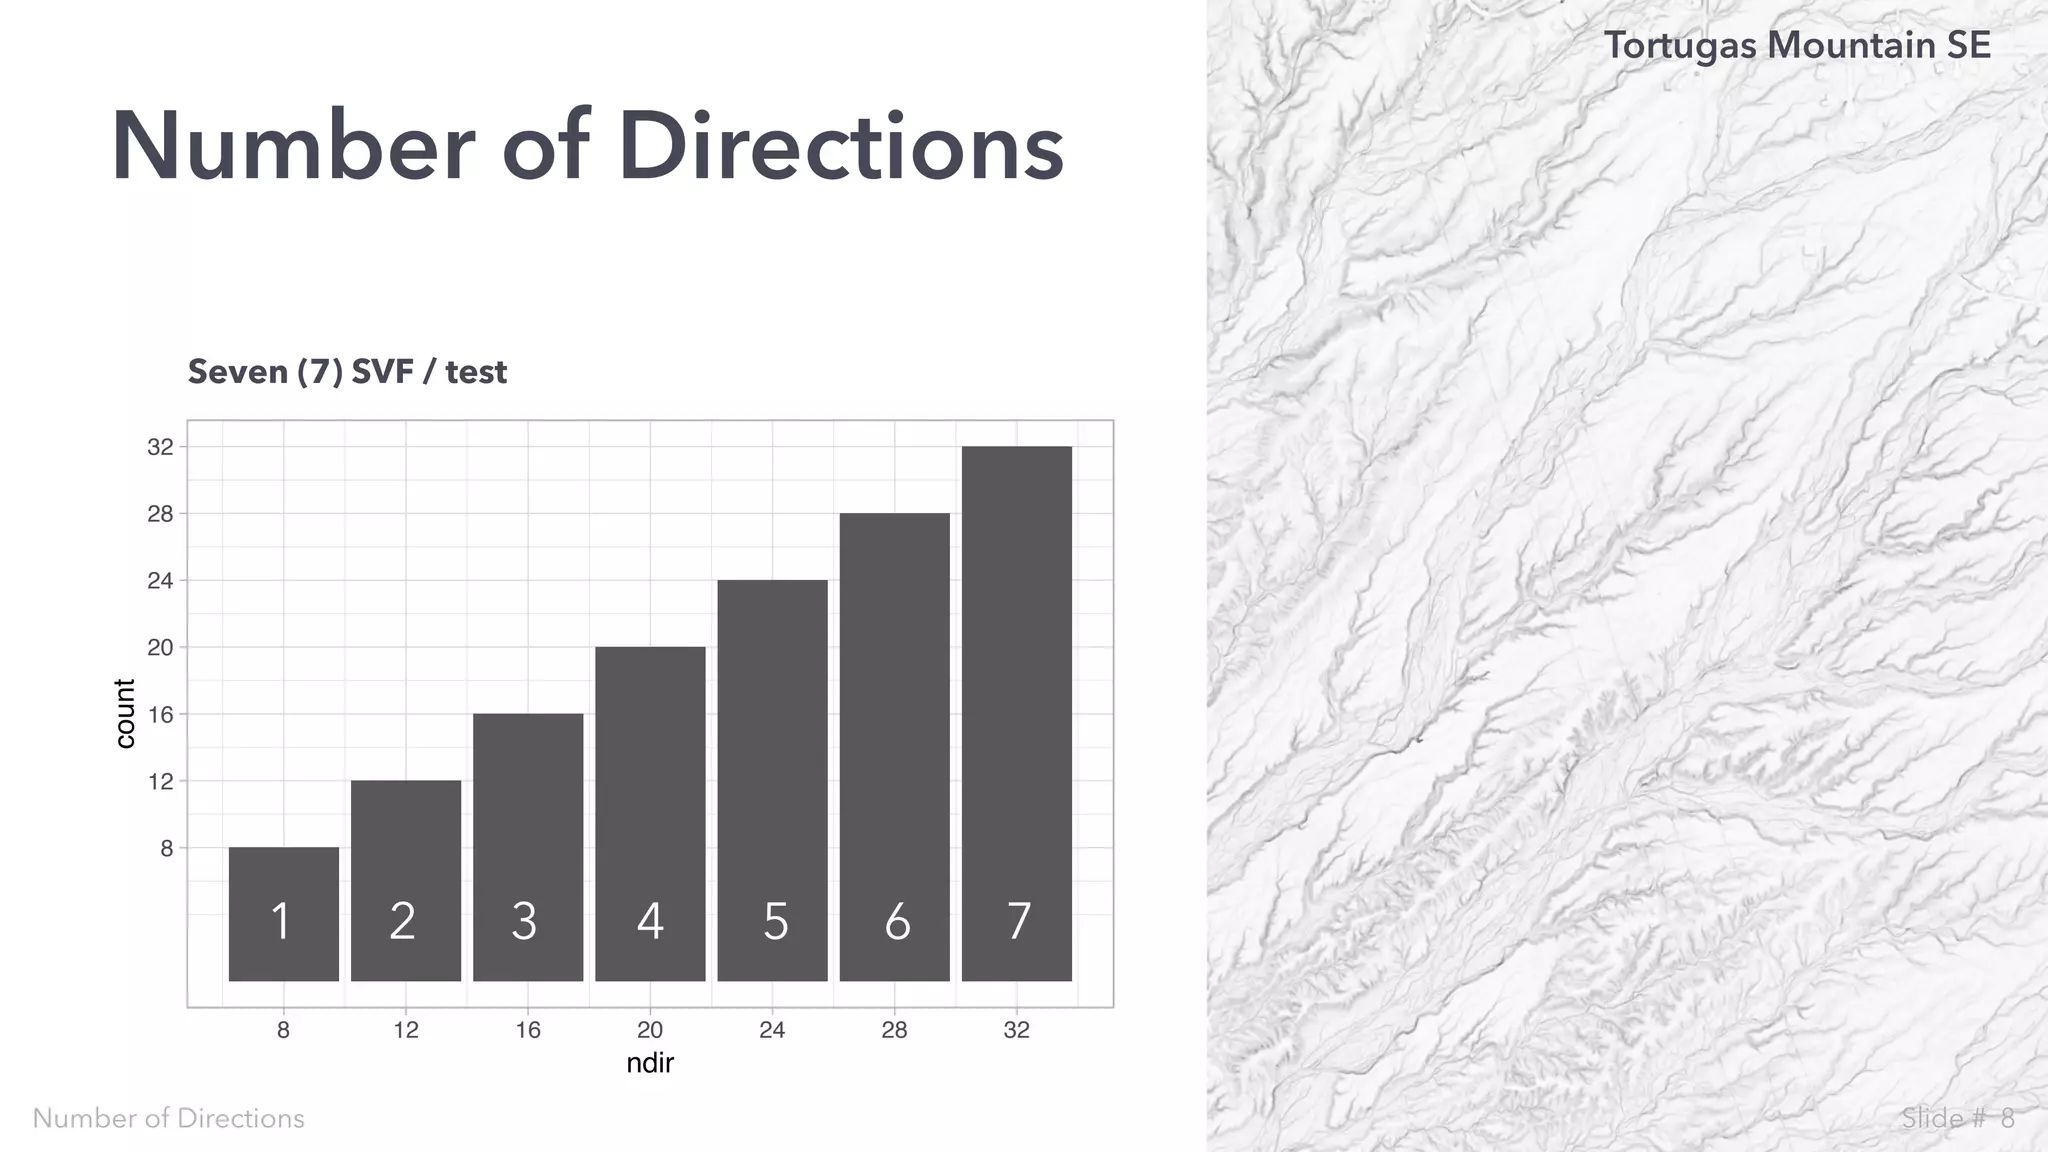
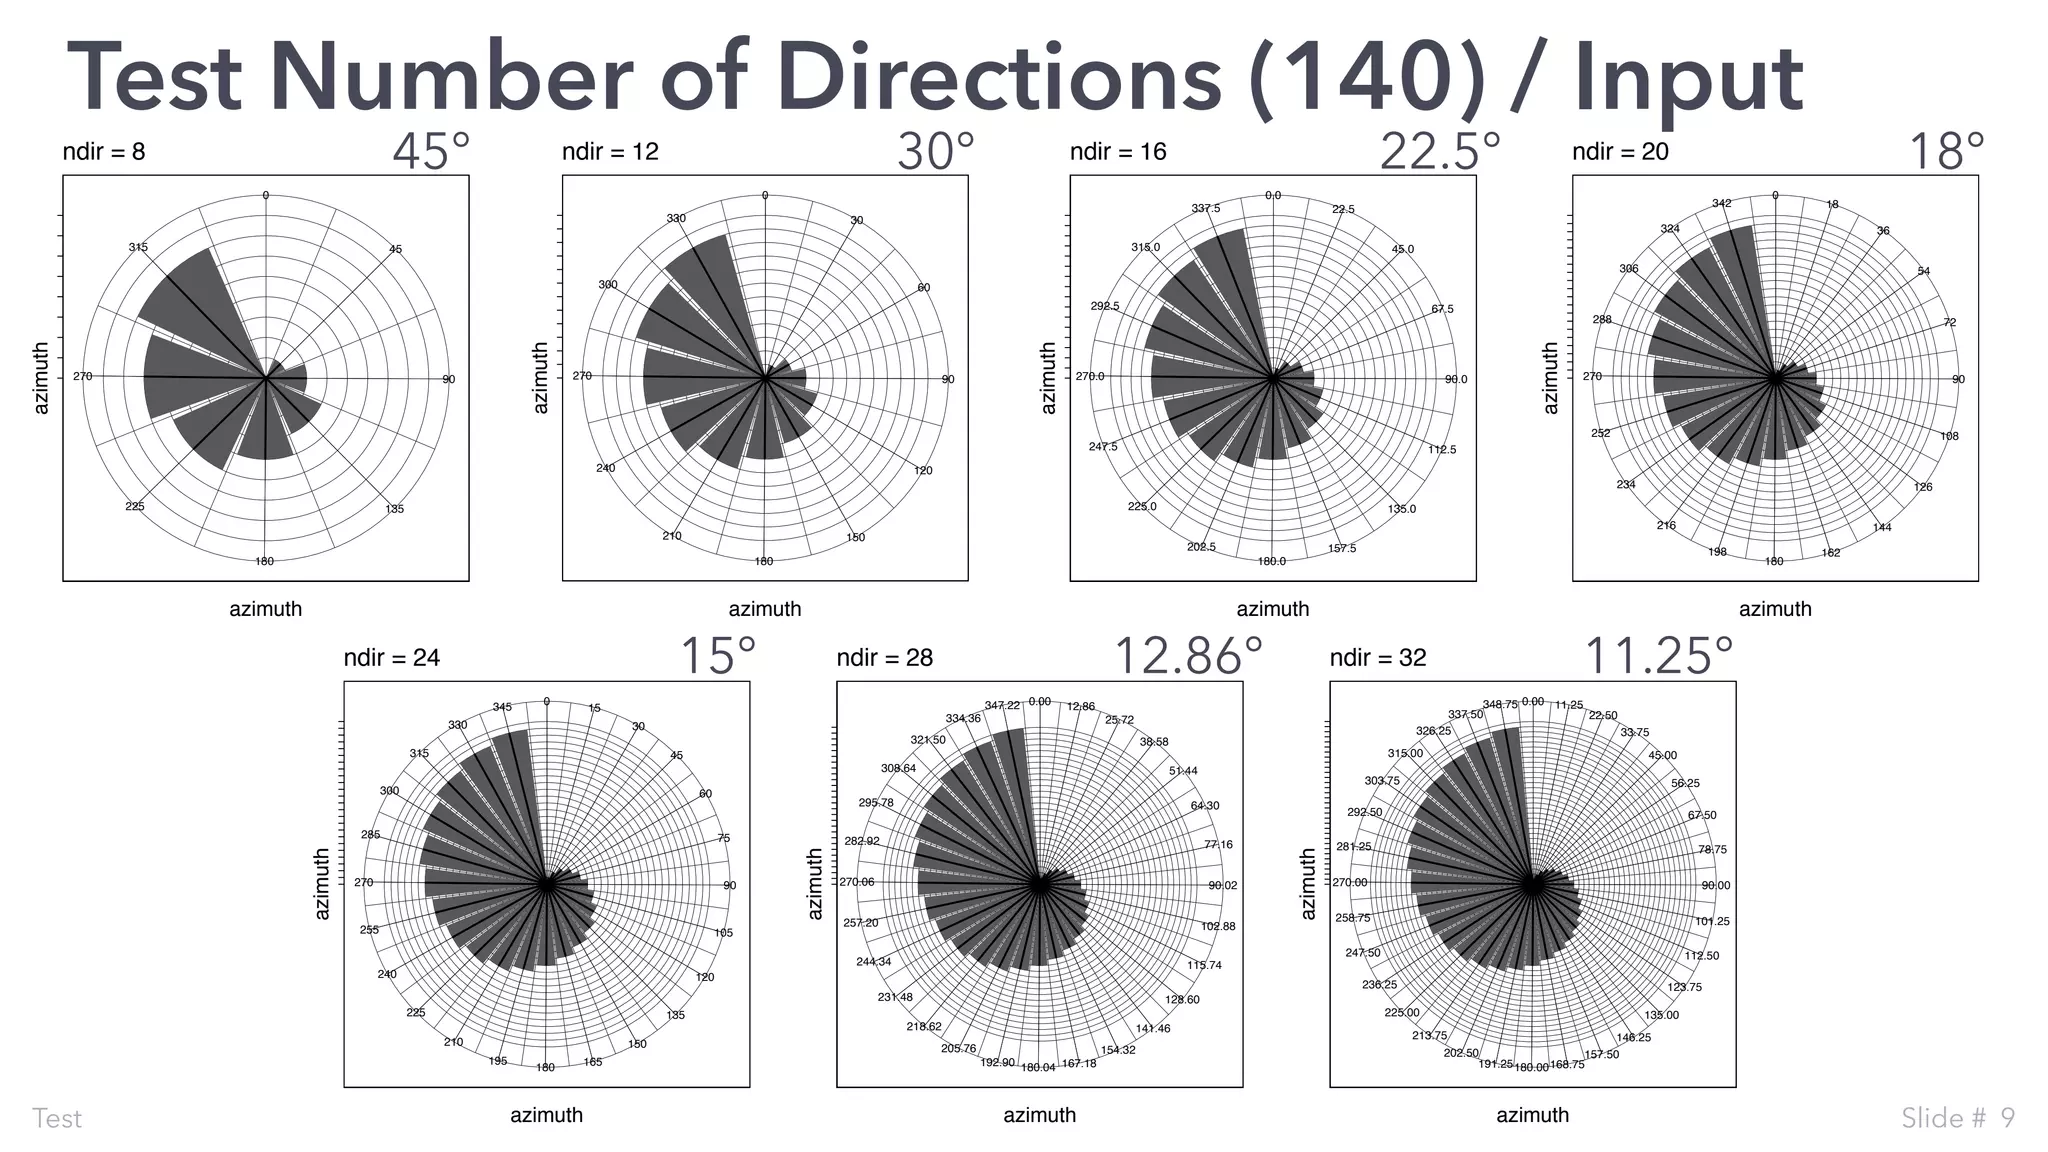
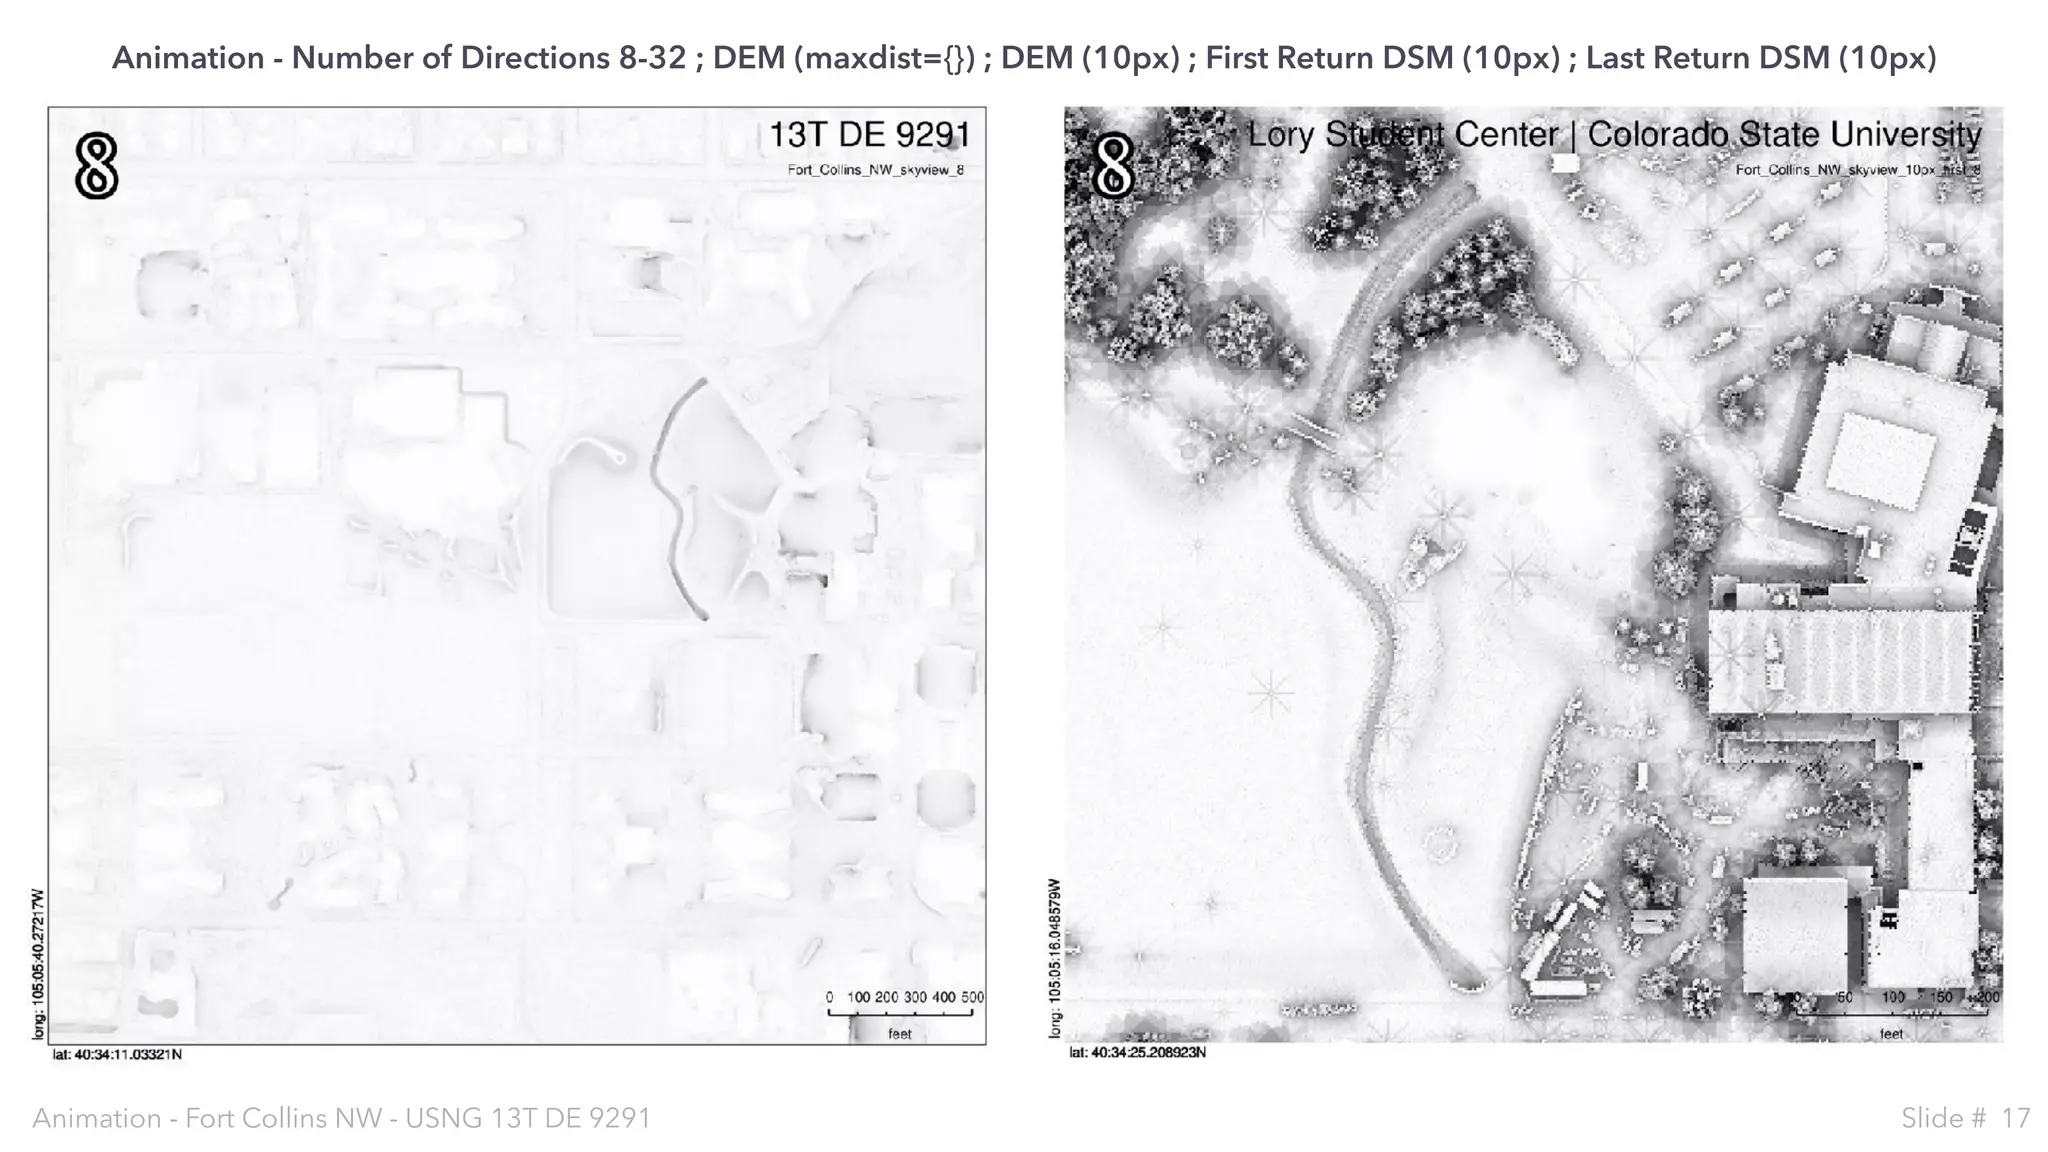
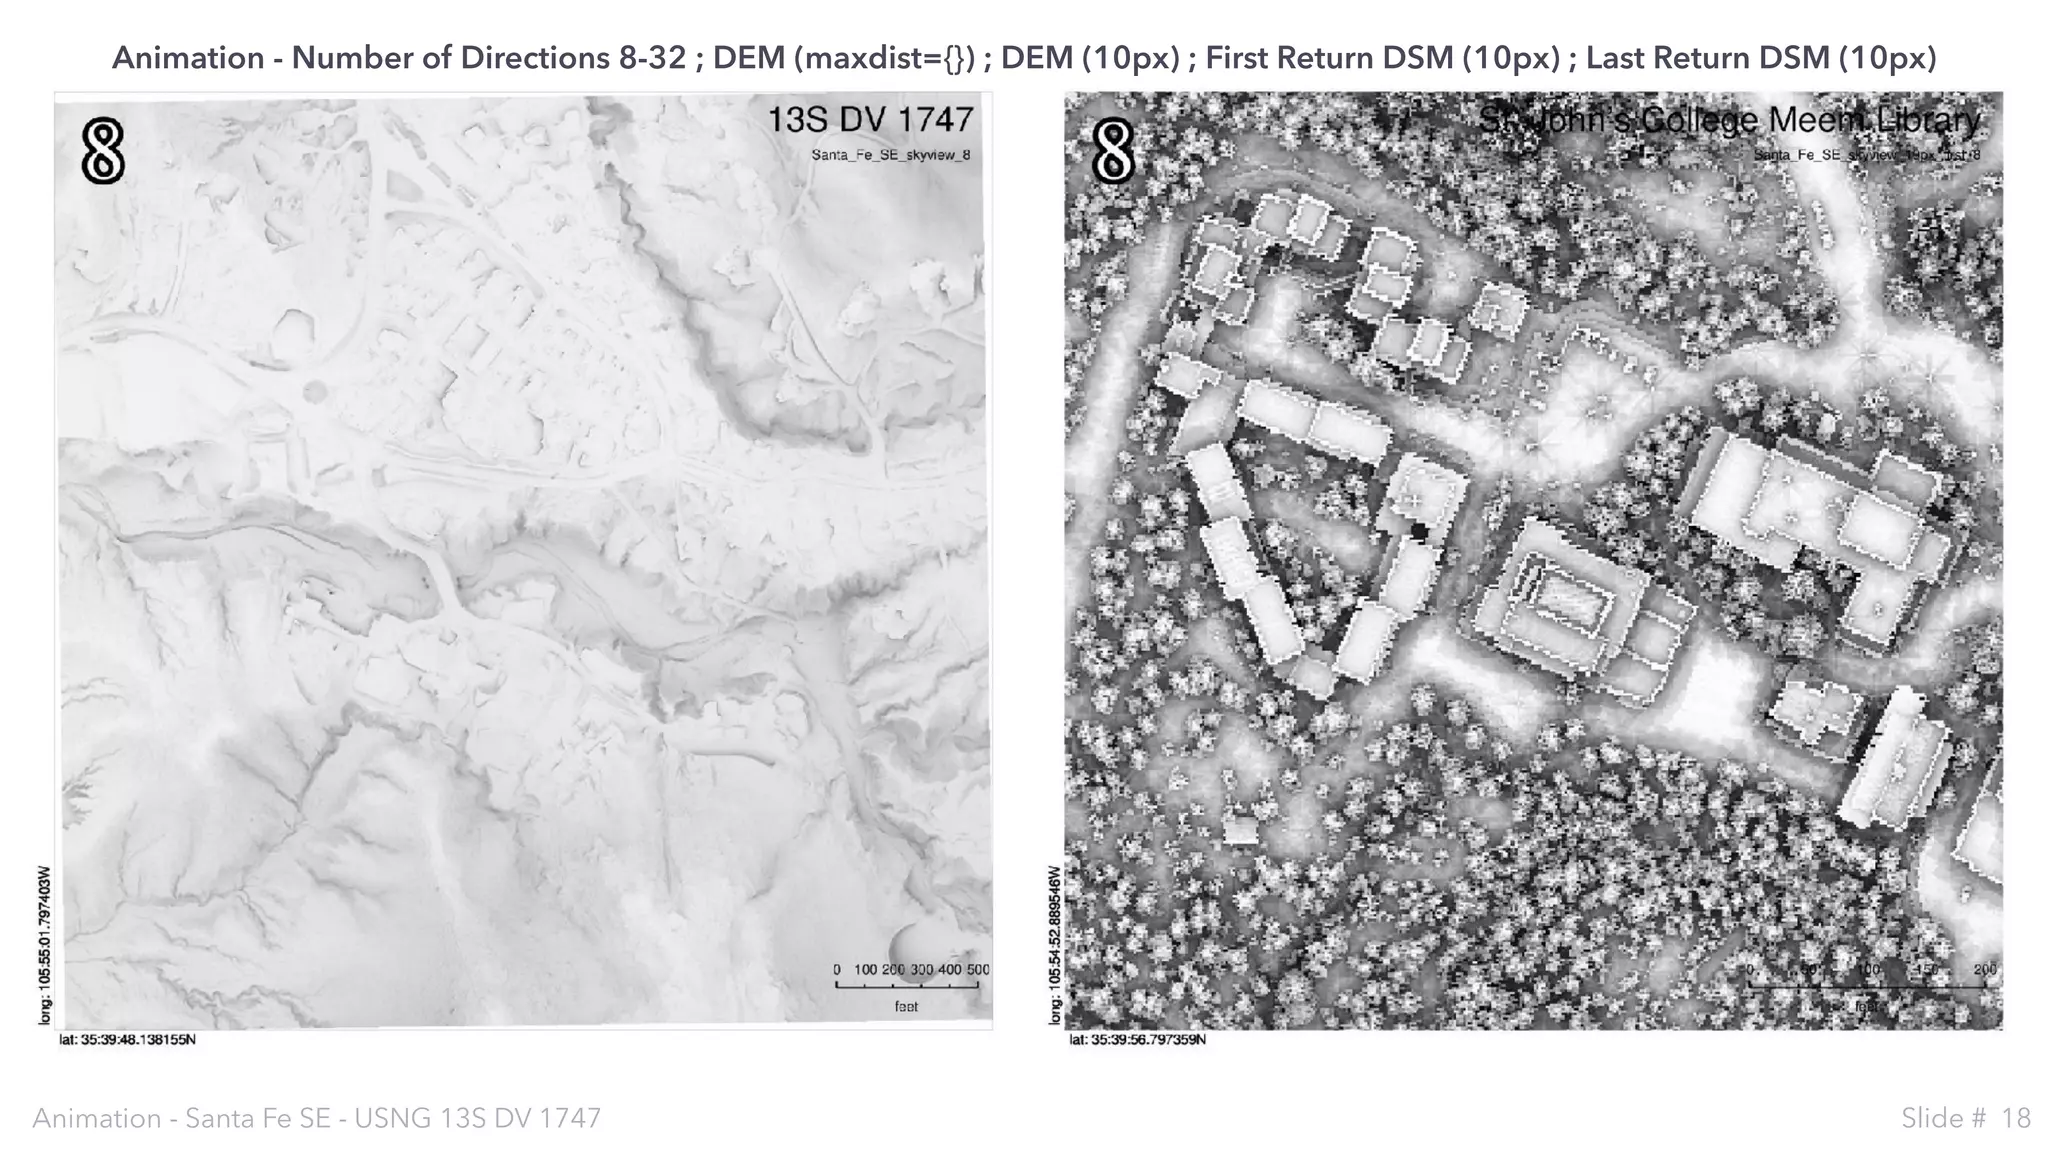
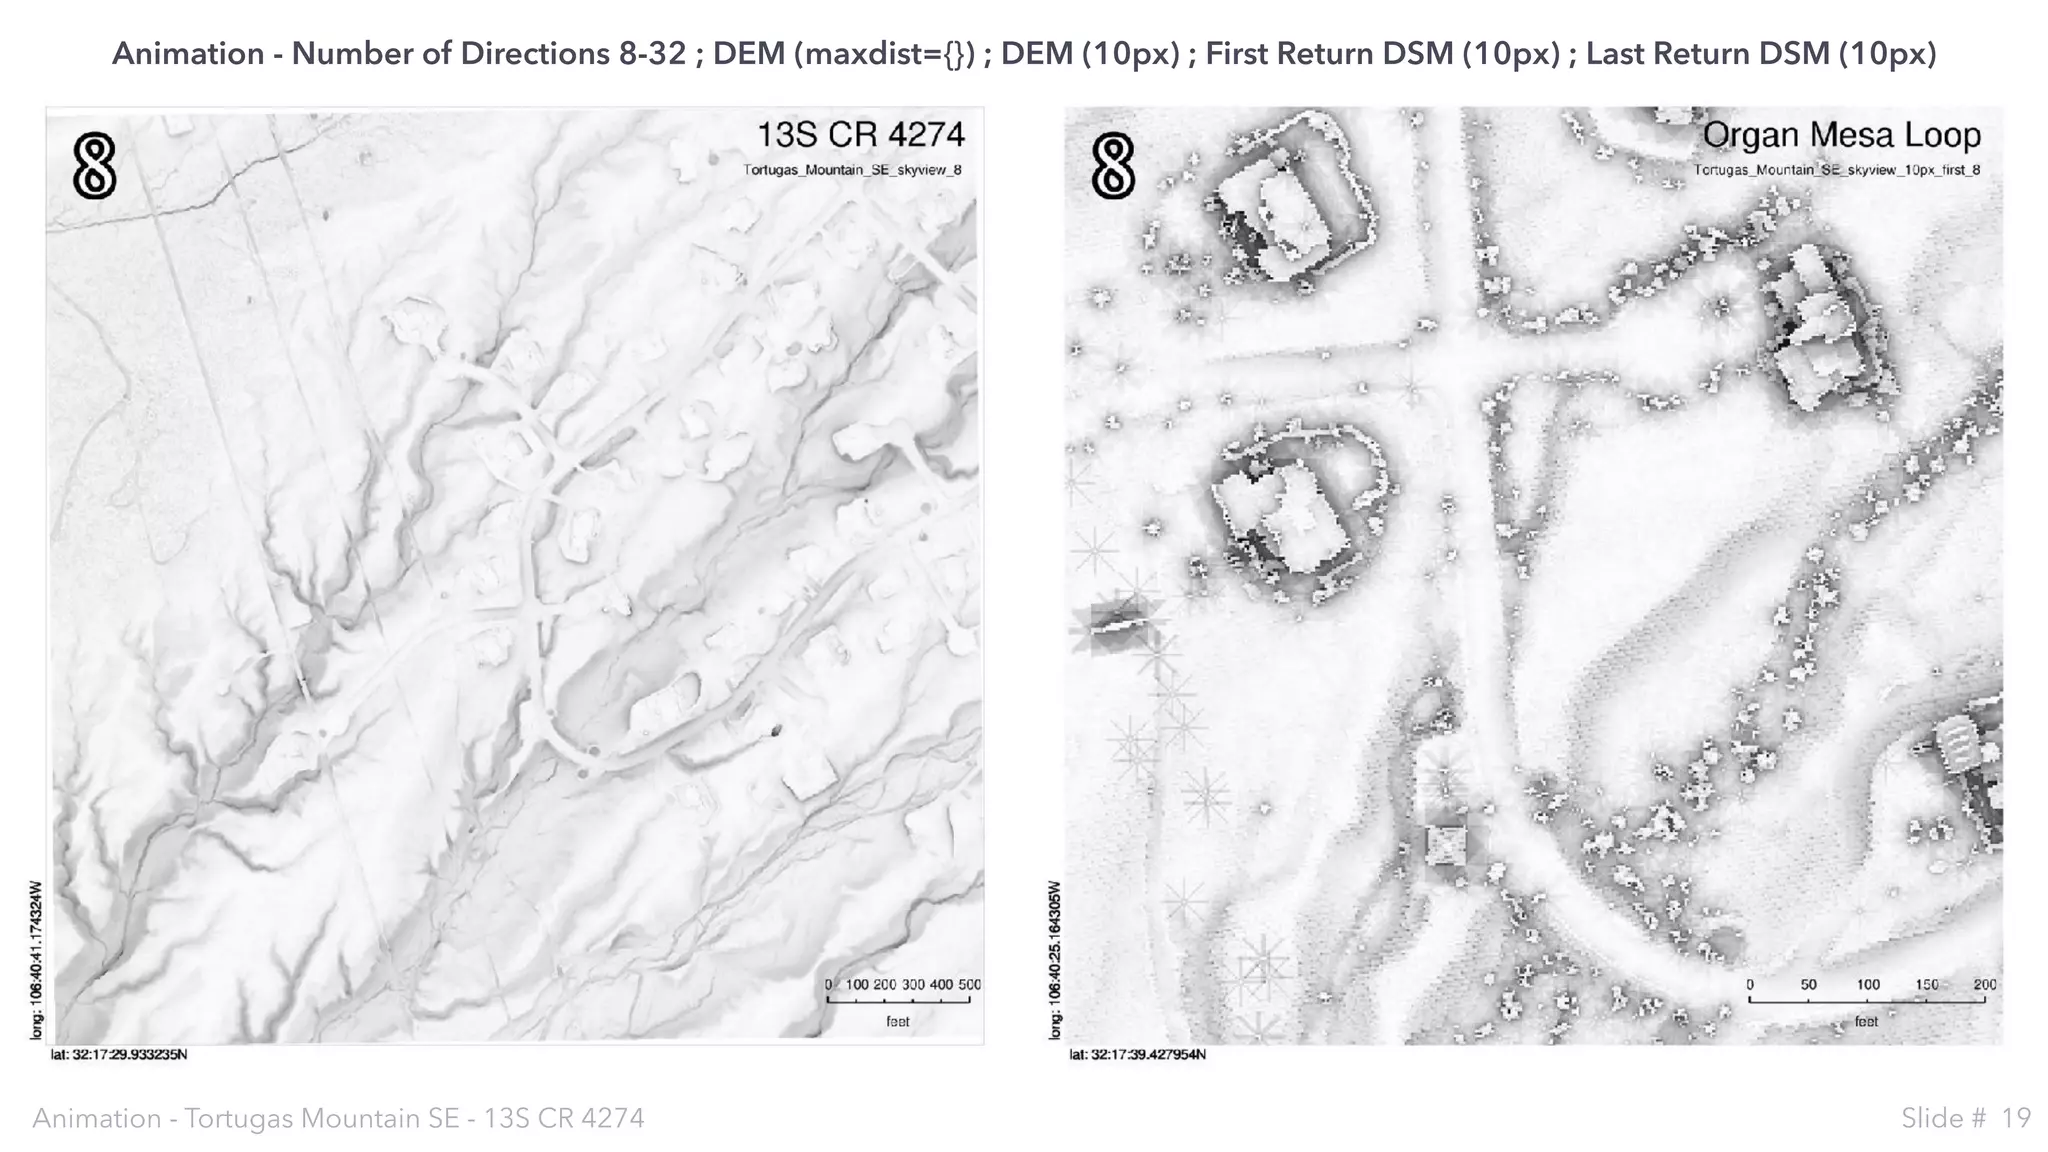
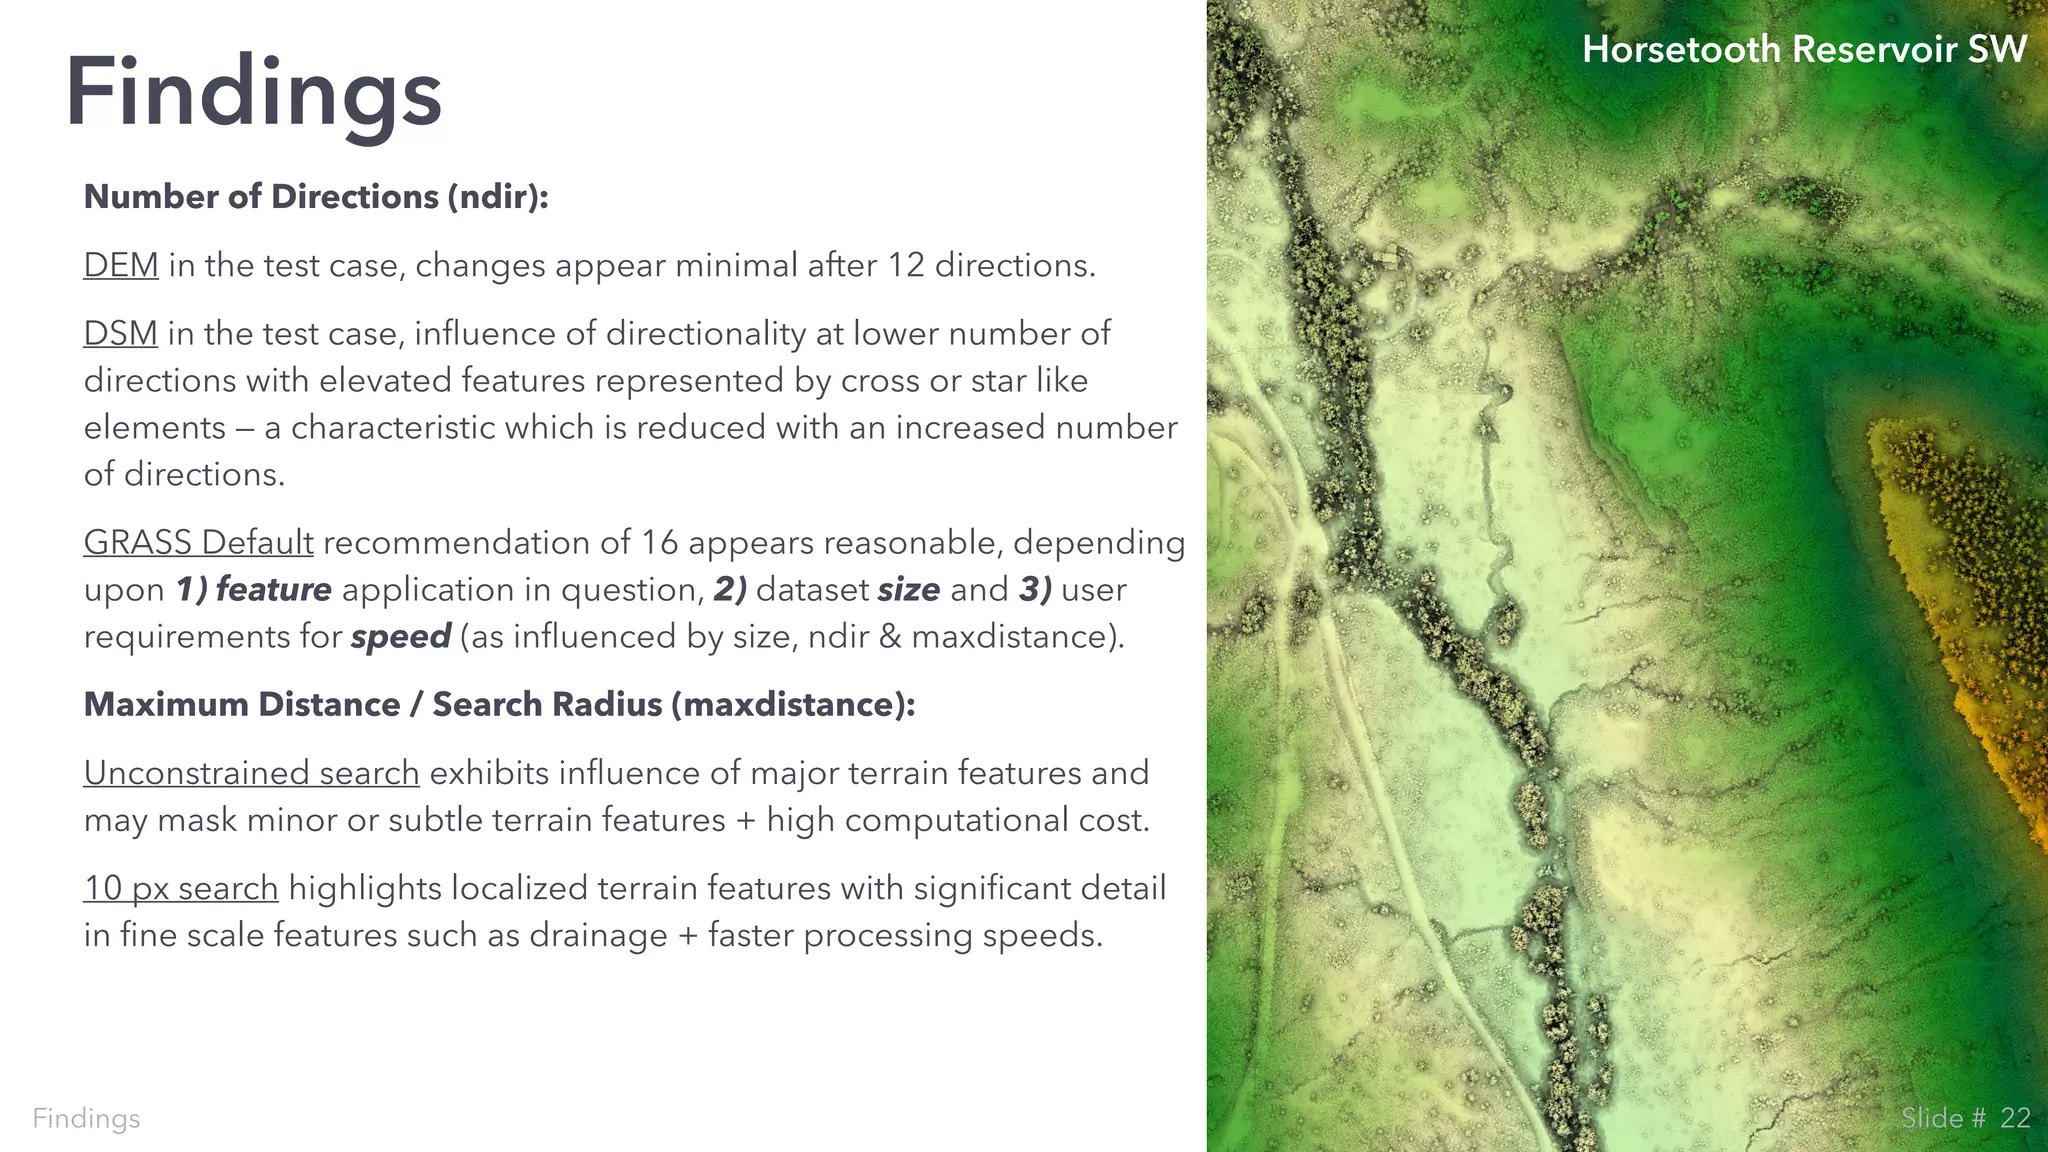
![Number of Directions:
Visualization: At least 8 directions and more than 32 search directions
bring no noticeable improvement. [2]
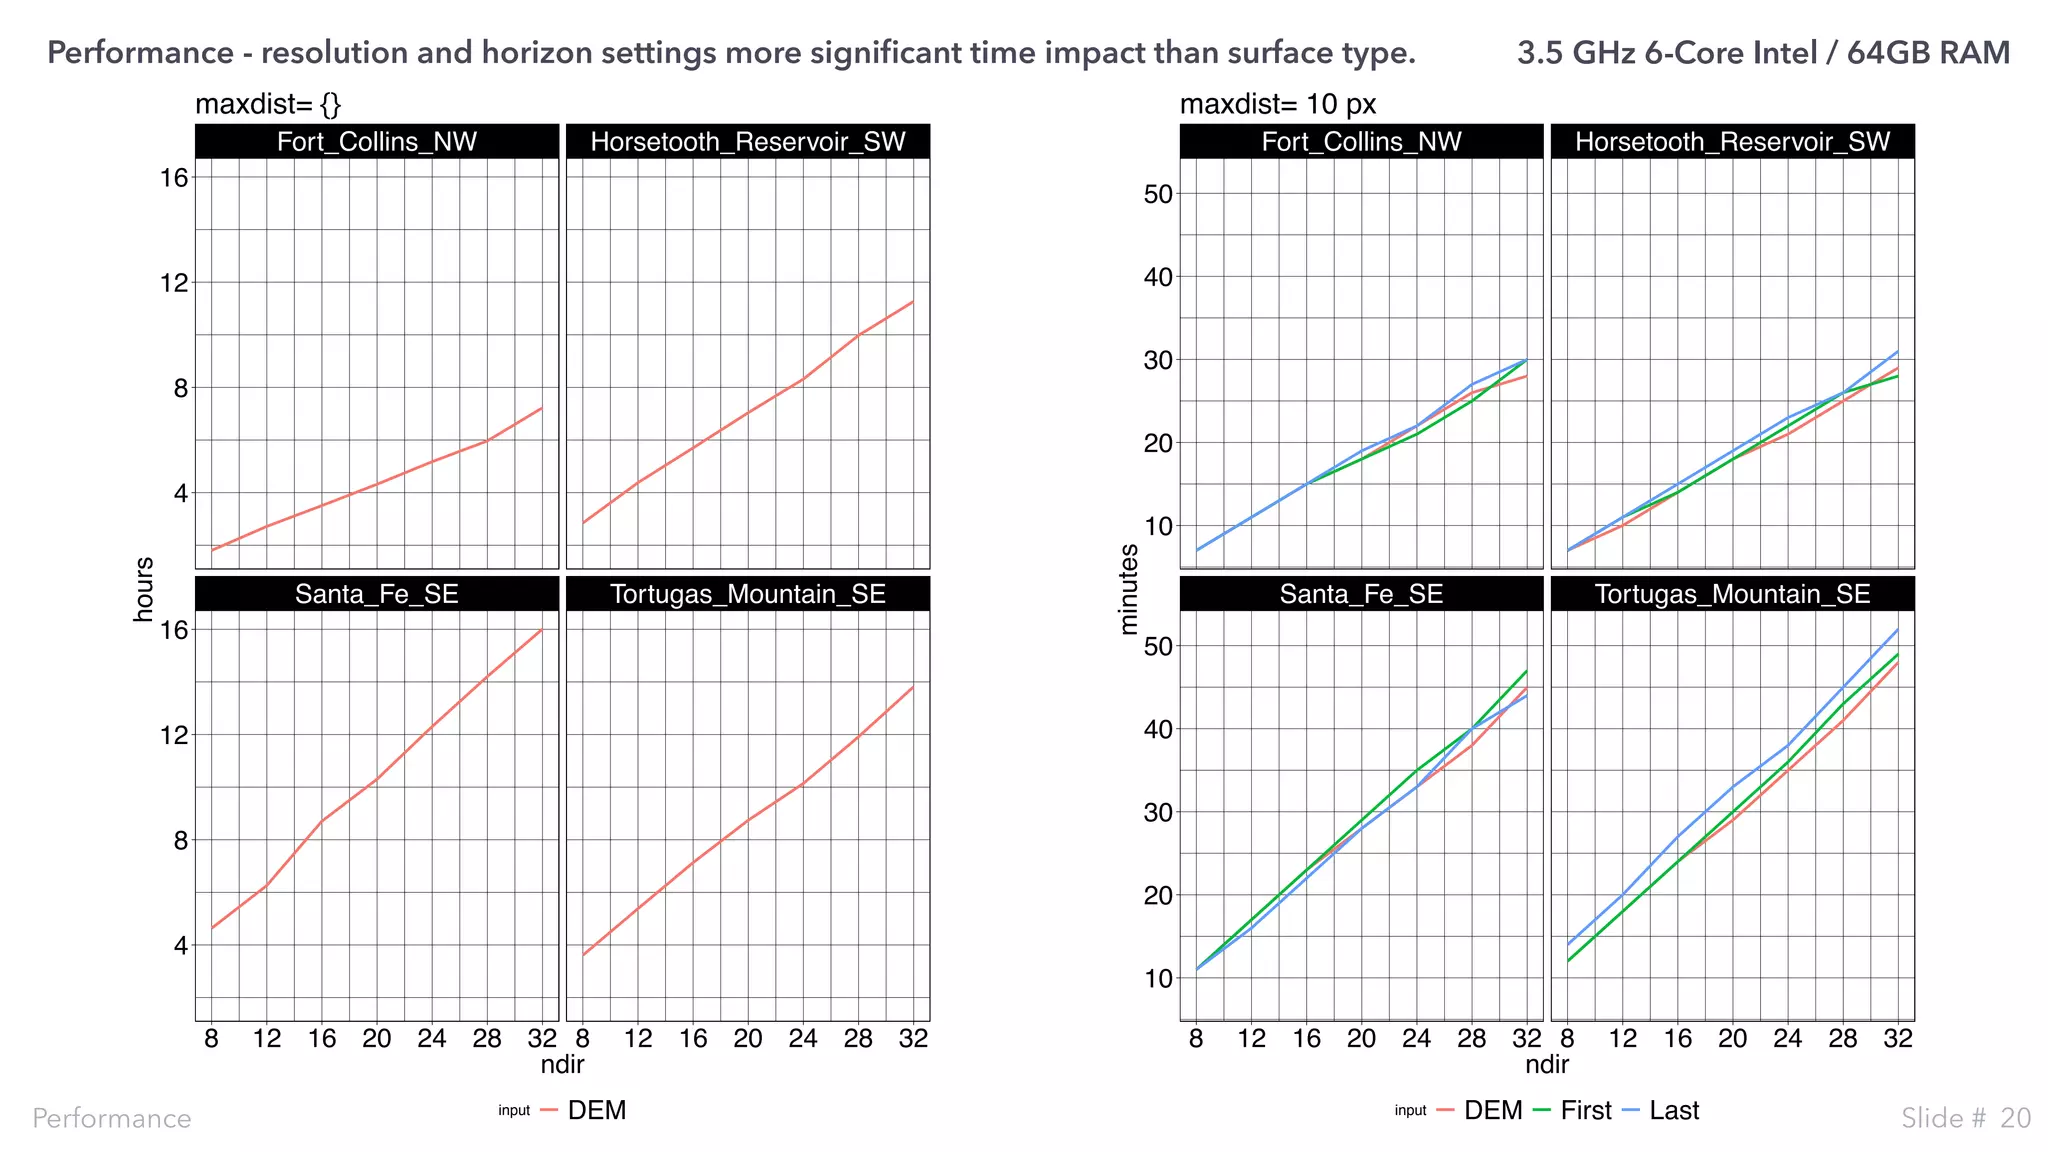
Maximum Search Radius:
Visualization: Consider the objective of the visualization & the size of
the objects of interest - between between 10 and 30 pixels good for
general purpose - greater than 50 pixels adds significant
computational expense. [2]
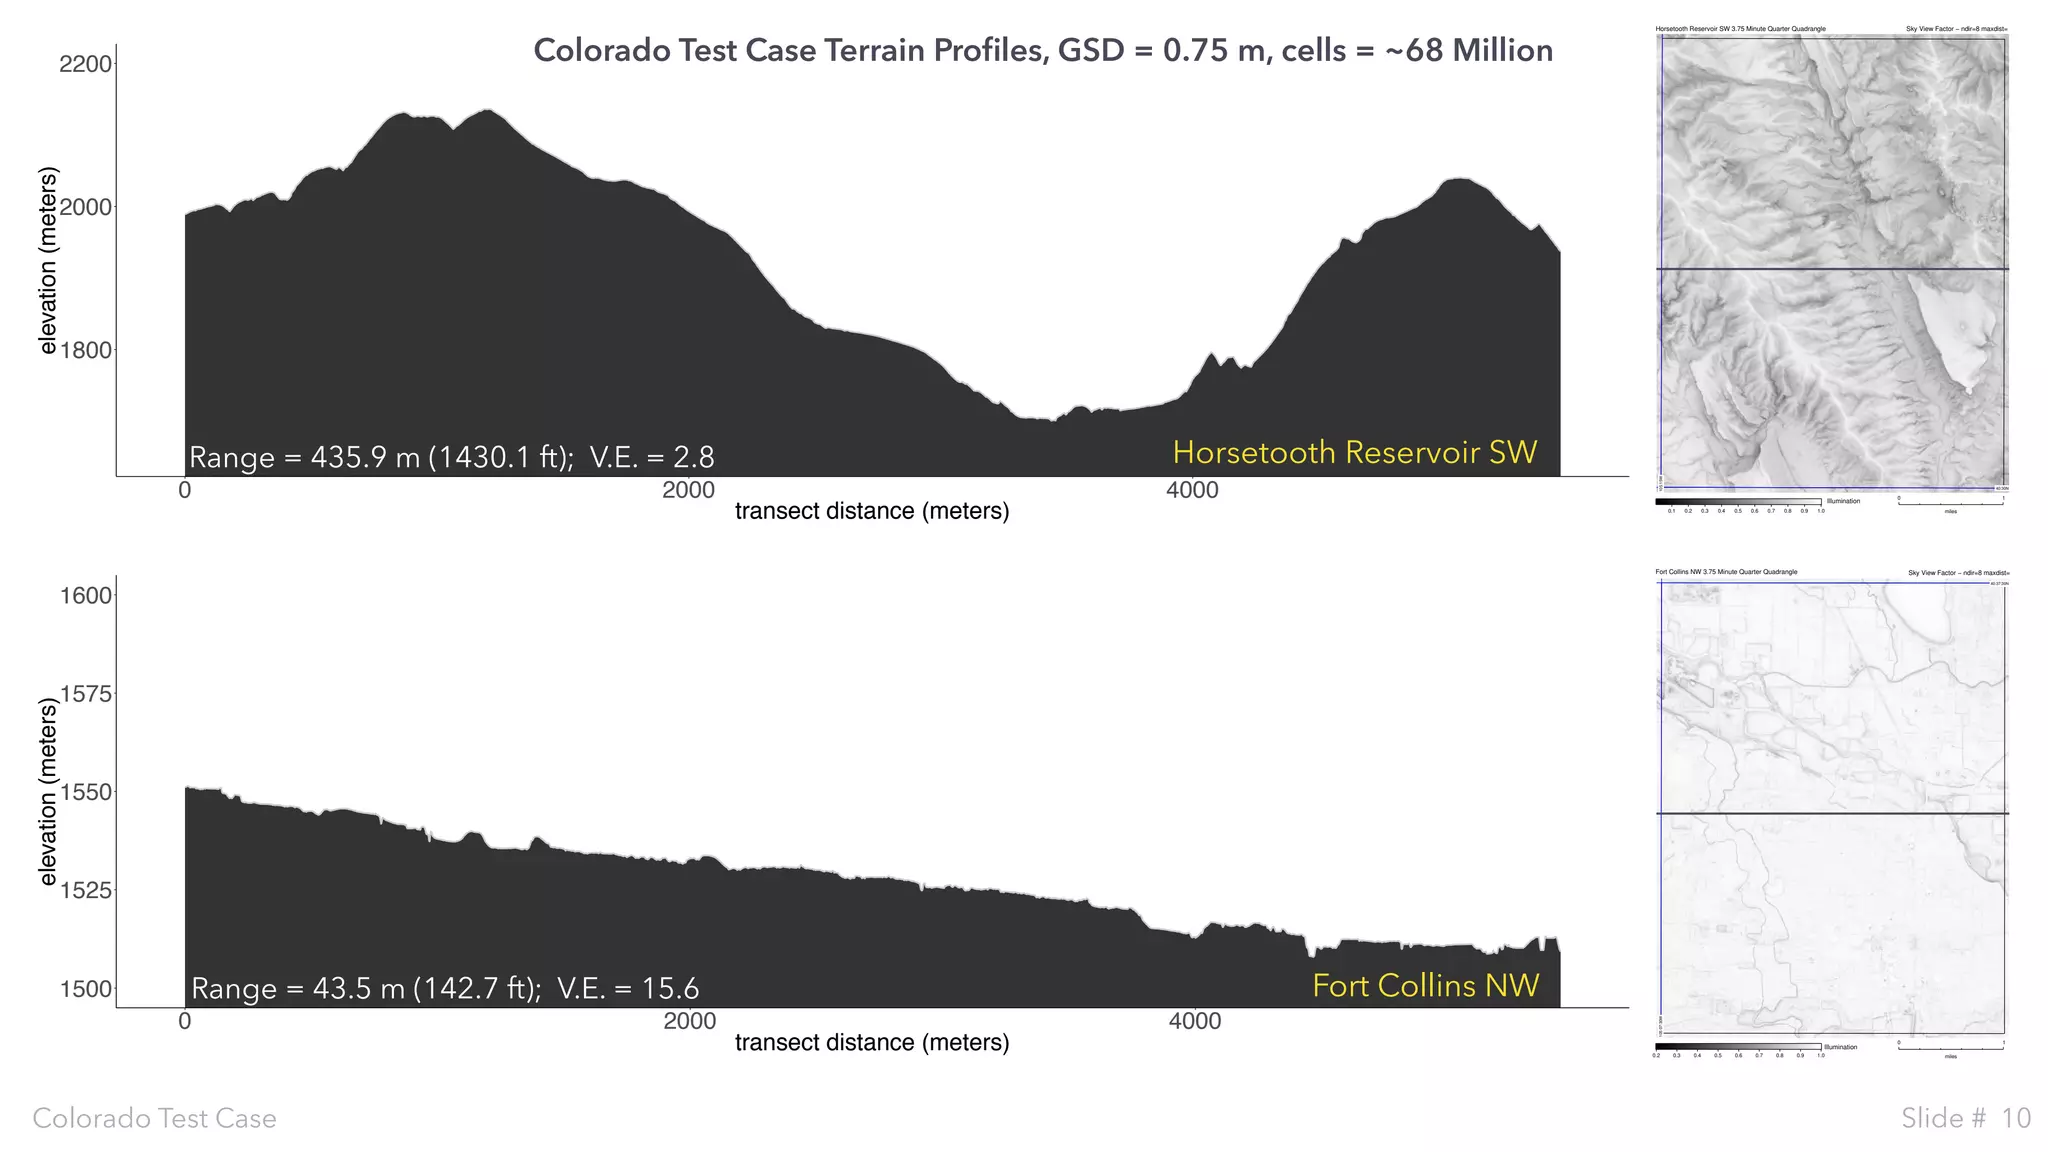
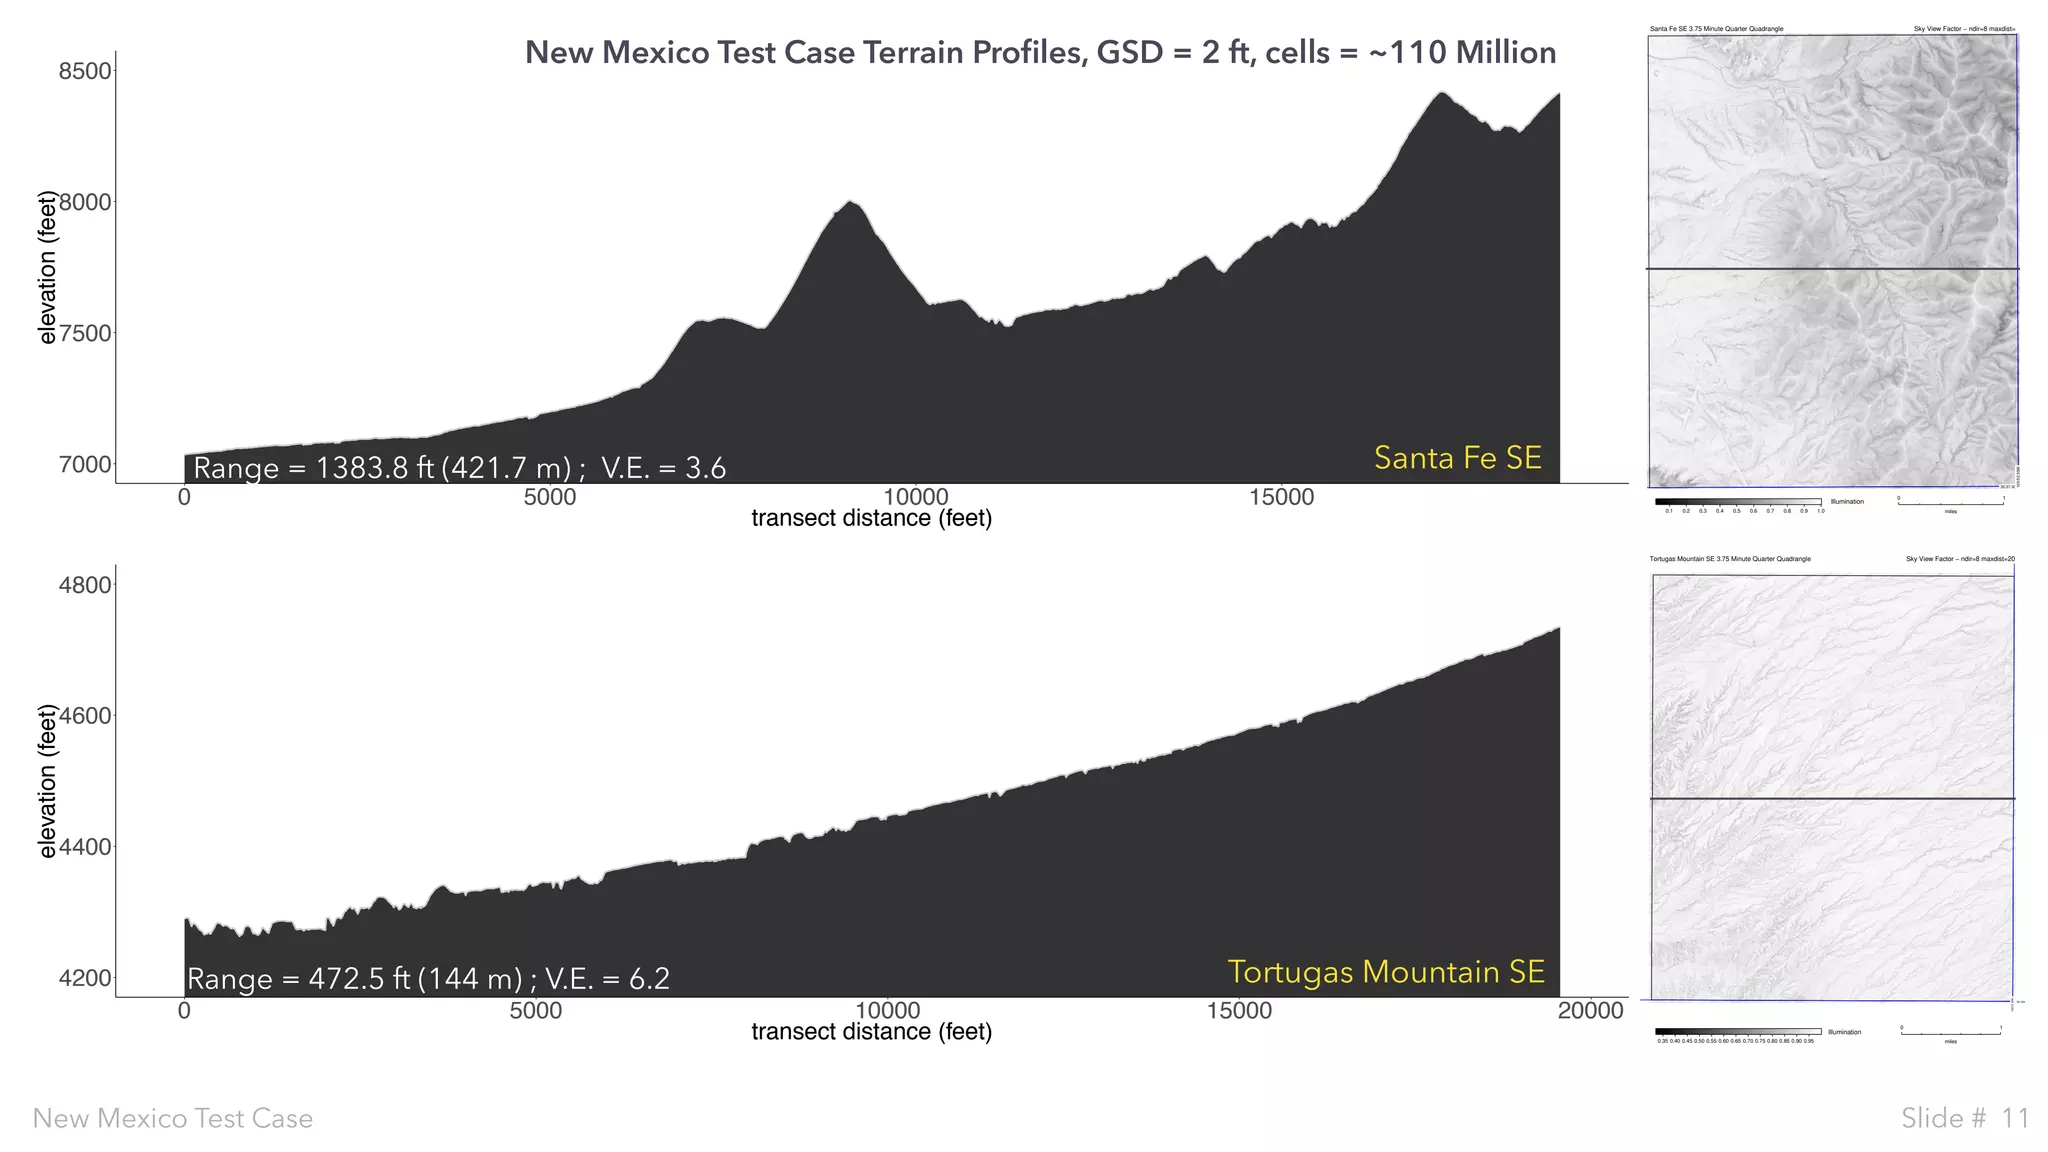
Data Set Size & Spatial Resolution:
Visualization: size of the dataset is currently the limiting factor [2]
SVF Considerations
SVF Considerations
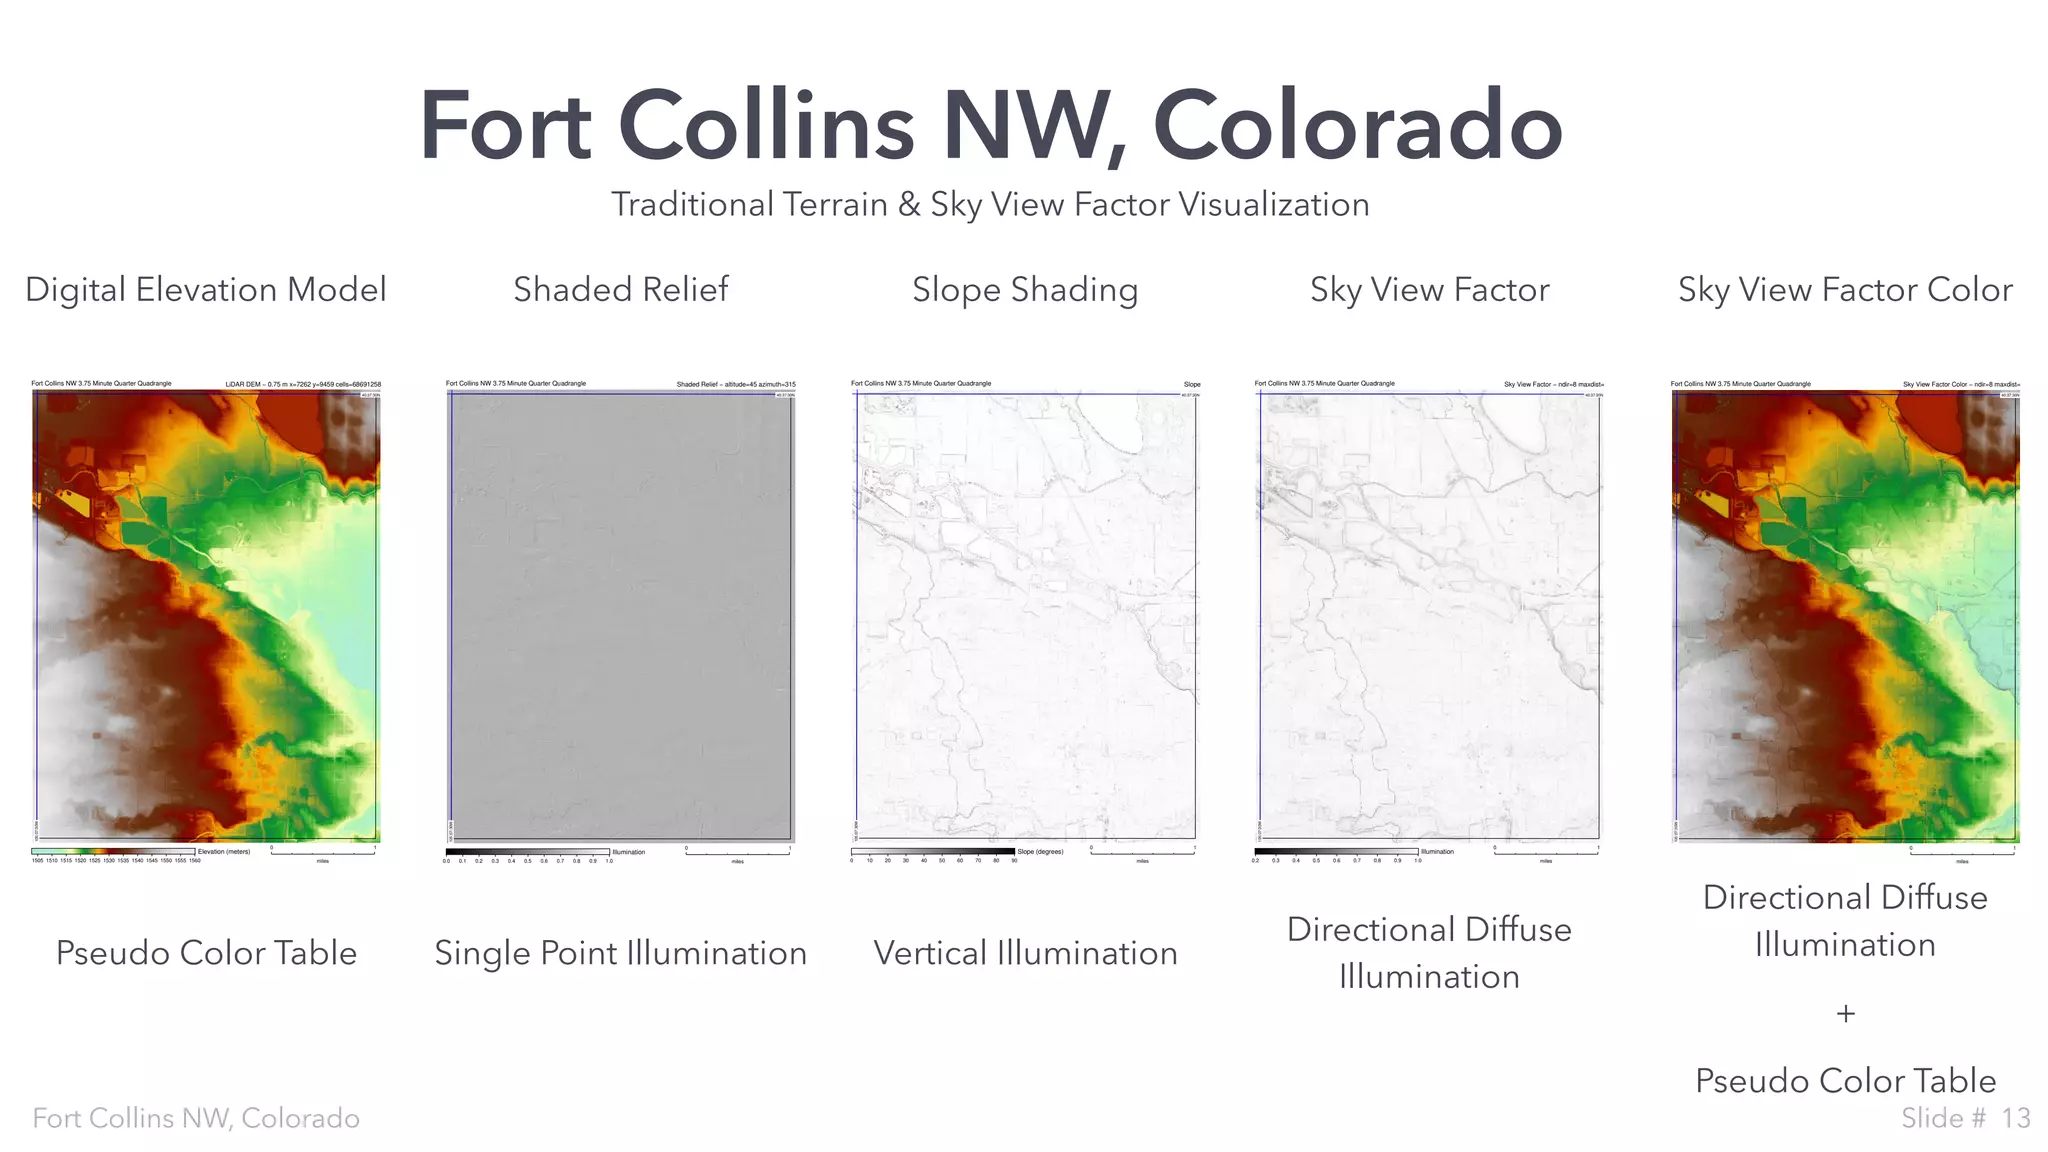
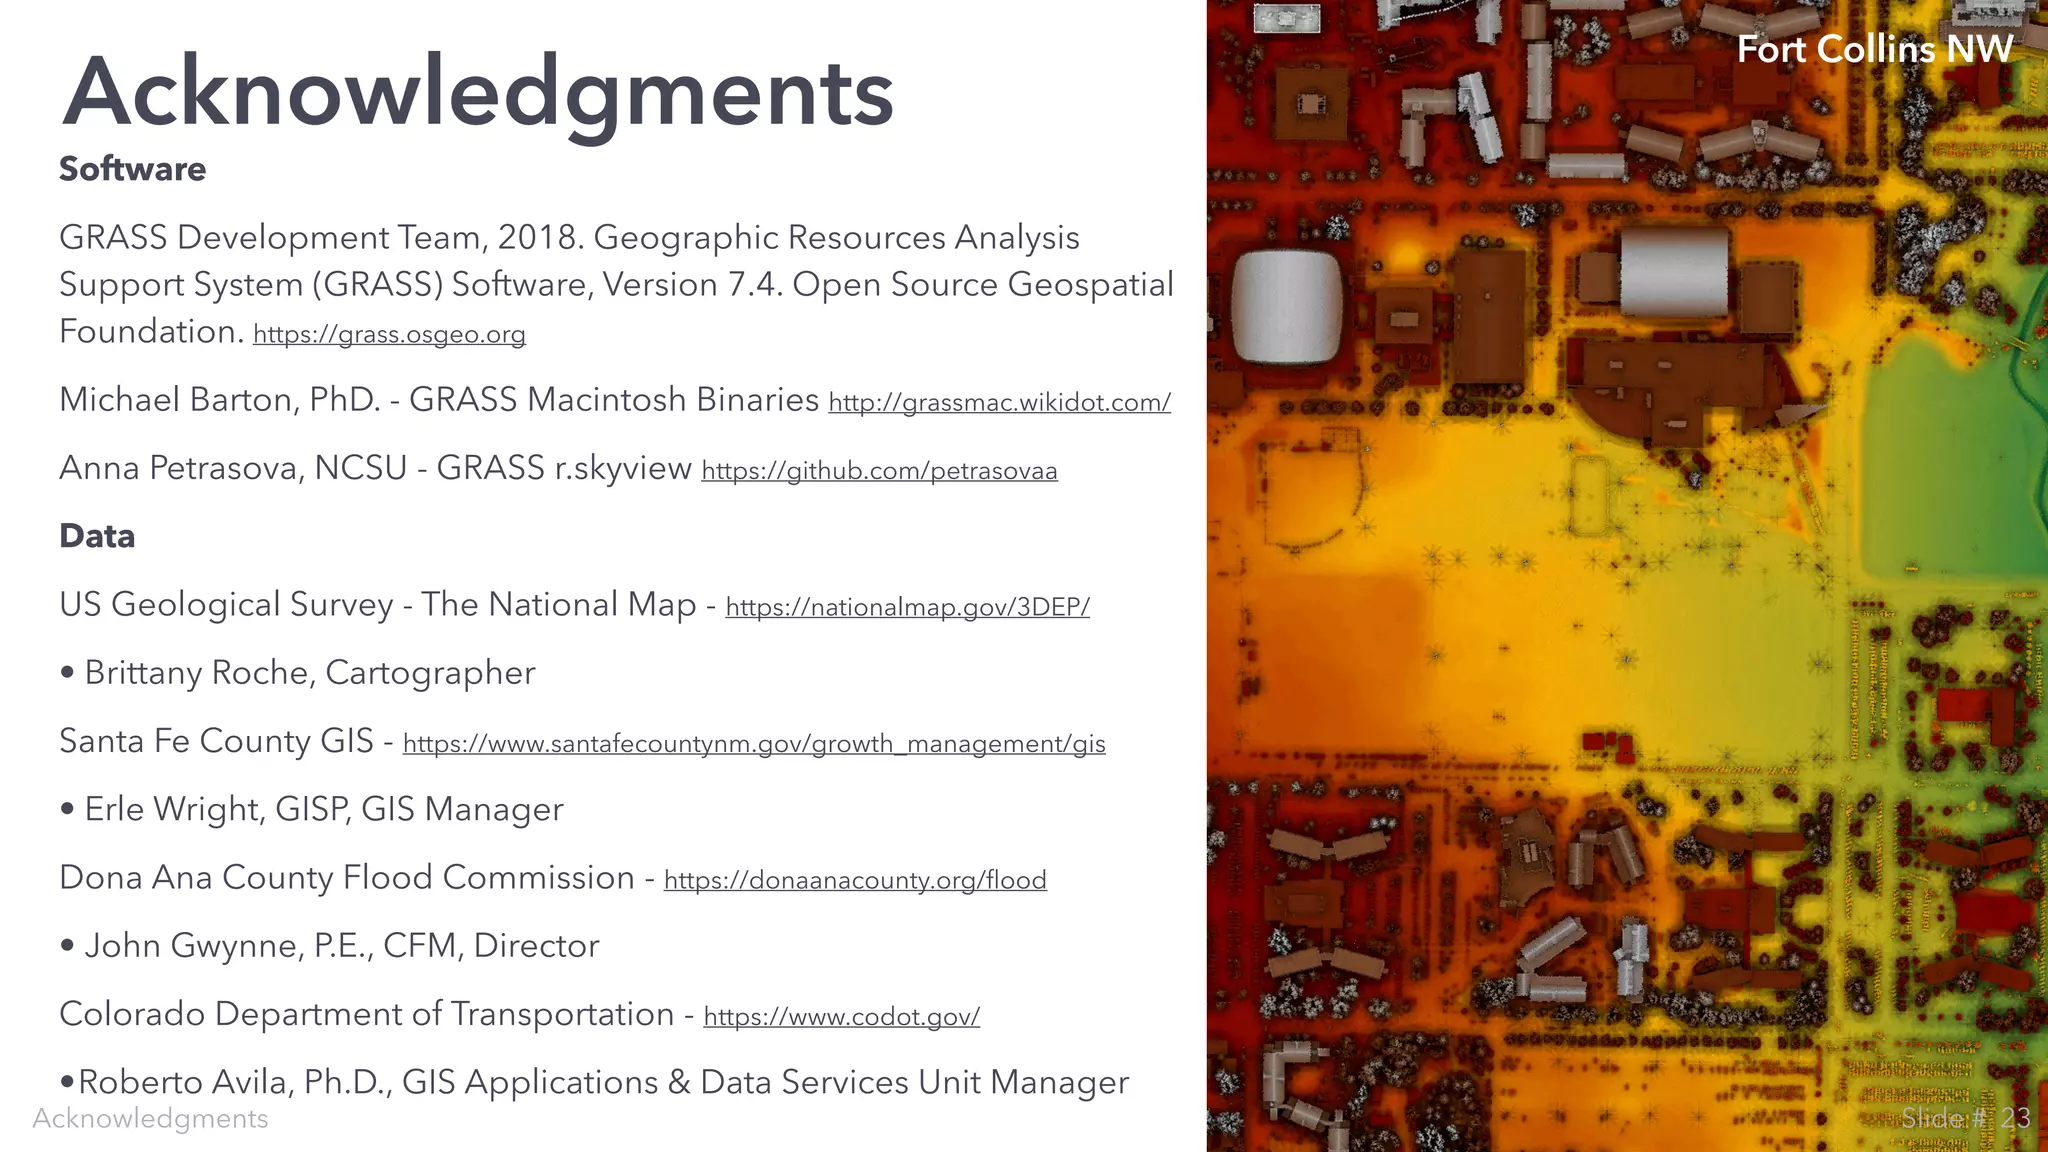
Fort Collins NW
4Slide #](https://image.slidesharecdn.com/grassgisstrikingterrainvisualizationsintherockiesdzur-181003005517/75/2018-GIS-in-Development-Grass-GIS-Striking-Terrain-Visualizations-in-the-Rockies-4-2048.jpg)

The document discusses a presentation on the use of GRASS GIS for terrain visualization in the Rocky Mountains, focusing on the Sky View Factor (SVF) as a technique for modeling visibility using digital elevation models. It covers implementations, parameters, performance case studies, and applications, particularly in the context of datasets from Colorado and New Mexico. Various slides detail the effectiveness of visualizations based on the number of directions and data set size, including specific examples and results from case studies.


