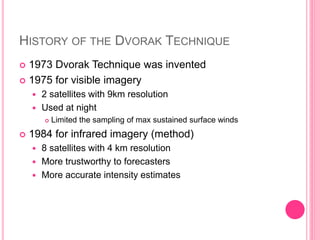
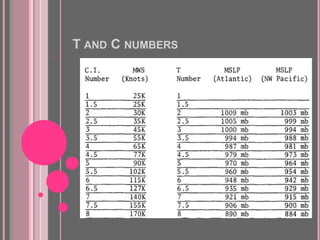
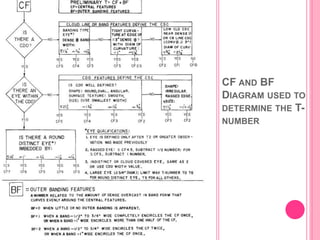
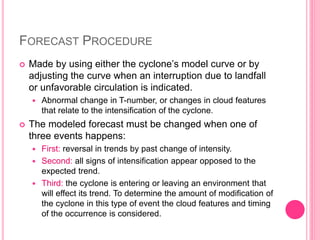
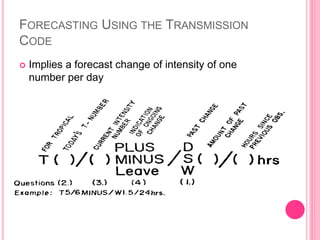
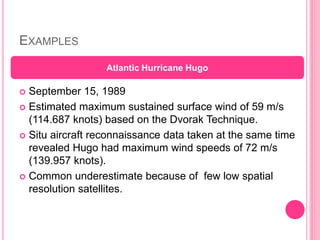
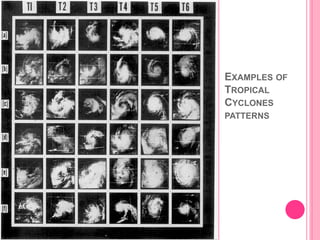
2. HISTORY OF THE DVORAK TECHNIQUE
1973 Dvorak Technique was invented
1975 for visible imagery
2 satellites with 9km resolution
Used at night
Limited the sampling of max sustained surface winds
1984 for infrared imagery (method)
8 satellites with 4 km resolution
More trustworthy to forecasters
More accurate intensity estimates
3. WHAT IS THE DVORAK TECHNIQUE?
A systematic procedure for determining the intensity
of tropical cyclones using satellite imagery
Objective: provide good estimates of the present
and future intensity of cyclones using satellite
imagery
Using procedures and rules which combine analysis of
satellite imagery with an ideal forecast for tropical
cyclone development.
4. T AND C.I. NUMBERS
T (Tropical) C.I. ( Current Intensity)
T numbers range from 1 to
8 (T1 to T8).
Describes tropical
disturbances ranging from
minimal signs of tropical
cyclone intensity (T1) to
maximum possible
intensity(T8). Relating to
minimum sea-level pressure
(MSLP).
The T numbers are used to
fit the cyclone to a curve of
a model or show removal
from a curve.
C.I. numbers range from 1 to
8.
Relates directly to the
intensity in terms of the max
wind speed (MSP).
Not directly related to cloud
features.
Two factors affecting the C.I.
number:
The surveyed delay in the
reduction of MSP after cloud
features show weakening.
The climax of the cyclones
winds between satellite
observations.
7. ESTIMATING CYCLONE INTENSITY
Two sets of clouds are analyzed to estimate the
cyclone intensity:
First set: Central features, outer banding features, and
vertical depth of clouds comprising these features.
Analyzing the intensity is done in three stages:
1: allow modeled estimate of the cyclone’s intensity.
2&3: use cloud patterns and feature measurements to prove
or adjust the modeled explanation.
Second set: determines if a forecast along the cyclones
curve is to be used for the 24 hour forecast.
8. CENTRAL FEATURES, OUTER BANDING FEATURES,
AND VERTICAL CLOUD DEPTH PARAMETER
Appear within the broad curve
of the comma band
Surround or cover the cloud
system center
The intensity estimate
depends on the size, shape,
and definition of CF also the
amount of dense overcast
with CF
Only the part of the
comma cloud band that
is overcast
Curves evenly around
the central features
Central Features (CF)
Outer Banding Features
(BF)
Vertical cloud depth is the depth of
the clouds in the CF and BF.
9. ANALYZING THE INTENSITY OF A CYCLONE
First Stage: Approximate judgment on changes
between yesterday’s and today’s cloud features
related to cyclone intensity
The CF, BF, and vertical depth parameters are
inspected separately determining the recent intensity
change
Using this, the T-number from yesterday, and the
modeled curve gives an estimate of intensity for present
and future of the cyclone
This estimate is then modified up or down due to a
change in the environment of the cyclone that has
occurred in the past 24 hours.
10. ANALYZING THE INTENSITY OF A CYCLONE
Second Stage: Considers overall cloud pattern
The pattern of the cyclone is compared to the common
tropical cyclone patterns
Once the patterns are compared, the intensity can be
either lowered or raised.
The T-number corresponding to the pattern is fixed when
cloud features are significant in size or depth.
Third Stage: Component features examined to determine
if they agree with intensity in first stage.
Calibrated analysis made for the cloud features studeied
qualitatively in the first stage.
Using the flow diagram
11. CF AND BF
DIAGRAM USED TO
DETERMINE THE T-NUMBER
12. FORECAST PROCEDURE
Made by using either the cyclone’s model curve or by
adjusting the curve when an interruption due to landfall
or unfavorable circulation is indicated.
Abnormal change in T-number, or changes in cloud features
that relate to the intensification of the cyclone.
The modeled forecast must be changed when one of
three events happens:
First: reversal in trends by past change of intensity.
Second: all signs of intensification appear opposed to the
expected trend.
Third: the cyclone is entering or leaving an environment that
will effect its trend. To determine the amount of modification of
the cyclone in this type of event the cloud features and timing
of the occurrence is considered.
13. FORECASTING USING THE TRANSMISSION
CODE
Implies a forecast change of intensity of one
number per day
14. RULES AND PROCEDURES
1. Locate the cloud system center (CSC)
2. Recognize initial development
3. Determine past change of intensity
4. Determine today’s T-number
5. Determine the current intensity number(C.I.)
6. Determine the cyclone’s modeled curve
7. Determine the forecast C.I. number
8. Analyze, analyze, analyze
15. EXAMPLES
Atlantic Hurricane Hugo
September 15, 1989
Estimated maximum sustained surface wind of 59 m/s
(114.687 knots) based on the Dvorak Technique.
Situ aircraft reconnaissance data taken at the same time
revealed Hugo had maximum wind speeds of 72 m/s
(139.957 knots).
Common underestimate because of few low spatial
resolution satellites.
16. PREVIOUSLY
UNRECOGNIZED CAT 4
OR 5 TROPICAL
CYCLONES
November 23, 1978
May 8, 1979
November 7, 1982
November 13, 1984
November 8, 1989
17. HURRICANE ANITA 1977
Two Visible satellite images
taken for 5 days about 6 hours
apart.