Download to read offline


![• Uses gating mechanisms to solve vanishing gradient.
• ht is obtained based on input xt as follows:
ft = σ(Wf [ht−1; xt] + bf ),
it = σ(Wi [ht−1; xt] + bi ),
ot = σ(Wo[ht−1; xt] + bo),
st = ft](https://image.slidesharecdn.com/presentationtochineseuniversityofpetroleum-31062021-210605203704/75/Dengue-Vector-Population-Forecasting-Using-Multisource-Earth-Observation-Products-and-Recurrent-Neural-Networks-Presented-at-a-seminar-to-students-of-the-Chinese-University-of-Petroleum-31-06-2021-14-2048.jpg)
![tanh(Ws[ht−1; xt] + bs),
ht = ot](https://image.slidesharecdn.com/presentationtochineseuniversityofpetroleum-31062021-210605203704/75/Dengue-Vector-Population-Forecasting-Using-Multisource-Earth-Observation-Products-and-Recurrent-Neural-Networks-Presented-at-a-seminar-to-students-of-the-Chinese-University-of-Petroleum-31-06-2021-16-2048.jpg)
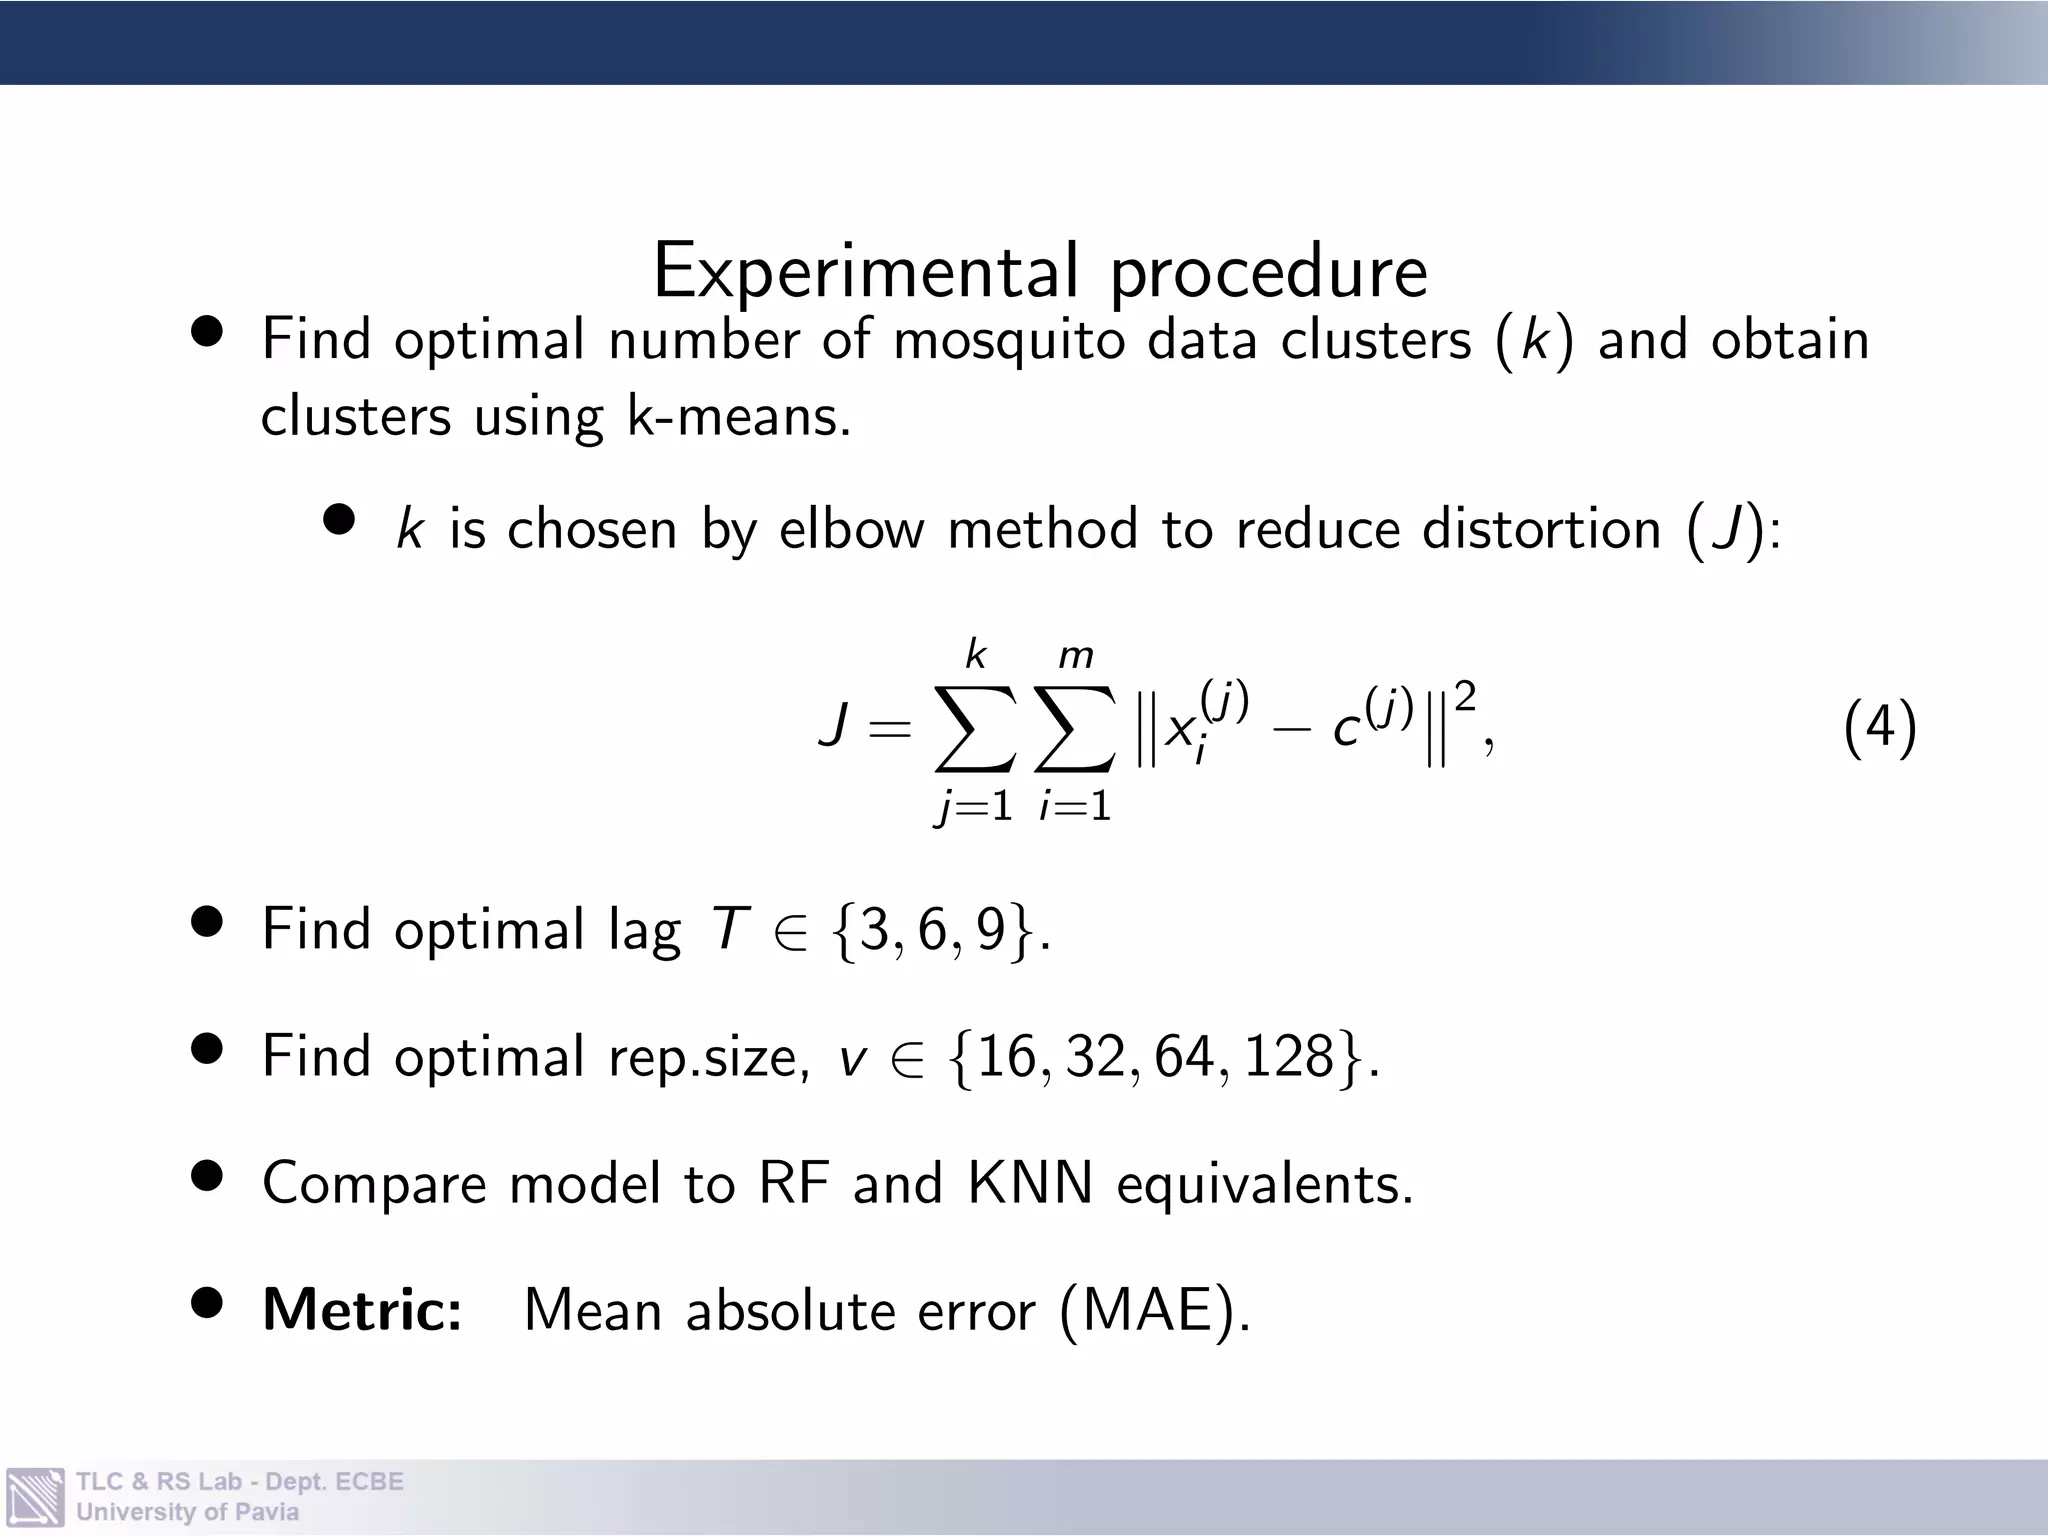
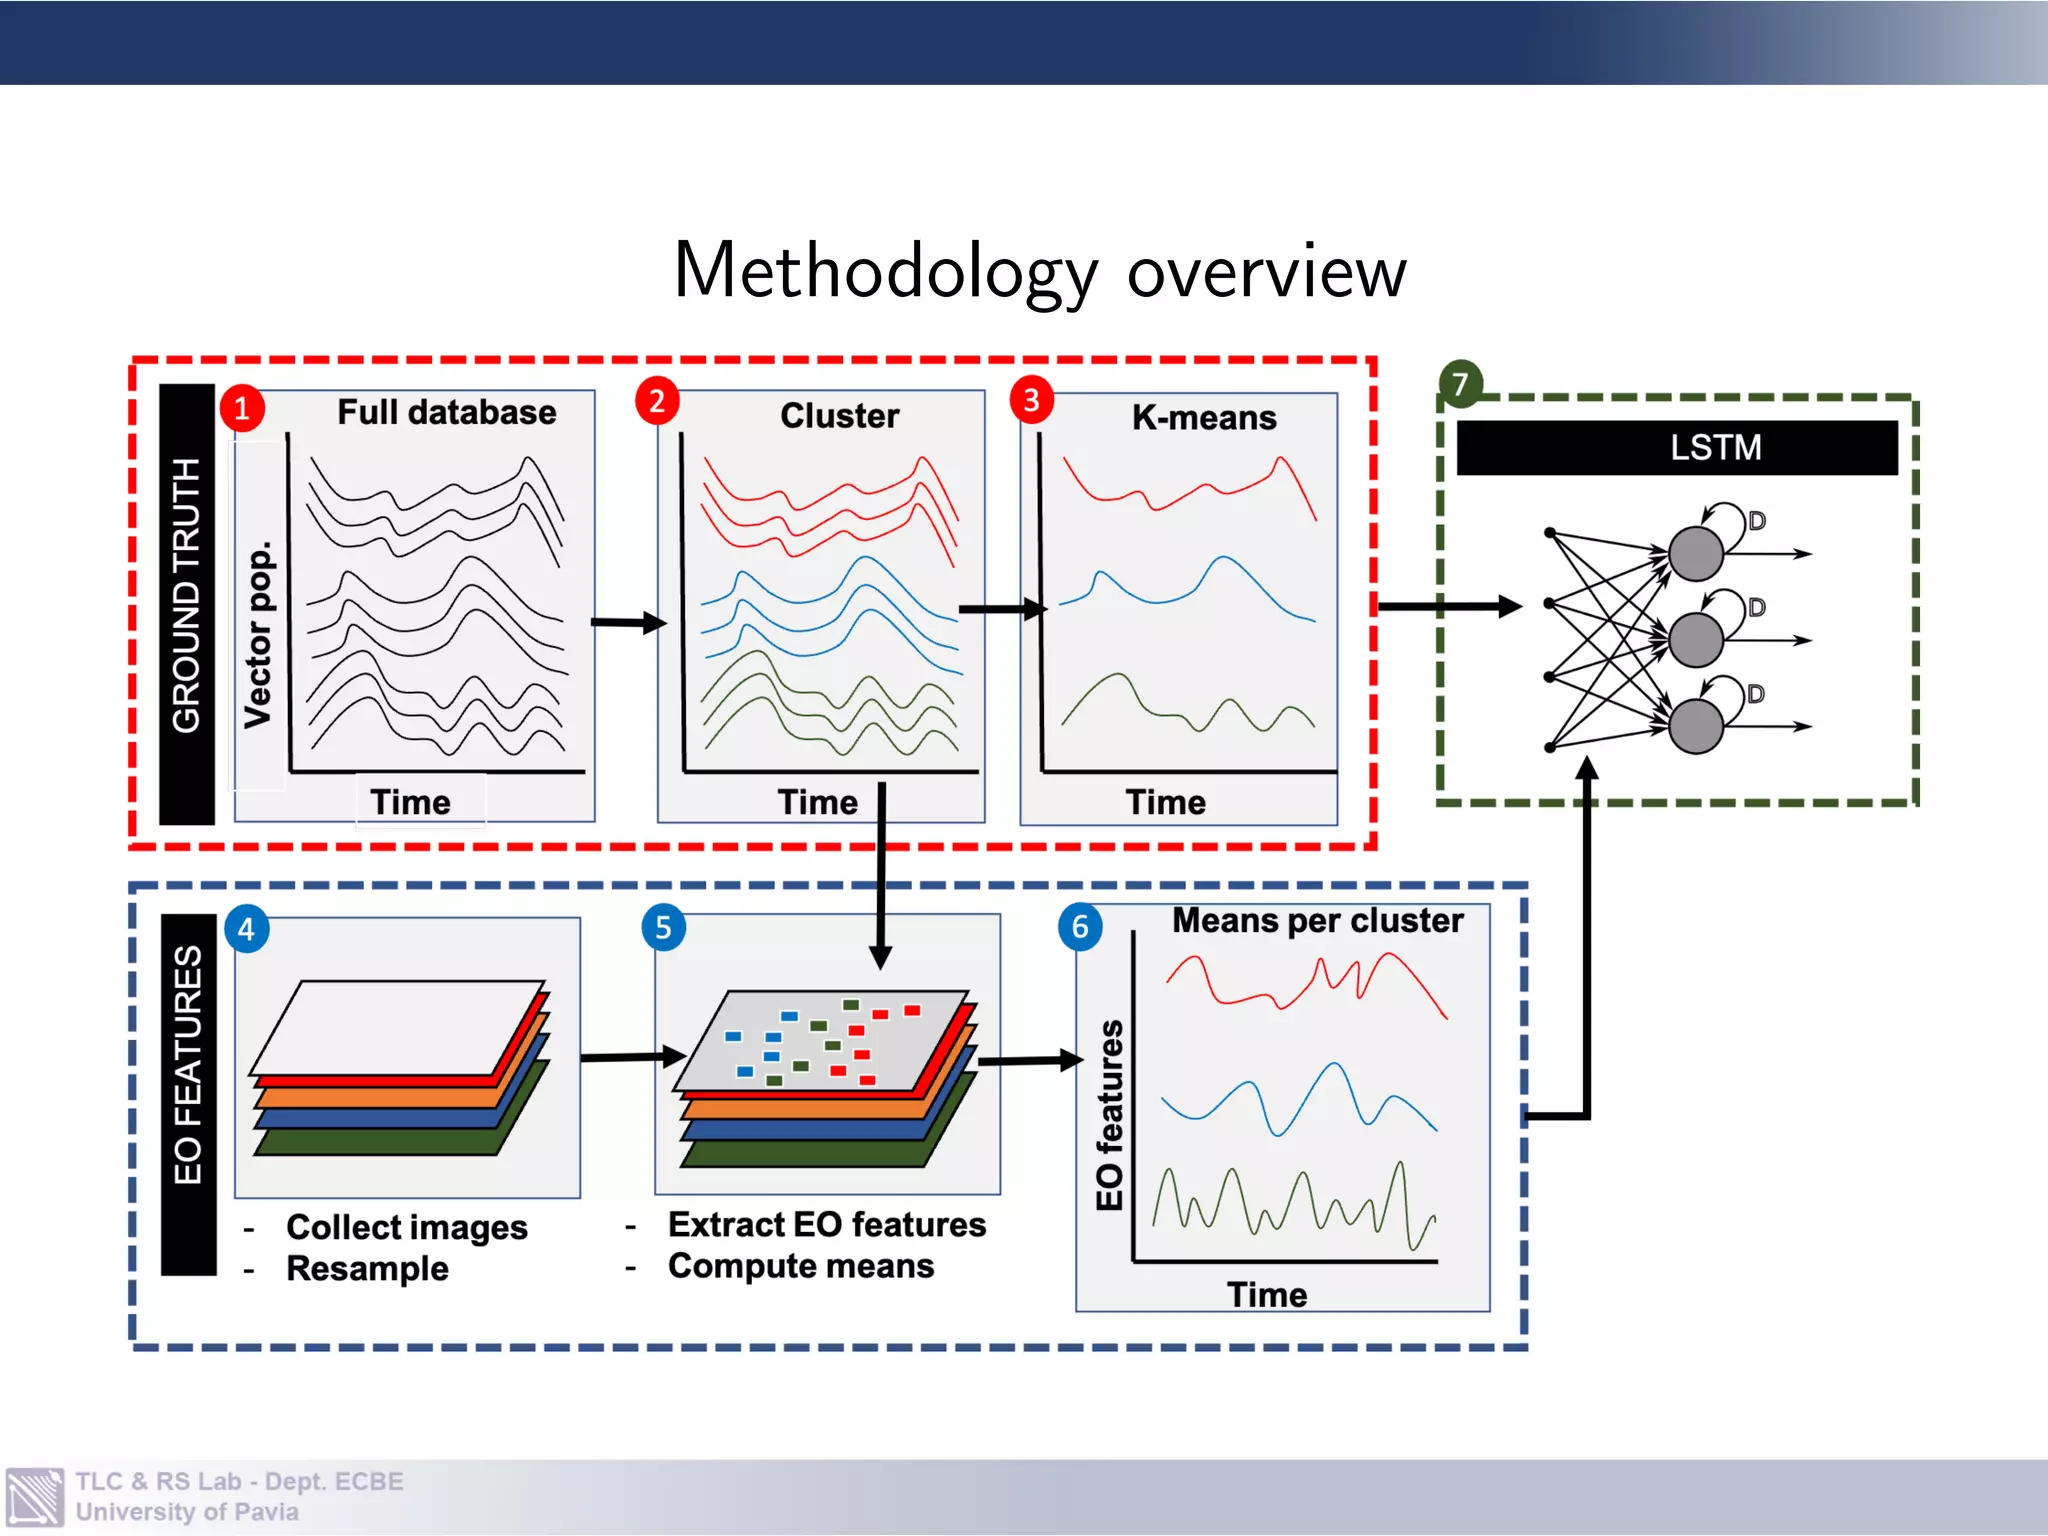
![• Cluster ground truth data by K-means approach.
• Given Ae. aegypti population across m locations:
Y = {y(1), y(2), . . . , y(m)}, y(i) ∈ RP;
• Partition Y into k clusters with centers
{c(1) . . . , c(k)}, c(i) ∈ RP;
• For n EO features means over k clusters as
X = {x(1), x(2), . . . , x(k×n)}, x(i) ∈ RP across time period P.
• Resulting model is defined a NARX model:
b
ct = F([ct−T , . . . , ct−1]; [xt−T , . . . , xt−1]), (3)
Methodology — Model](https://image.slidesharecdn.com/presentationtochineseuniversityofpetroleum-31062021-210605203704/75/Dengue-Vector-Population-Forecasting-Using-Multisource-Earth-Observation-Products-and-Recurrent-Neural-Networks-Presented-at-a-seminar-to-students-of-the-Chinese-University-of-Petroleum-31-06-2021-20-2048.jpg)
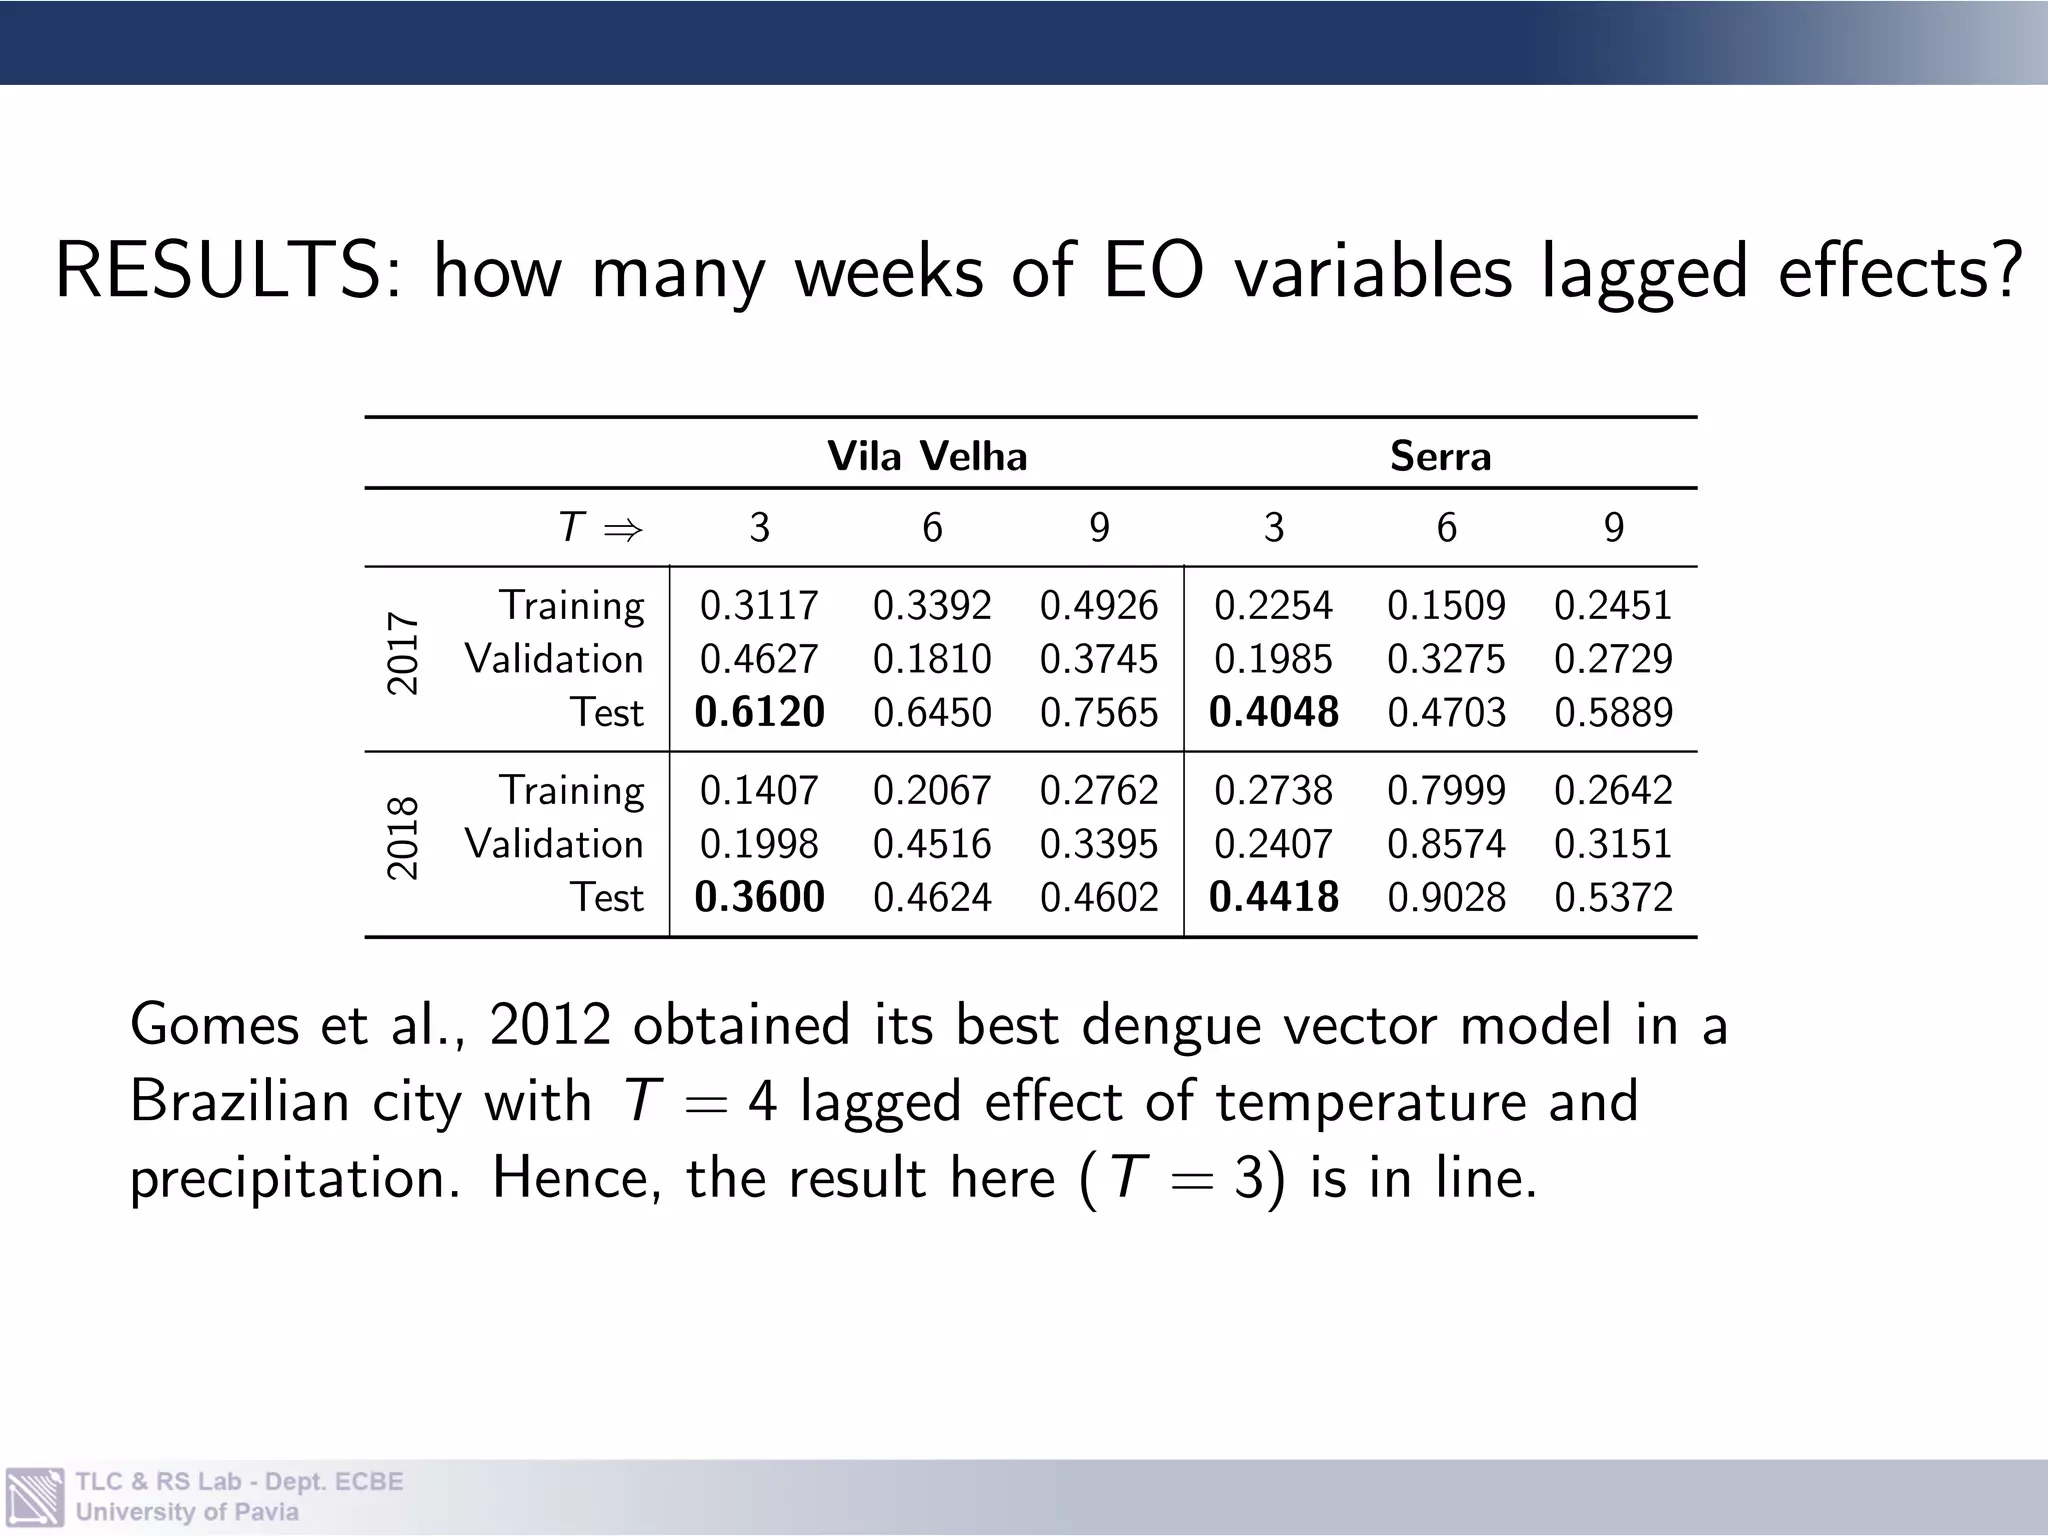
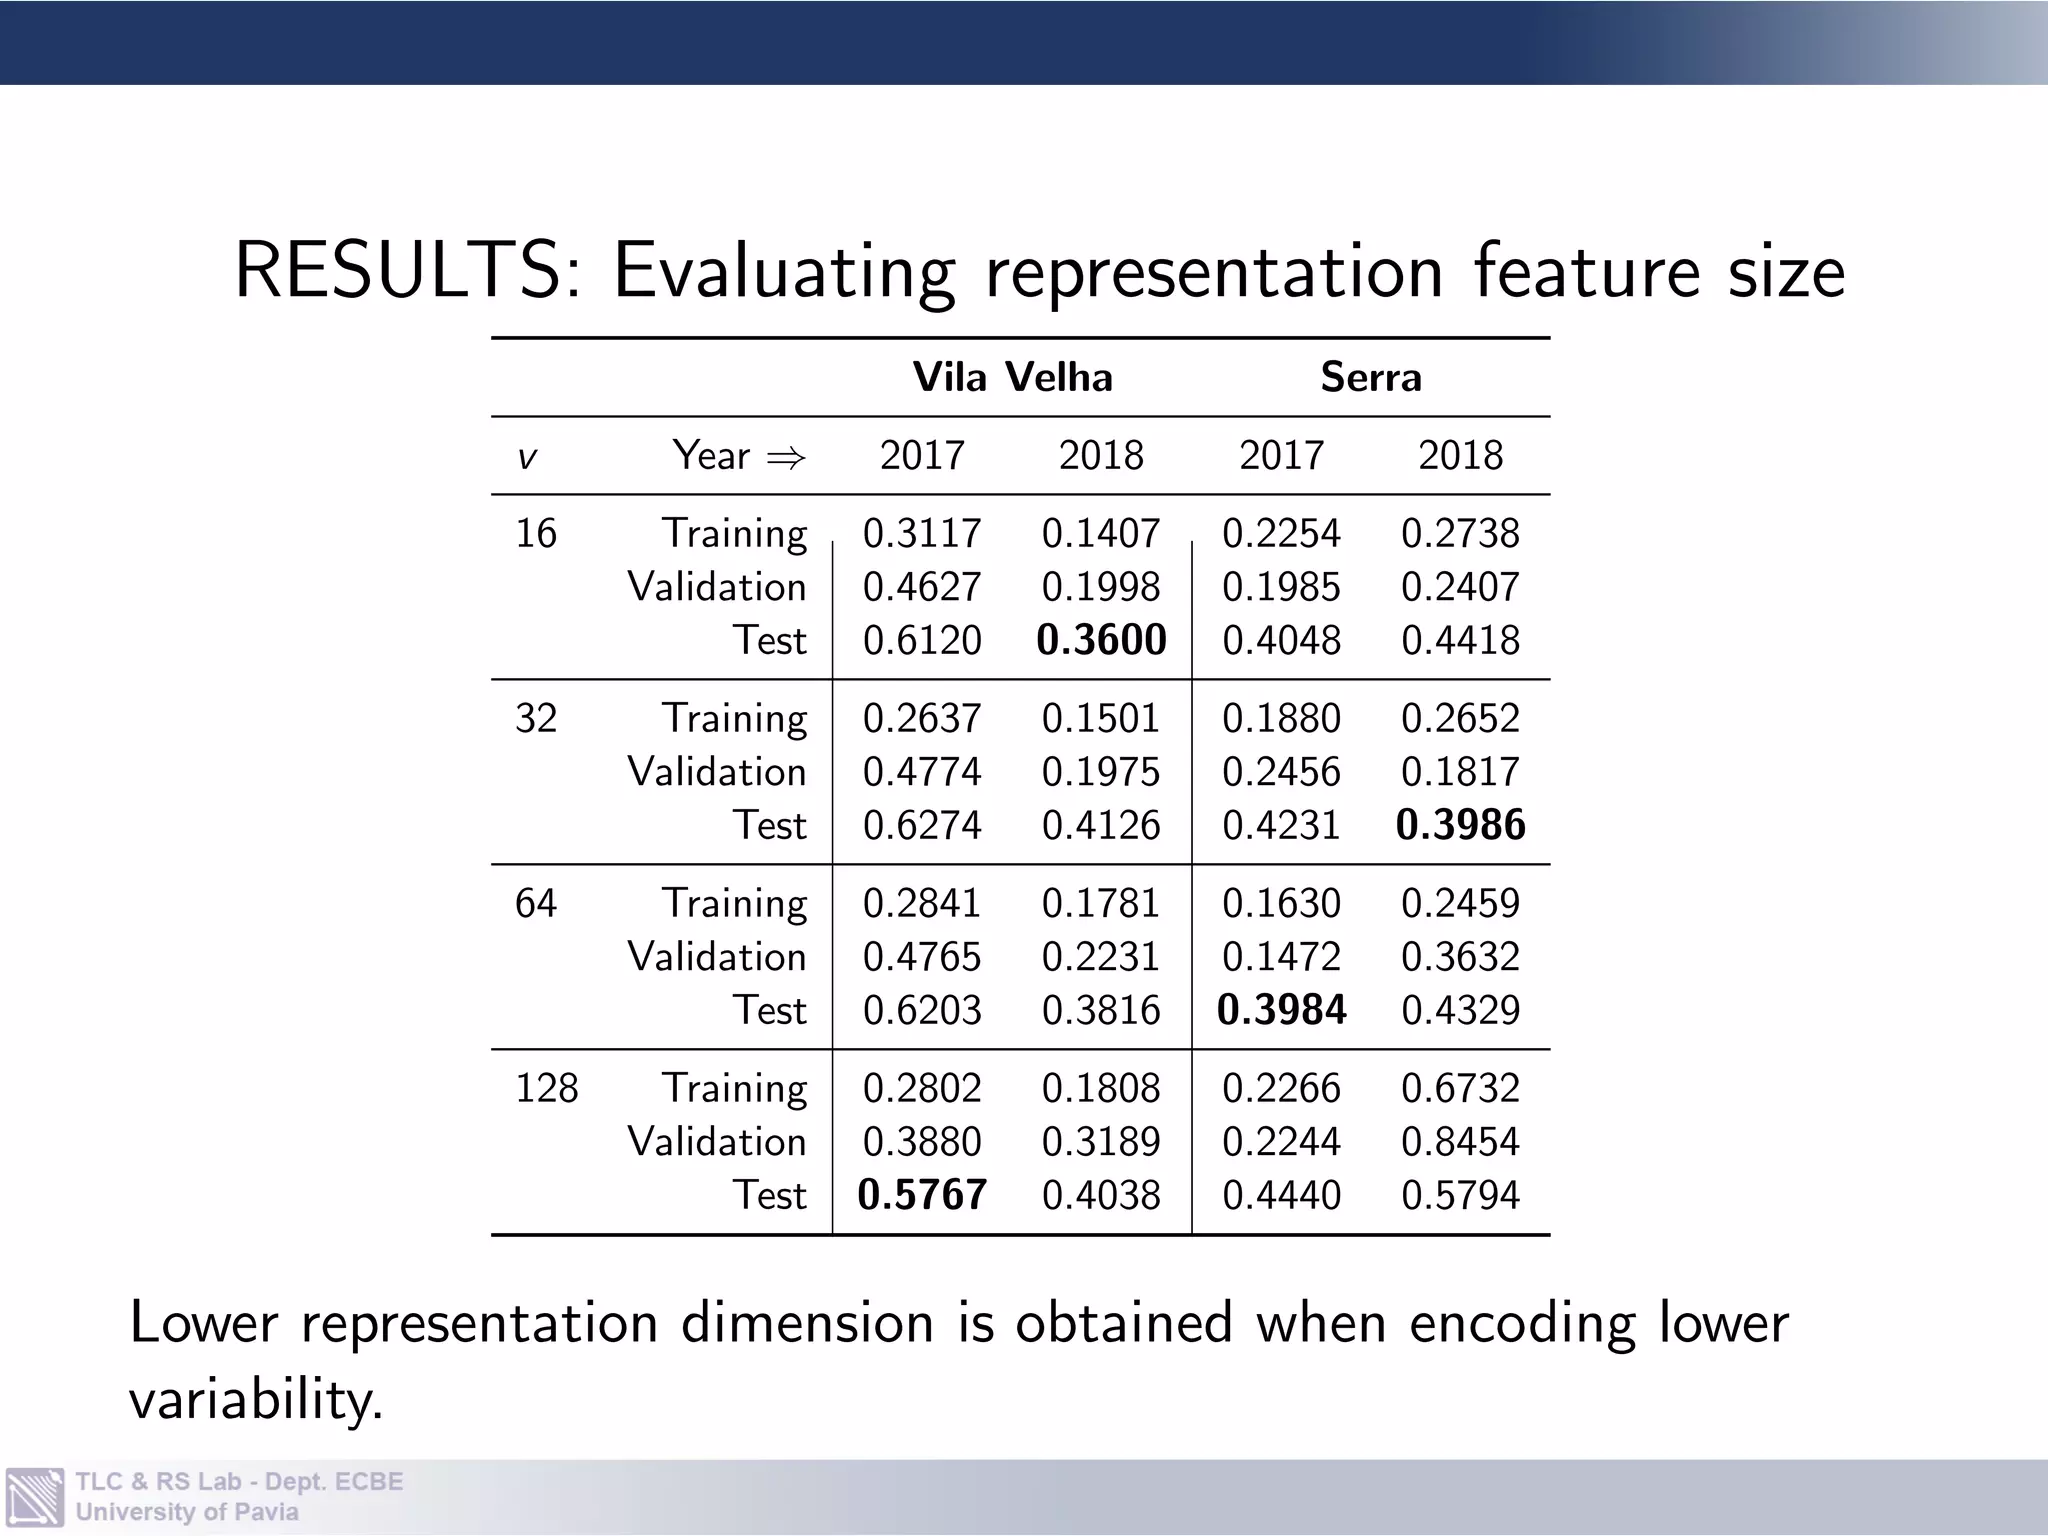
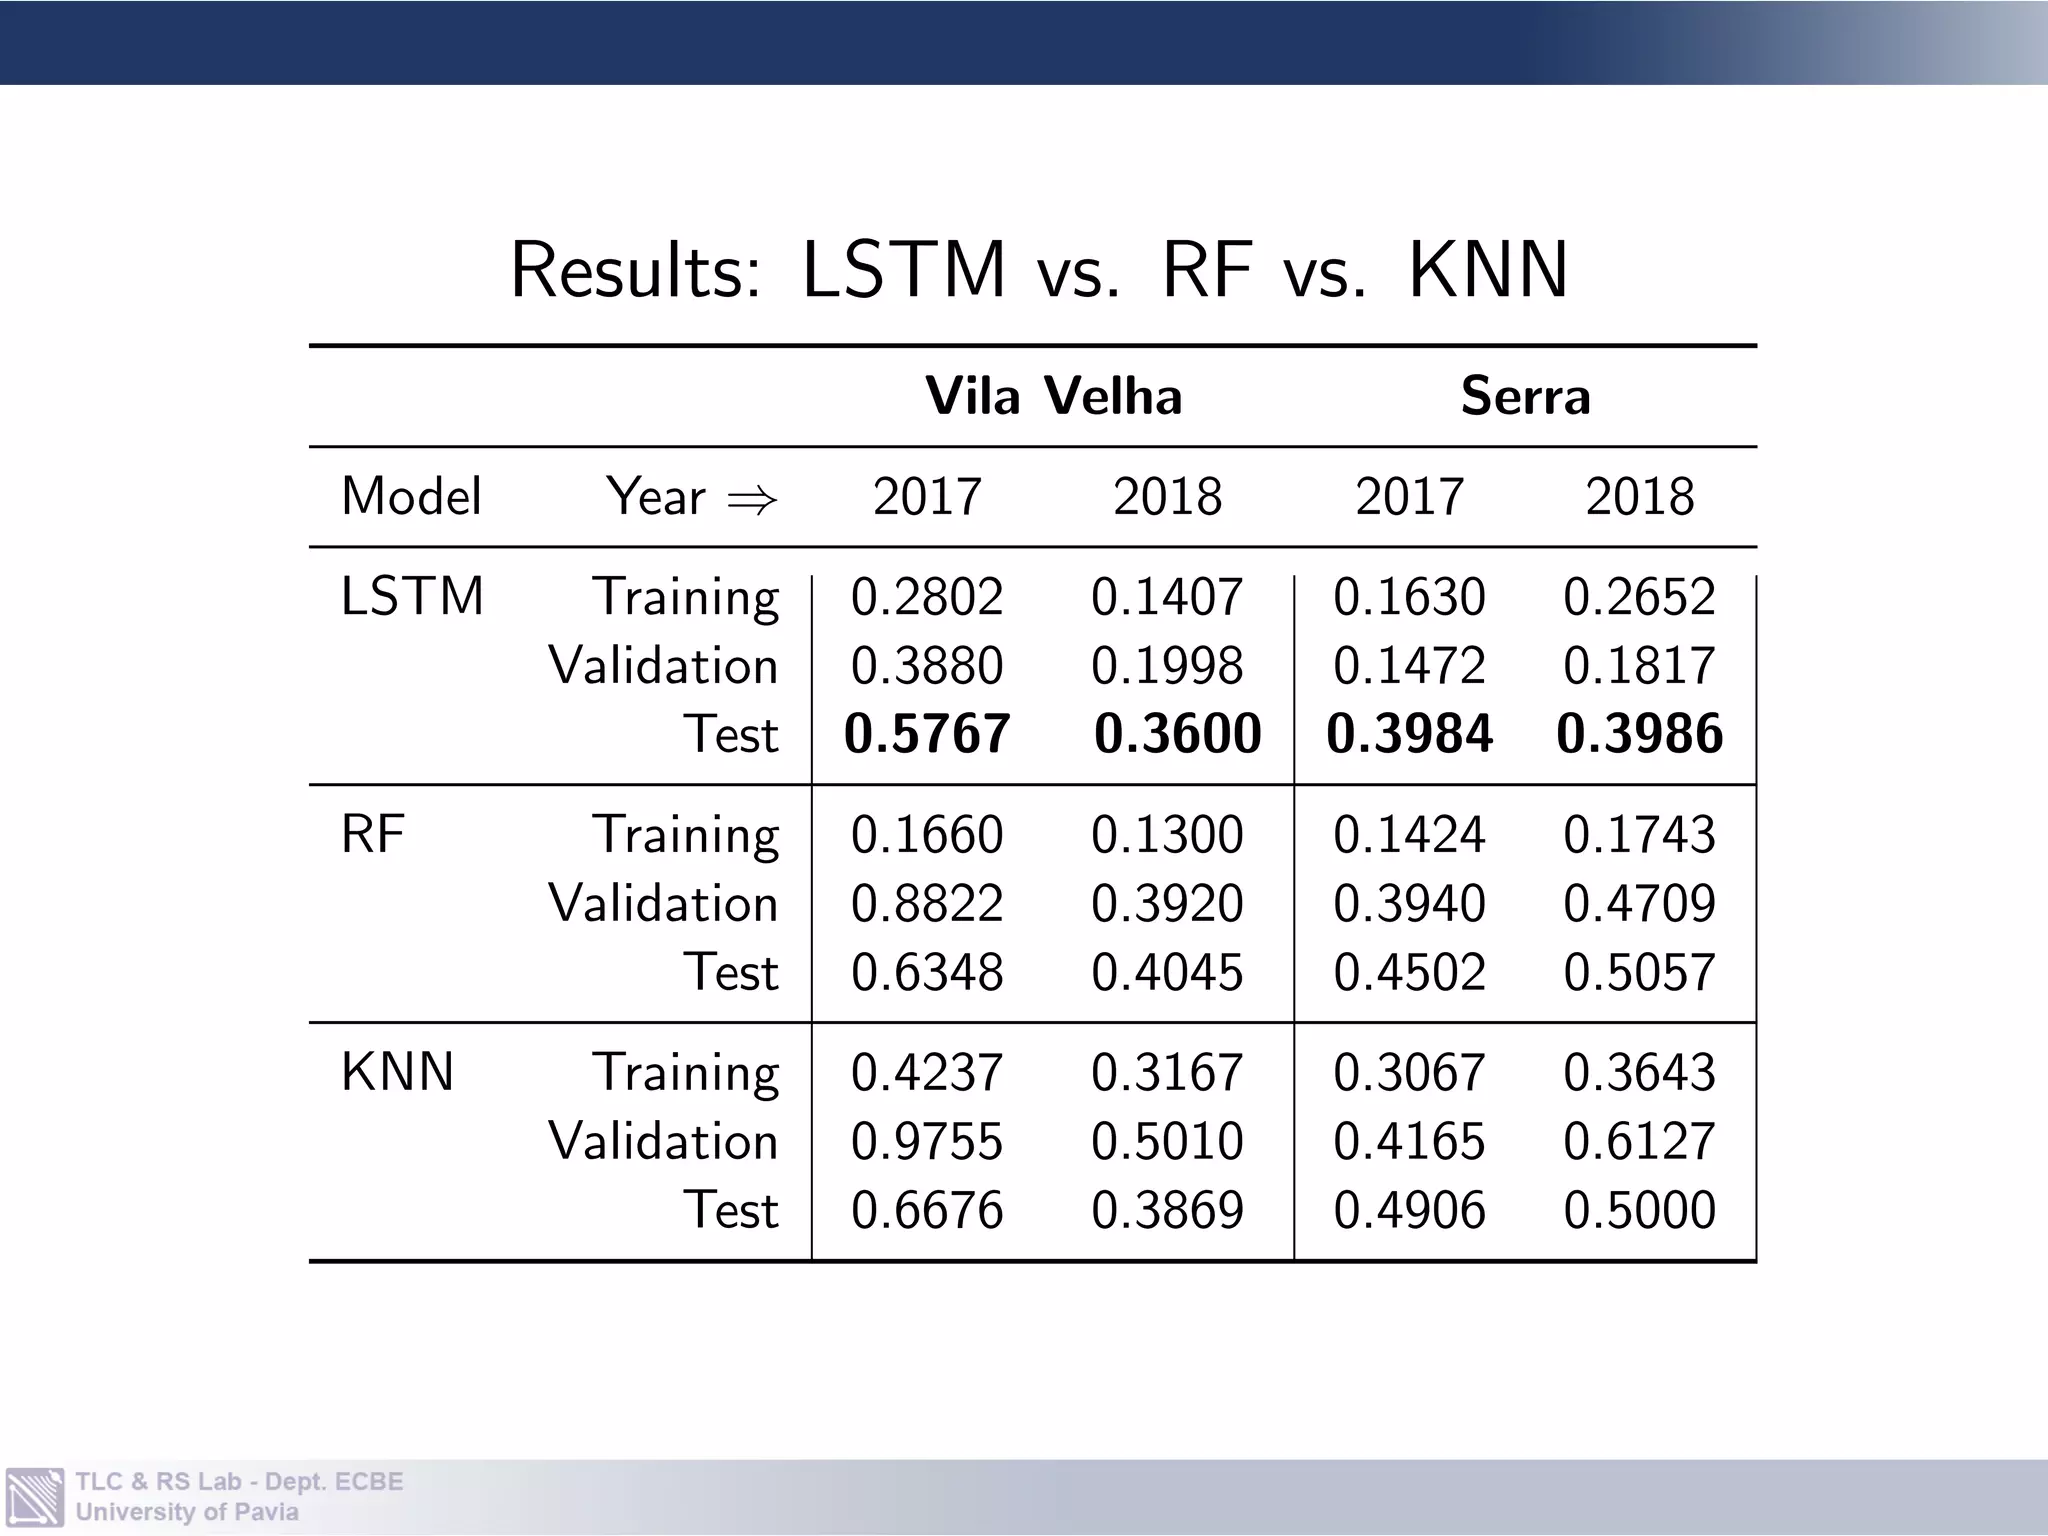
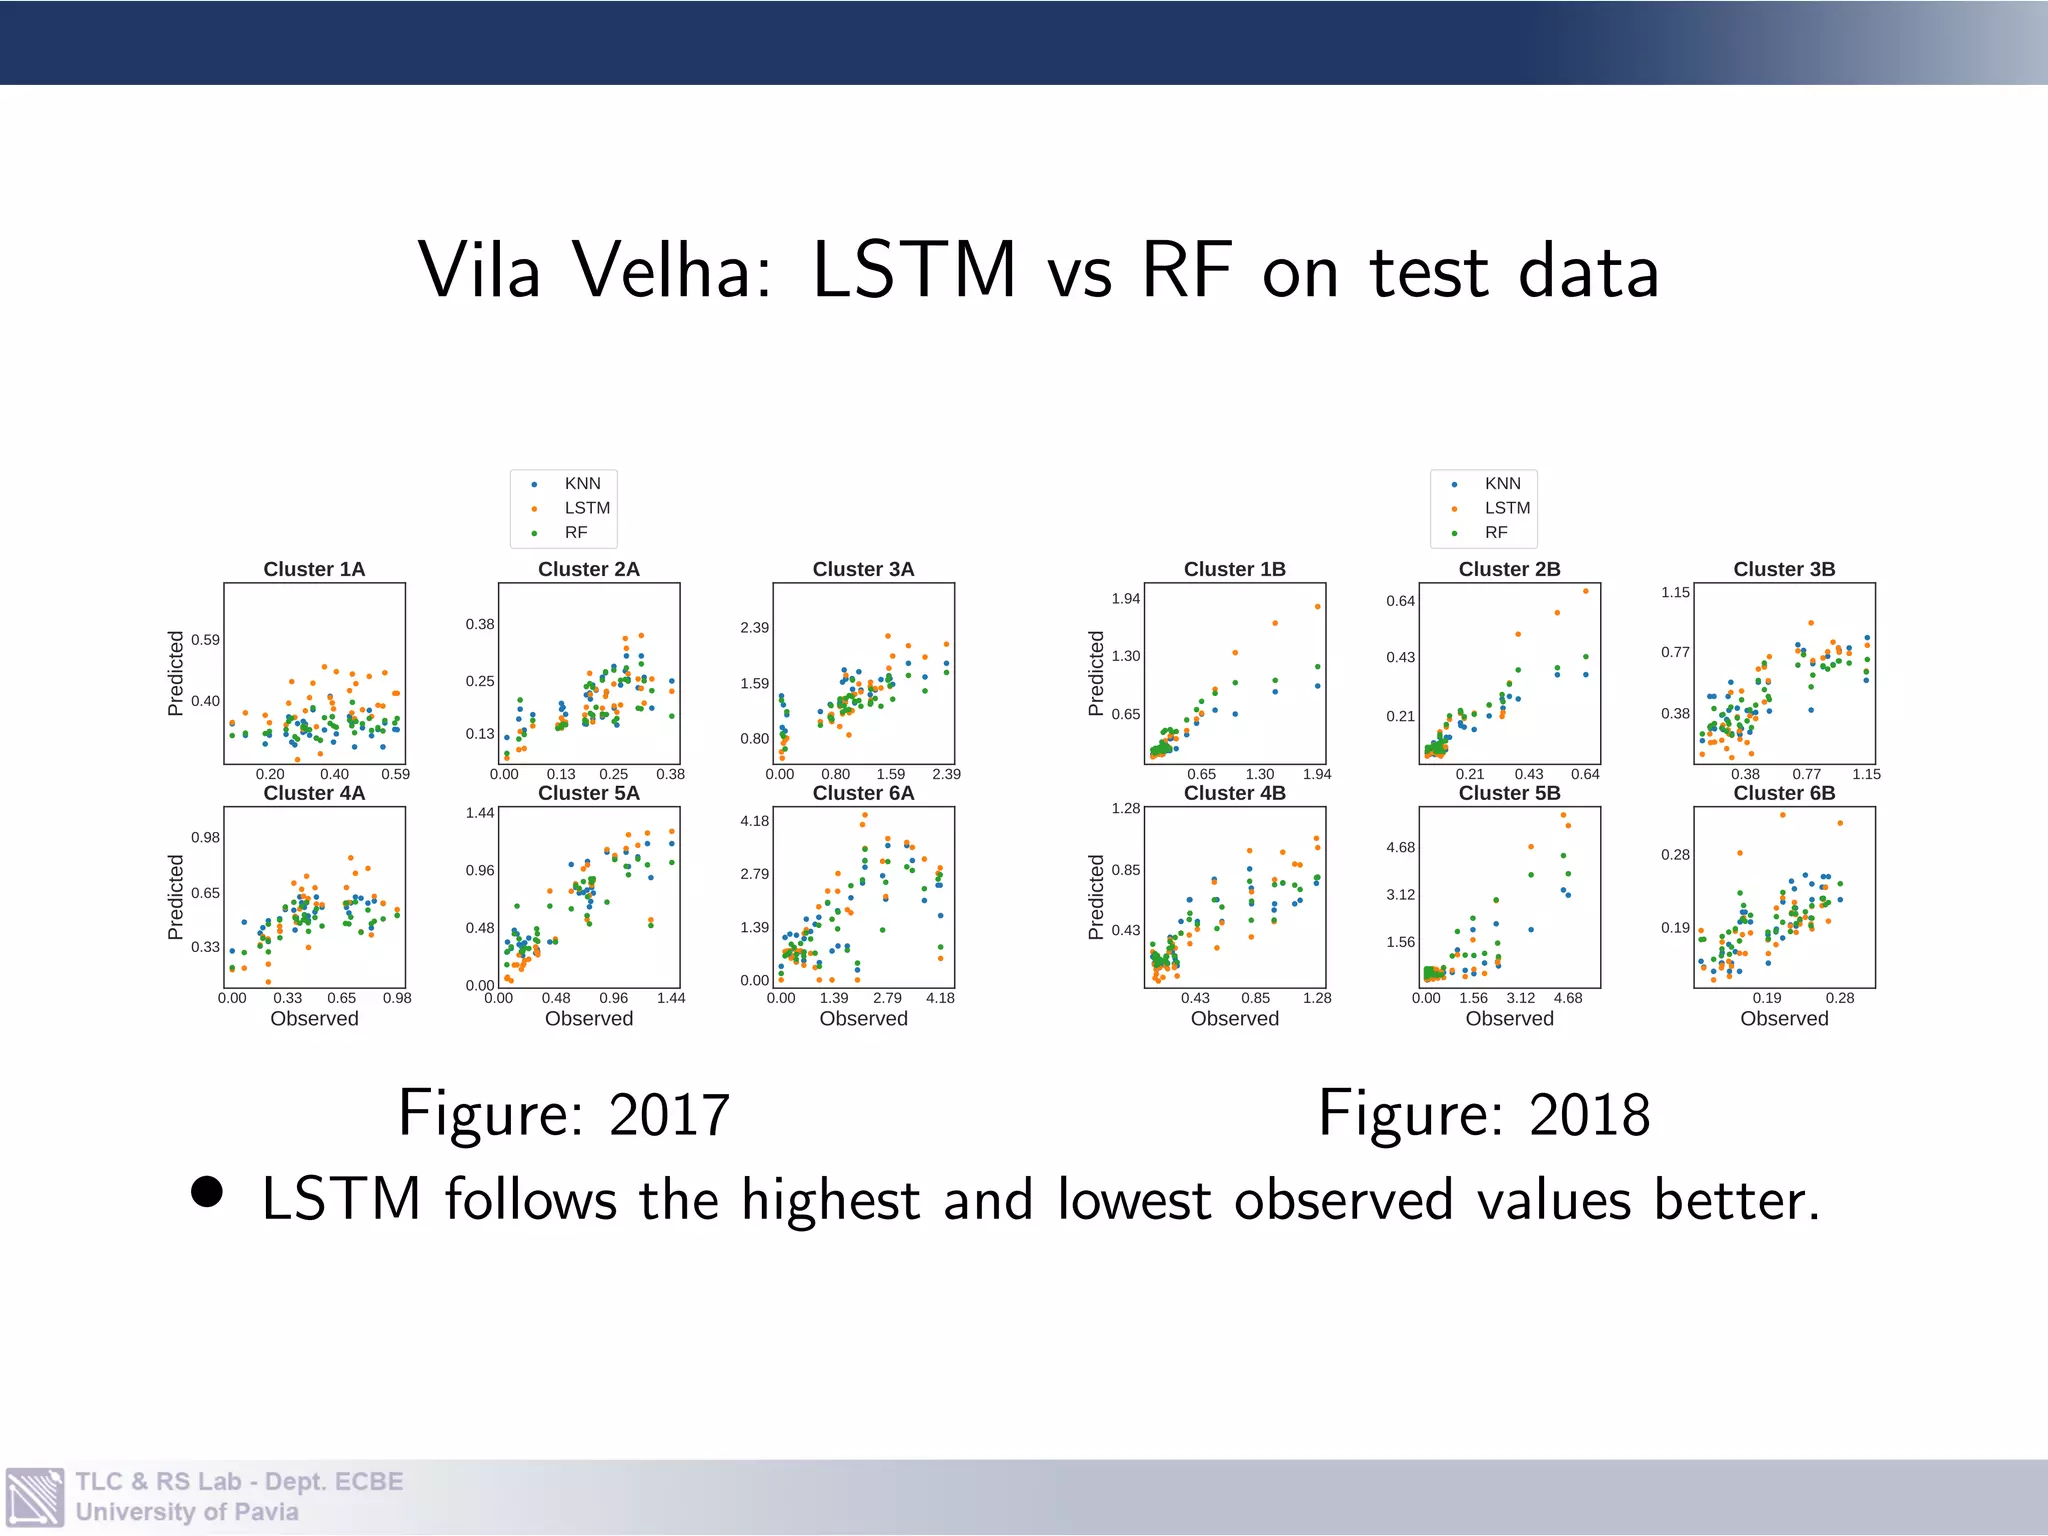
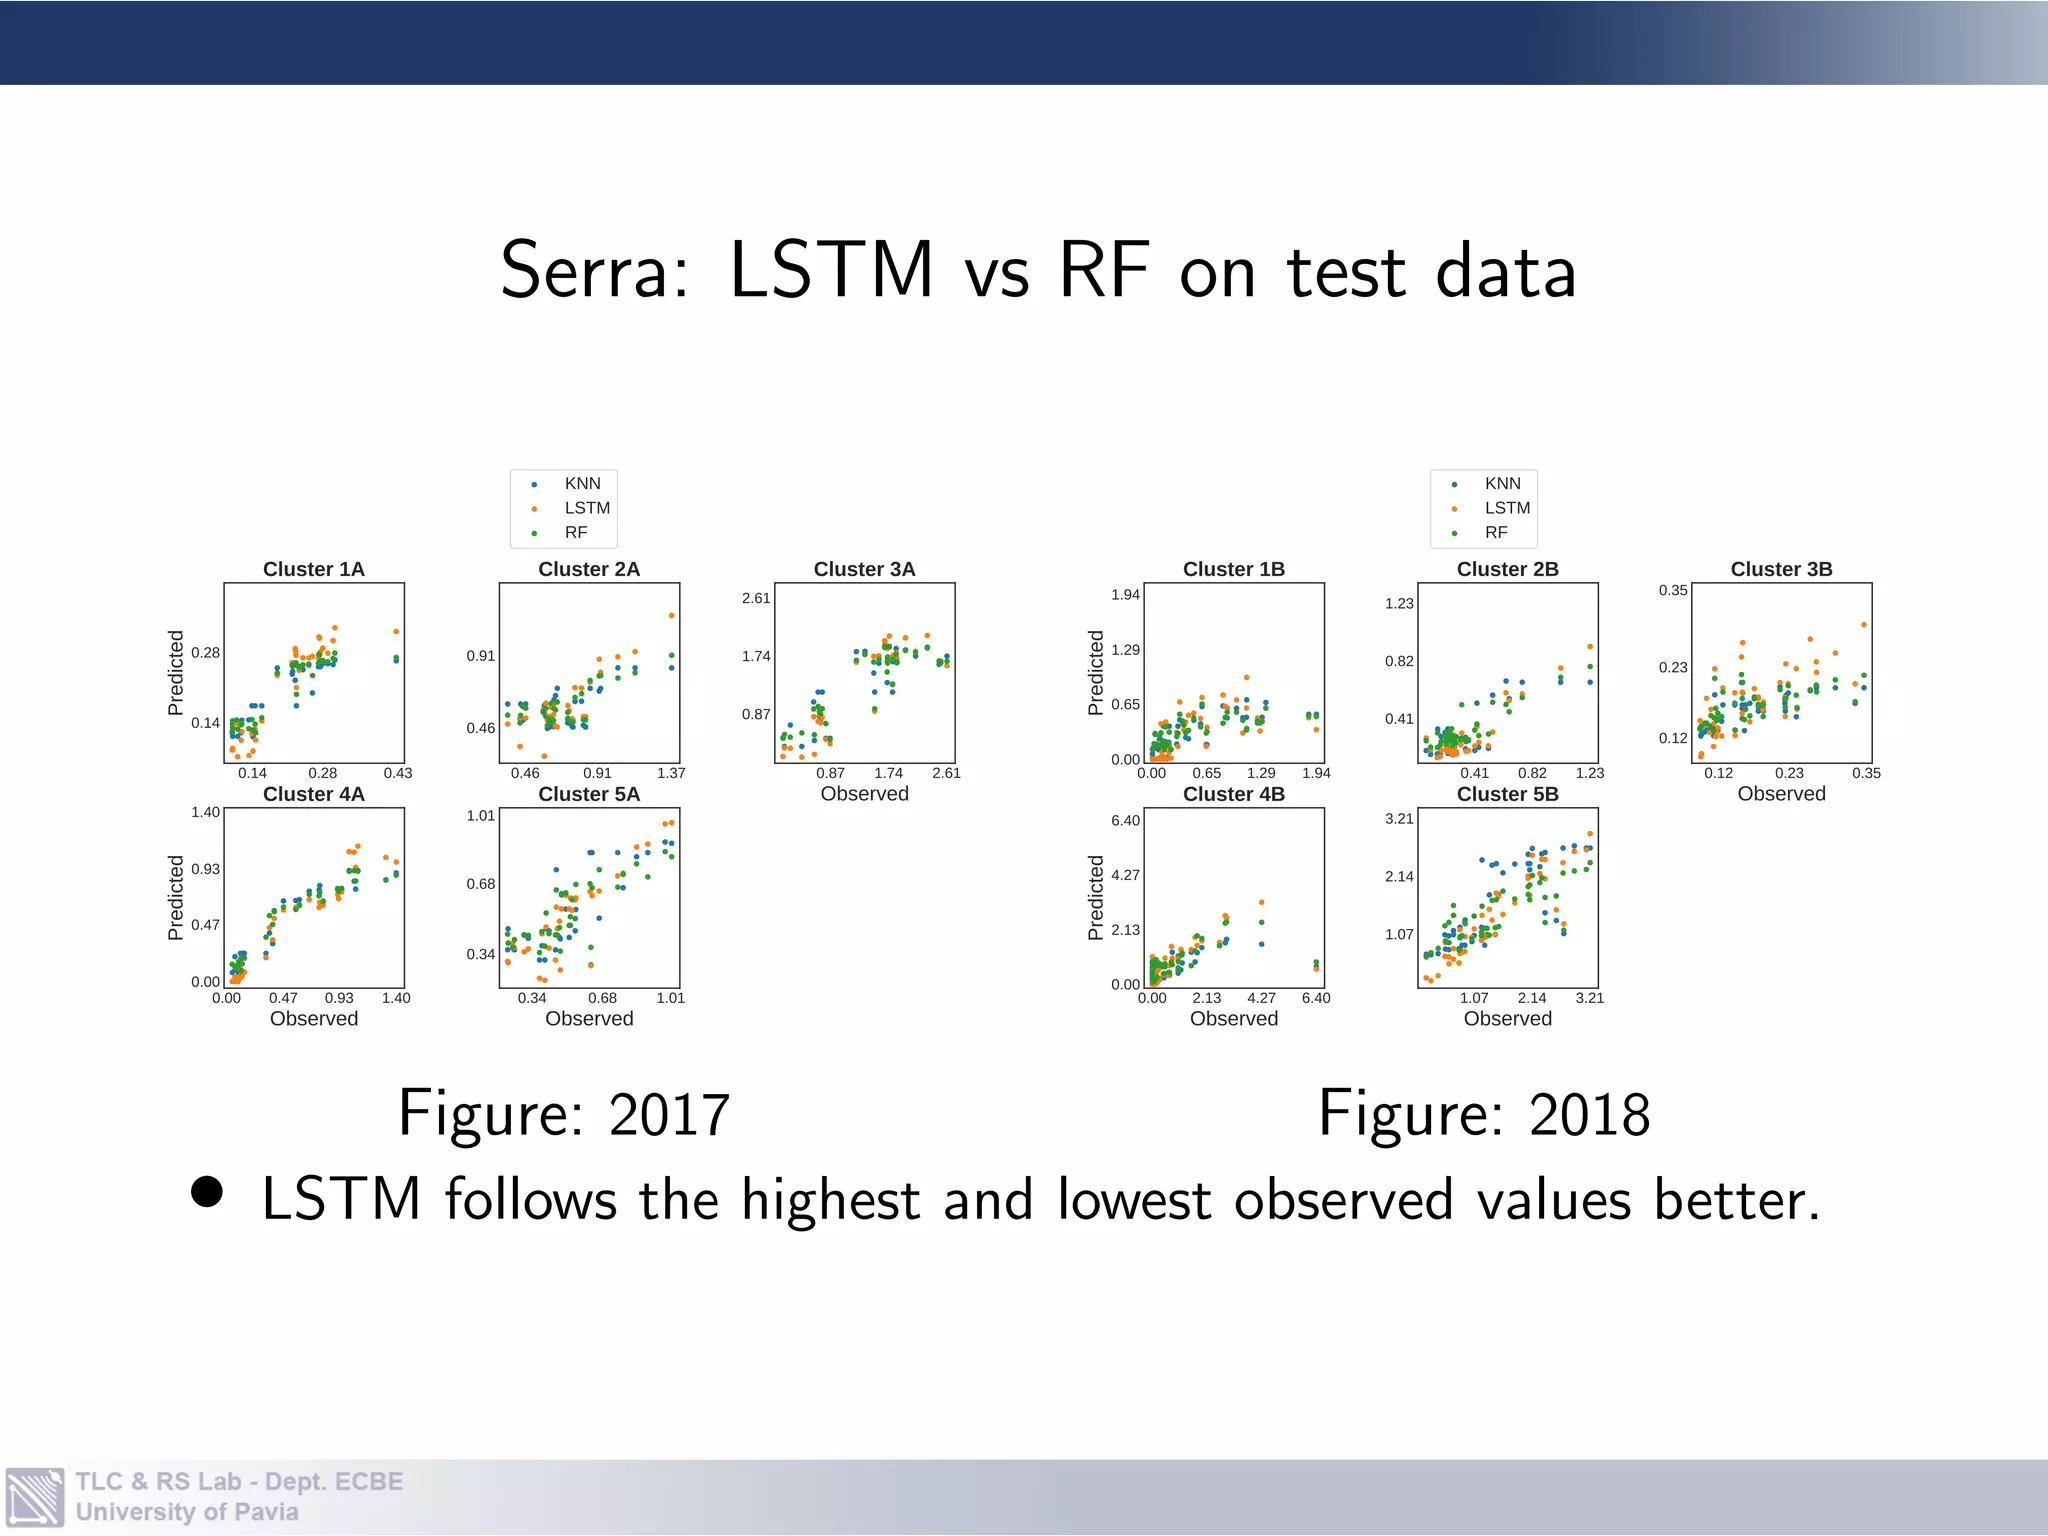


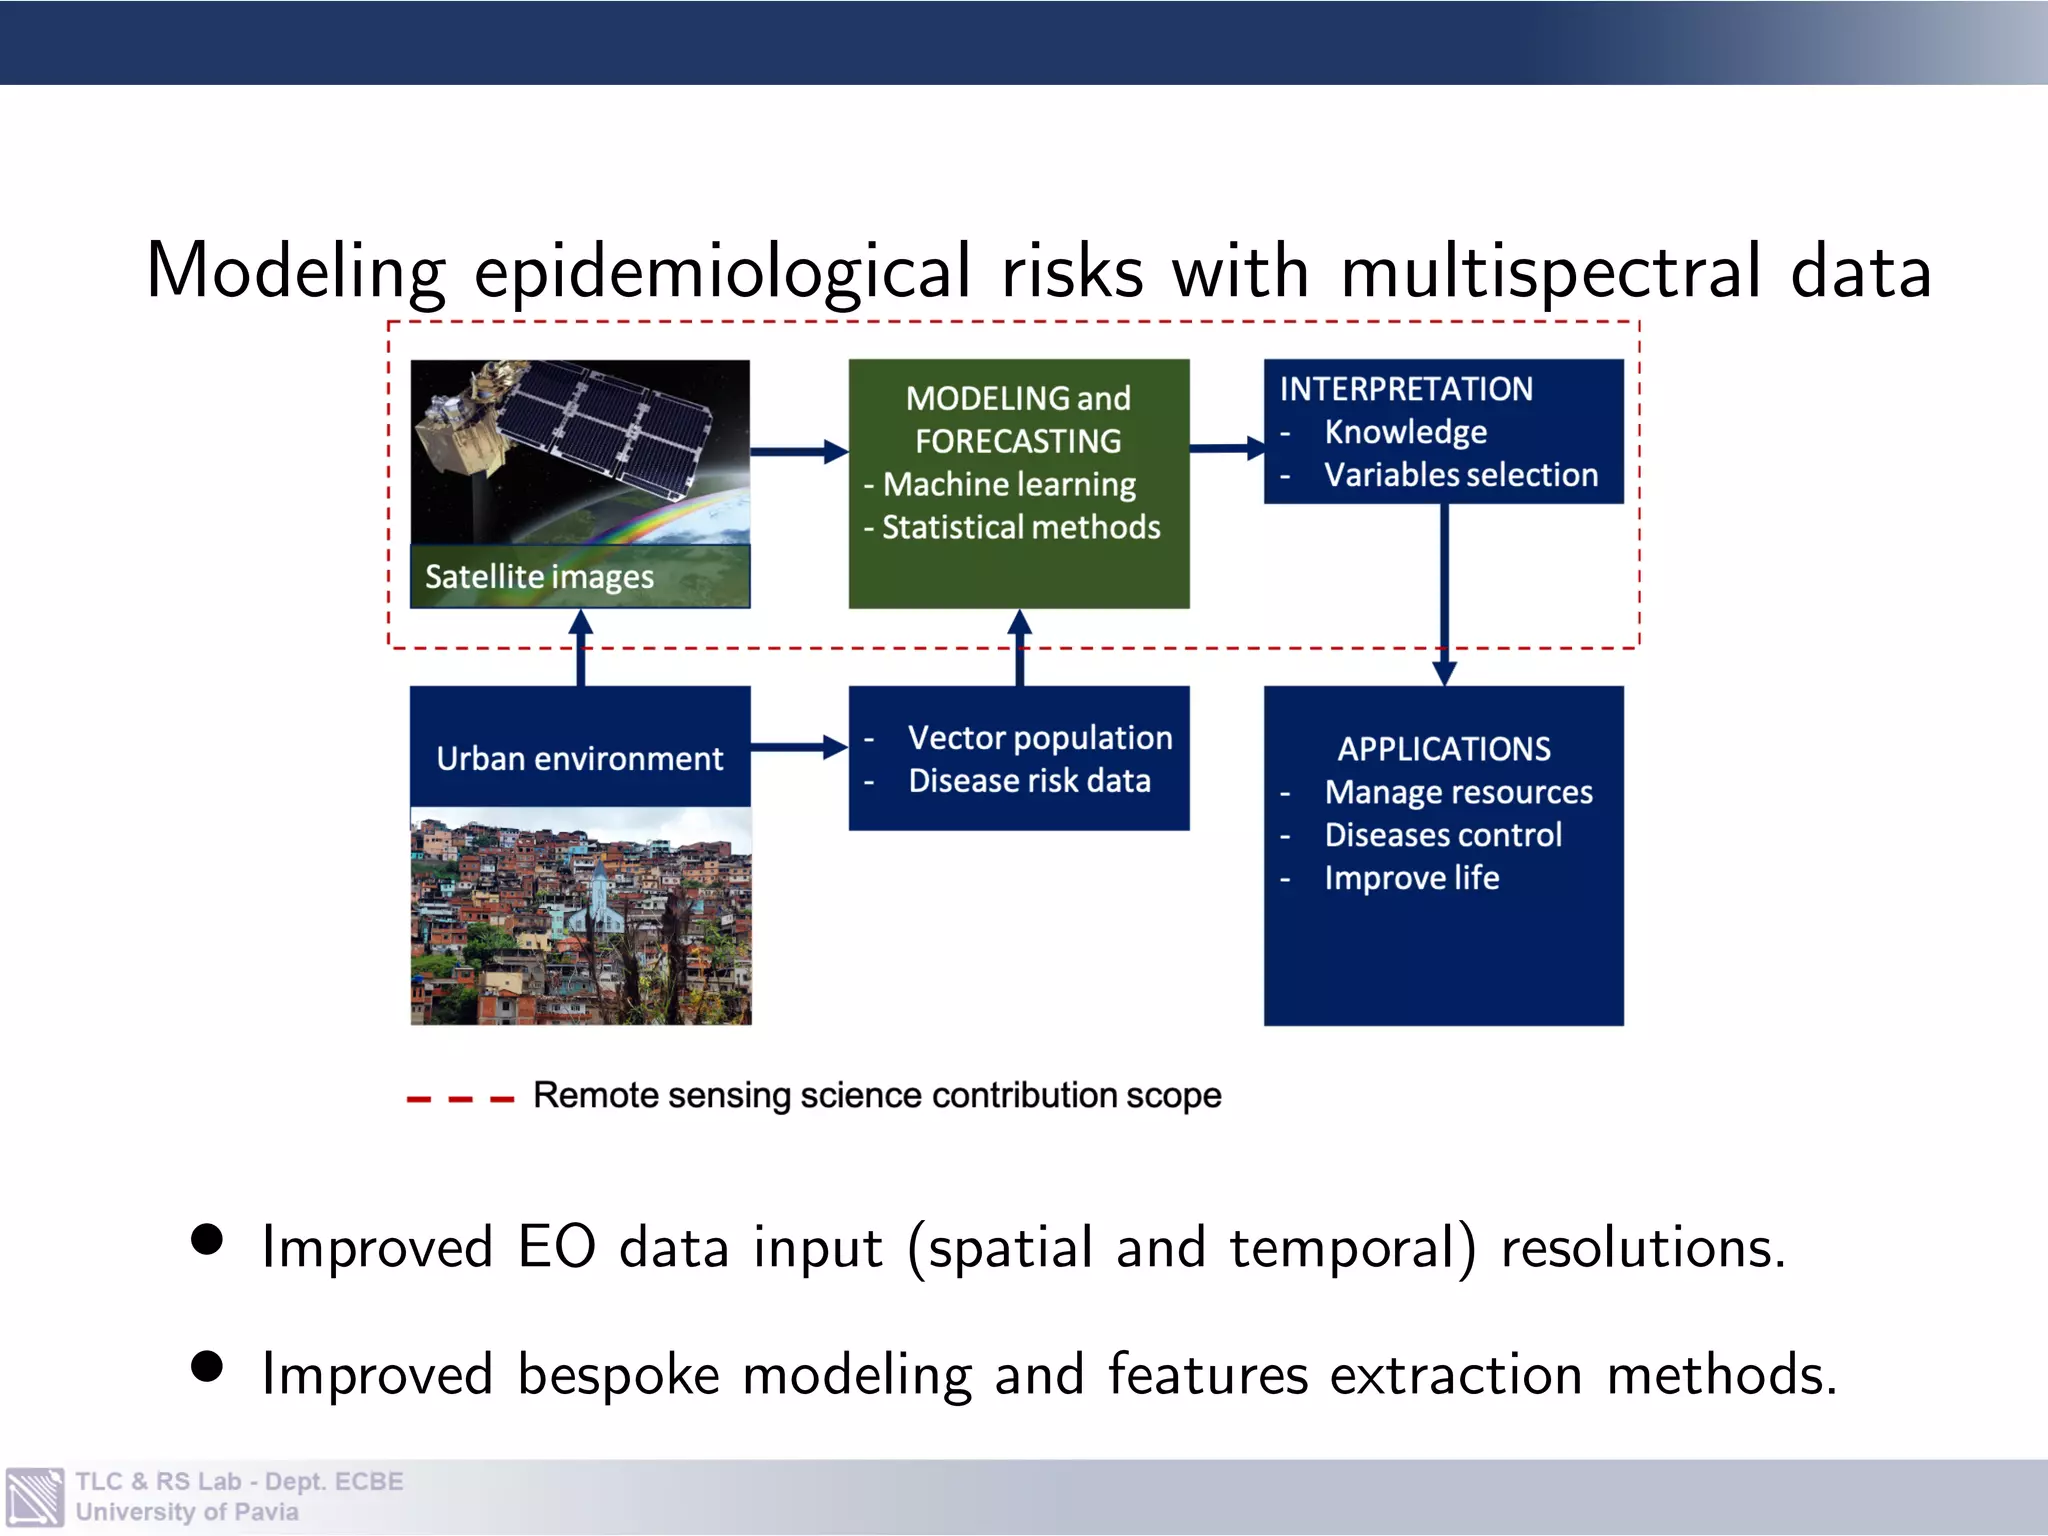
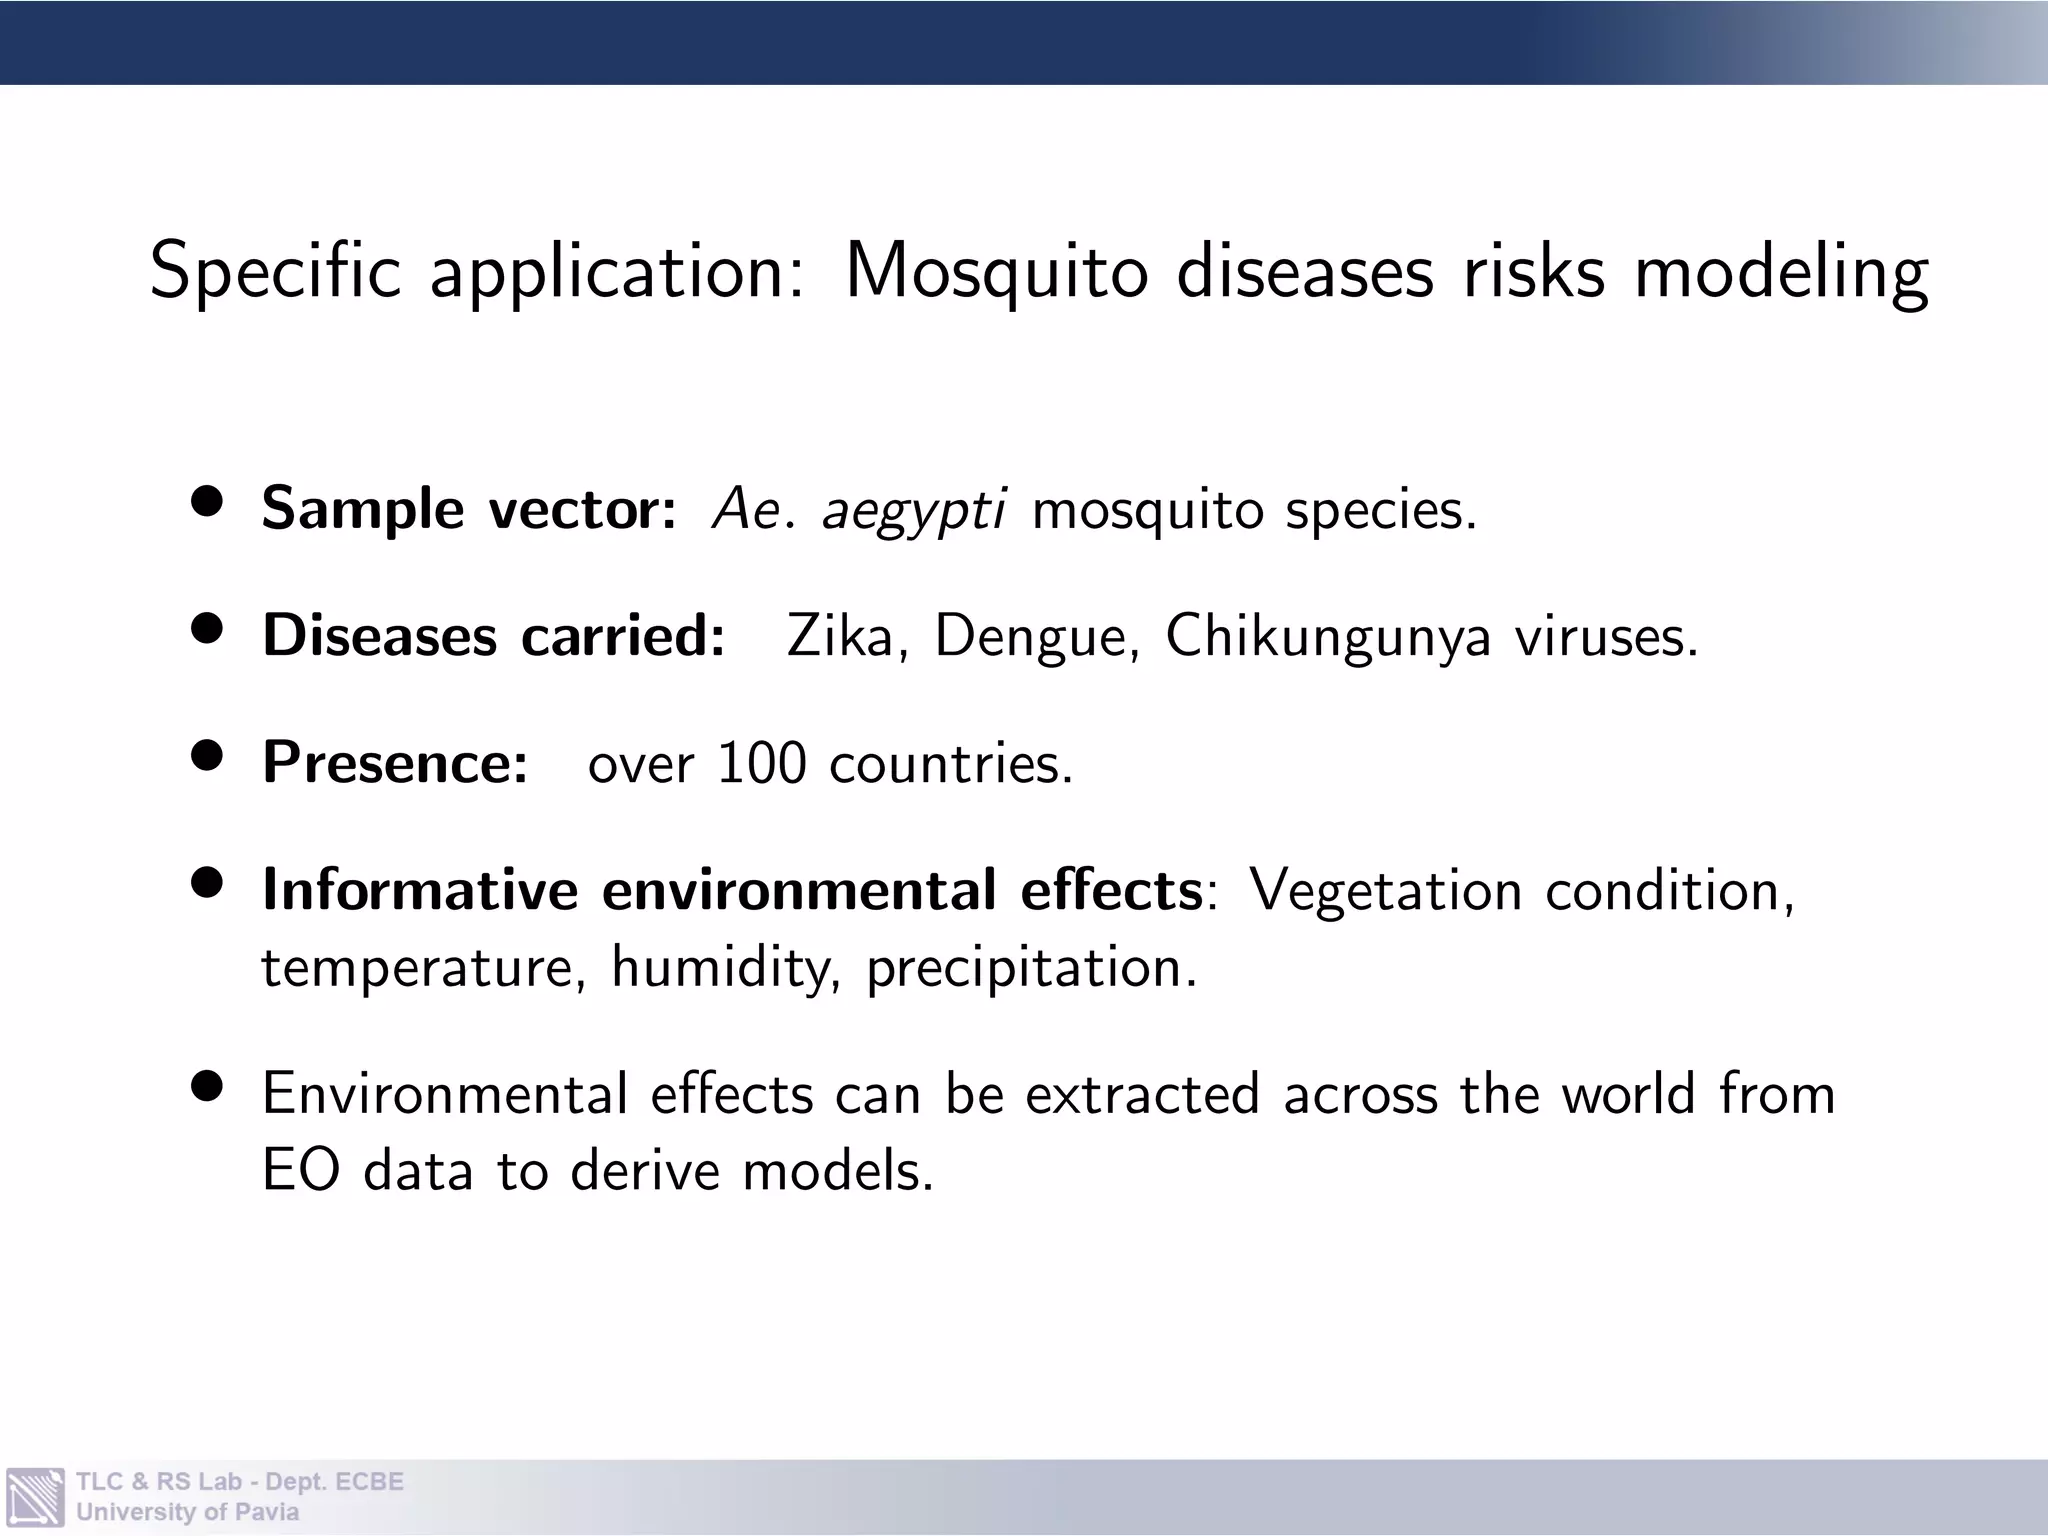
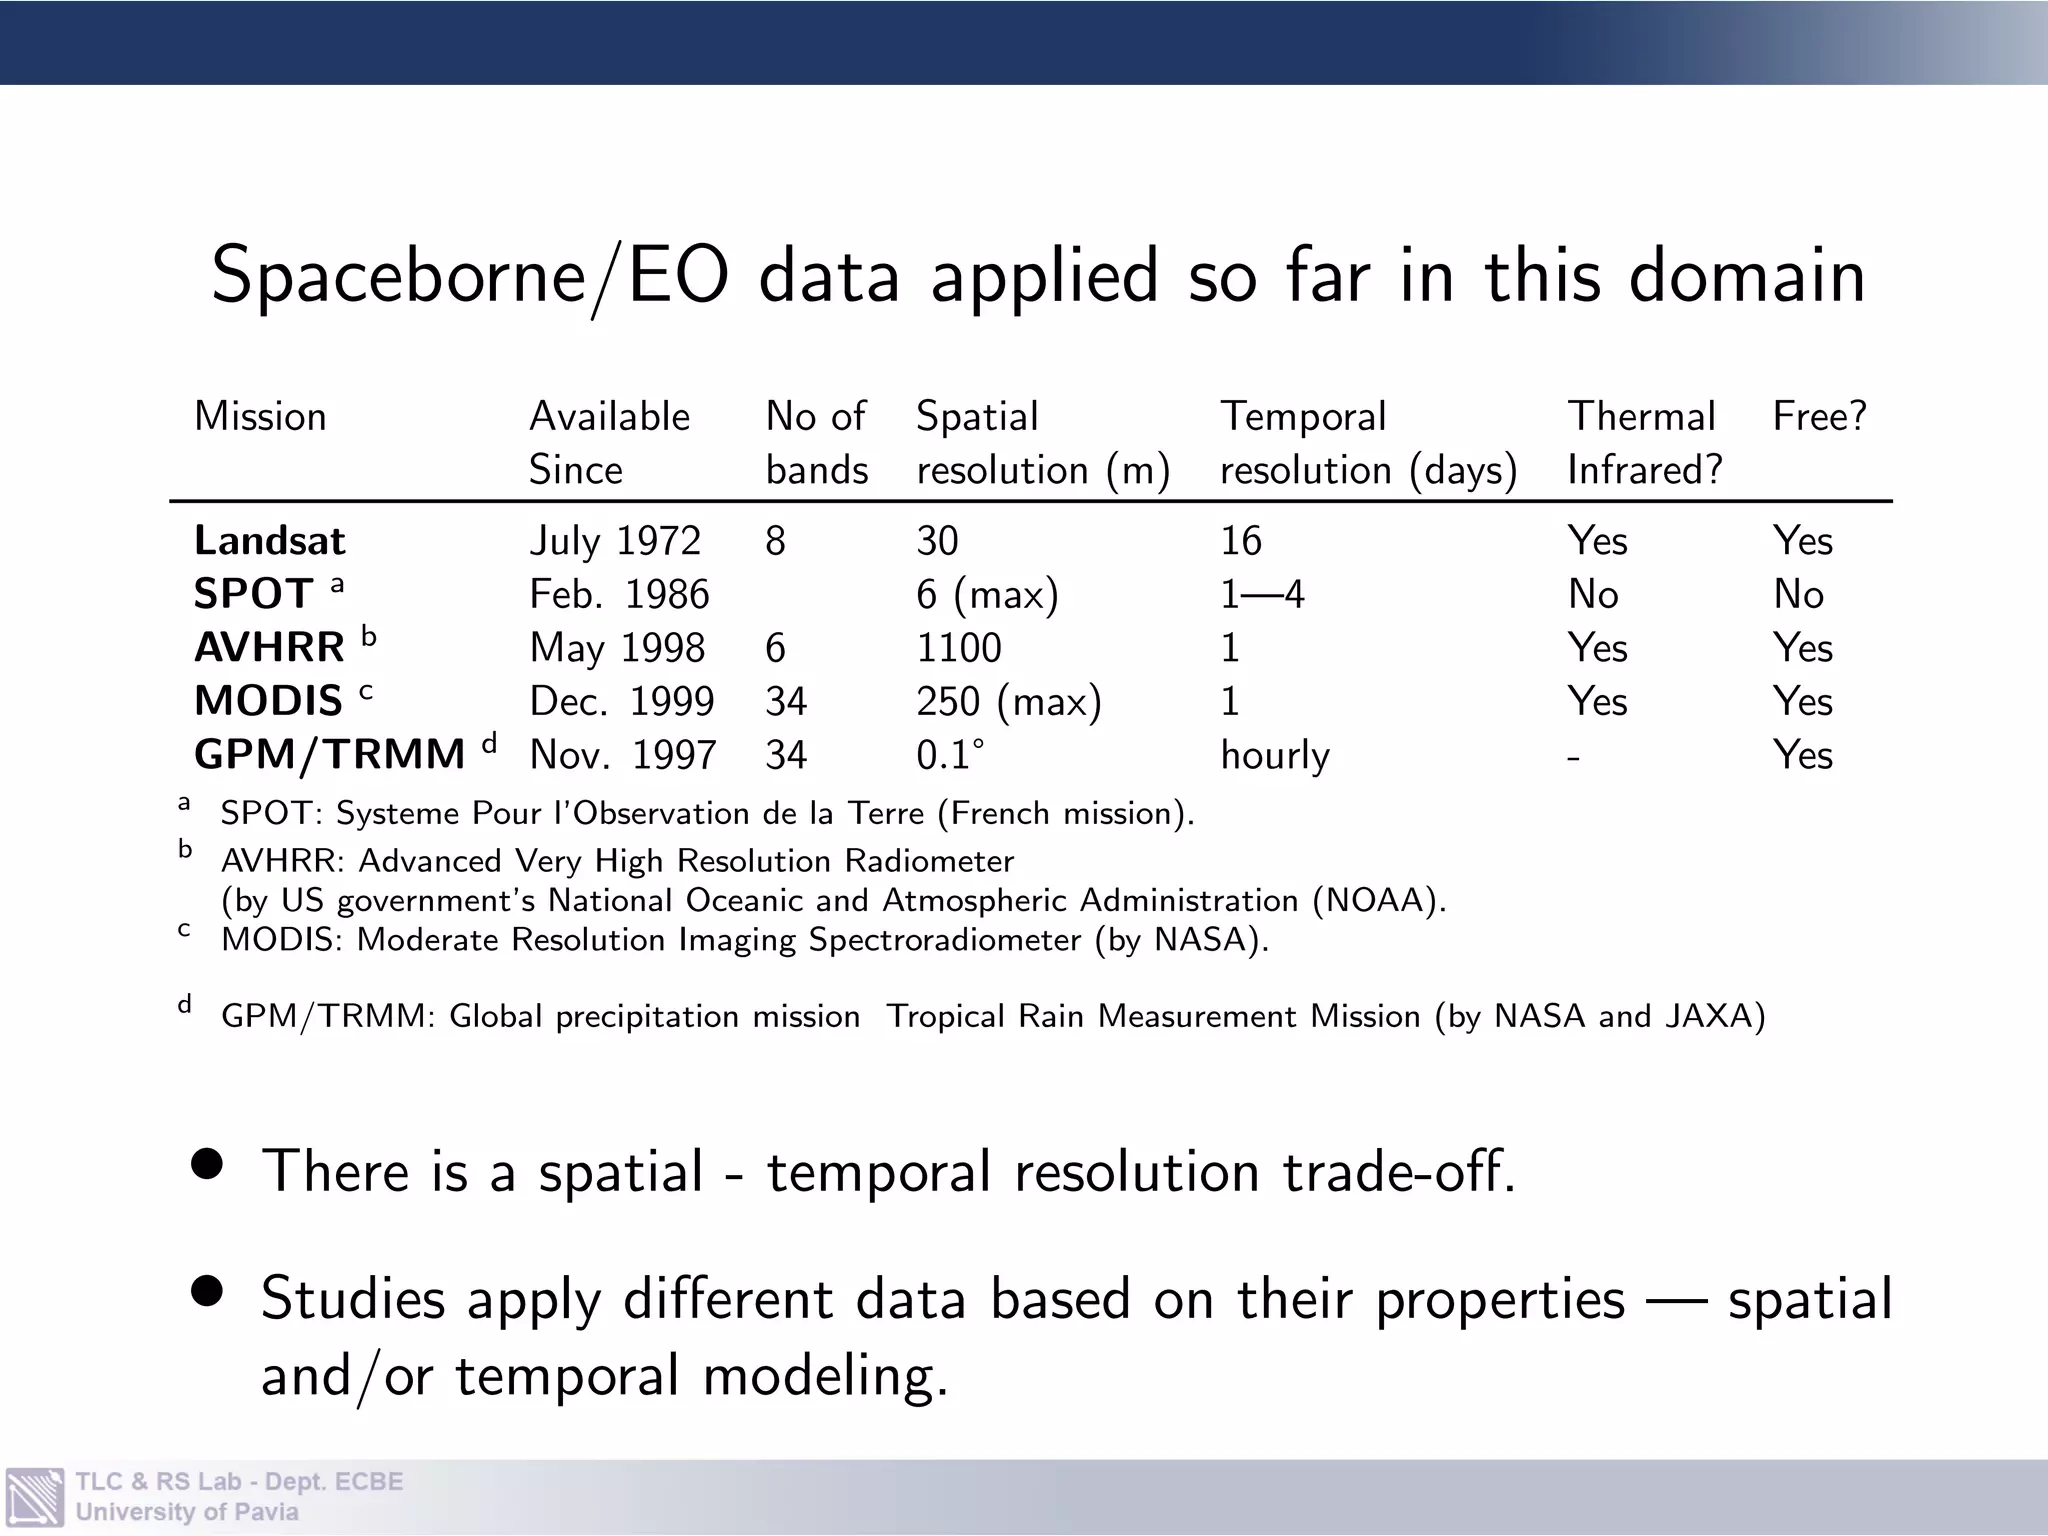
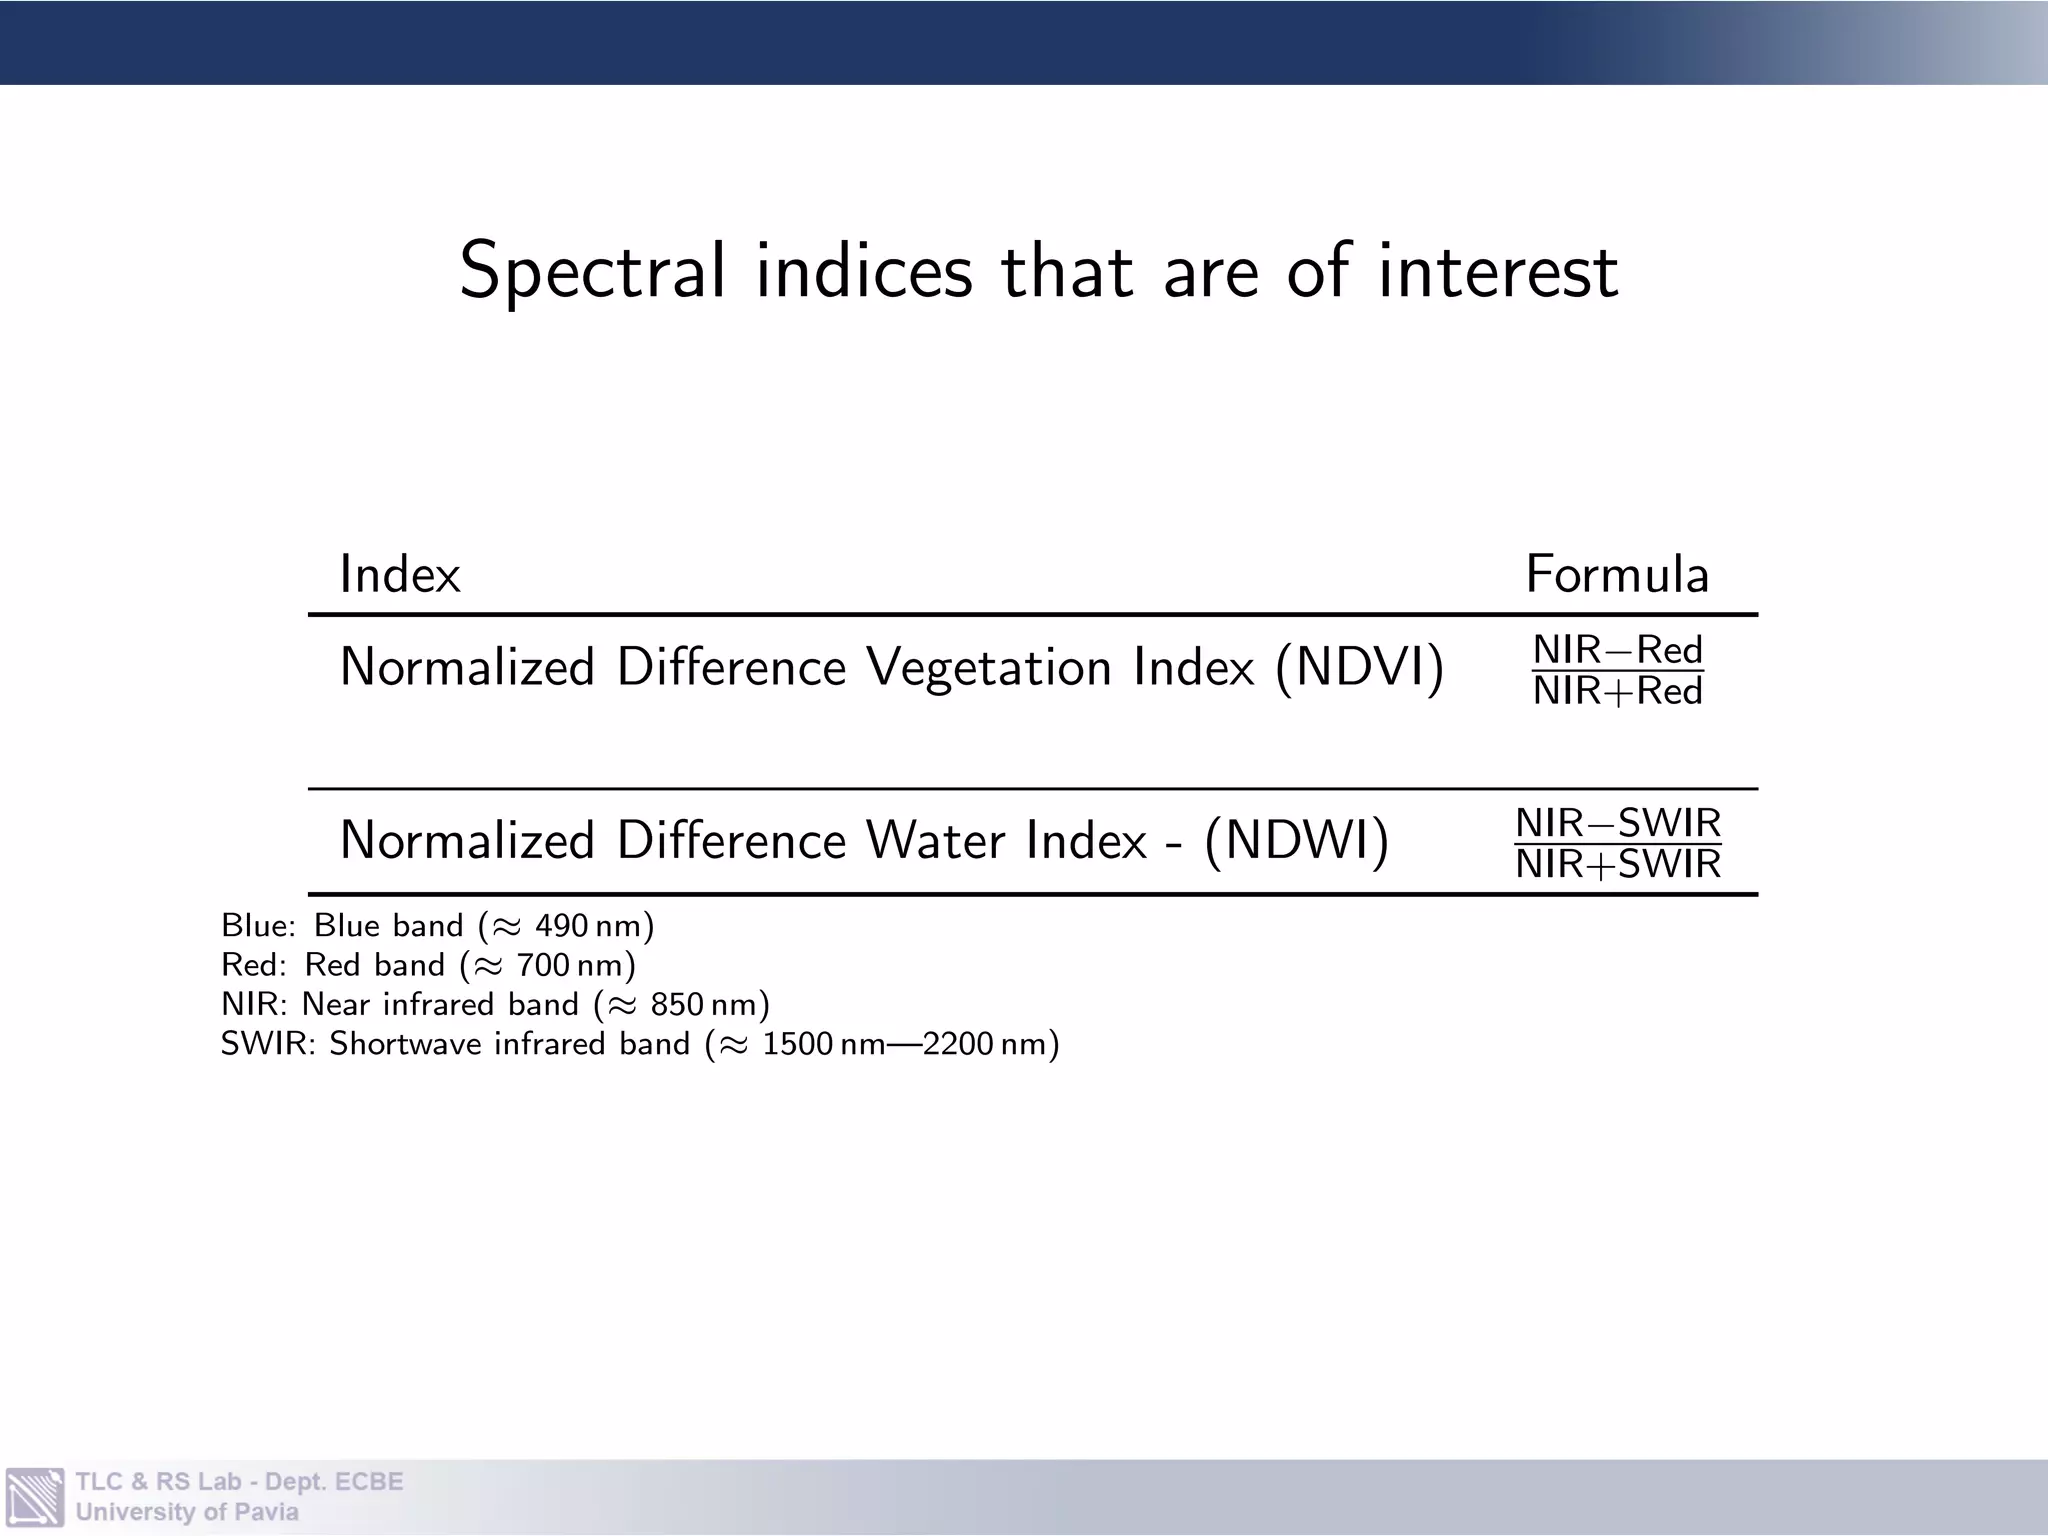
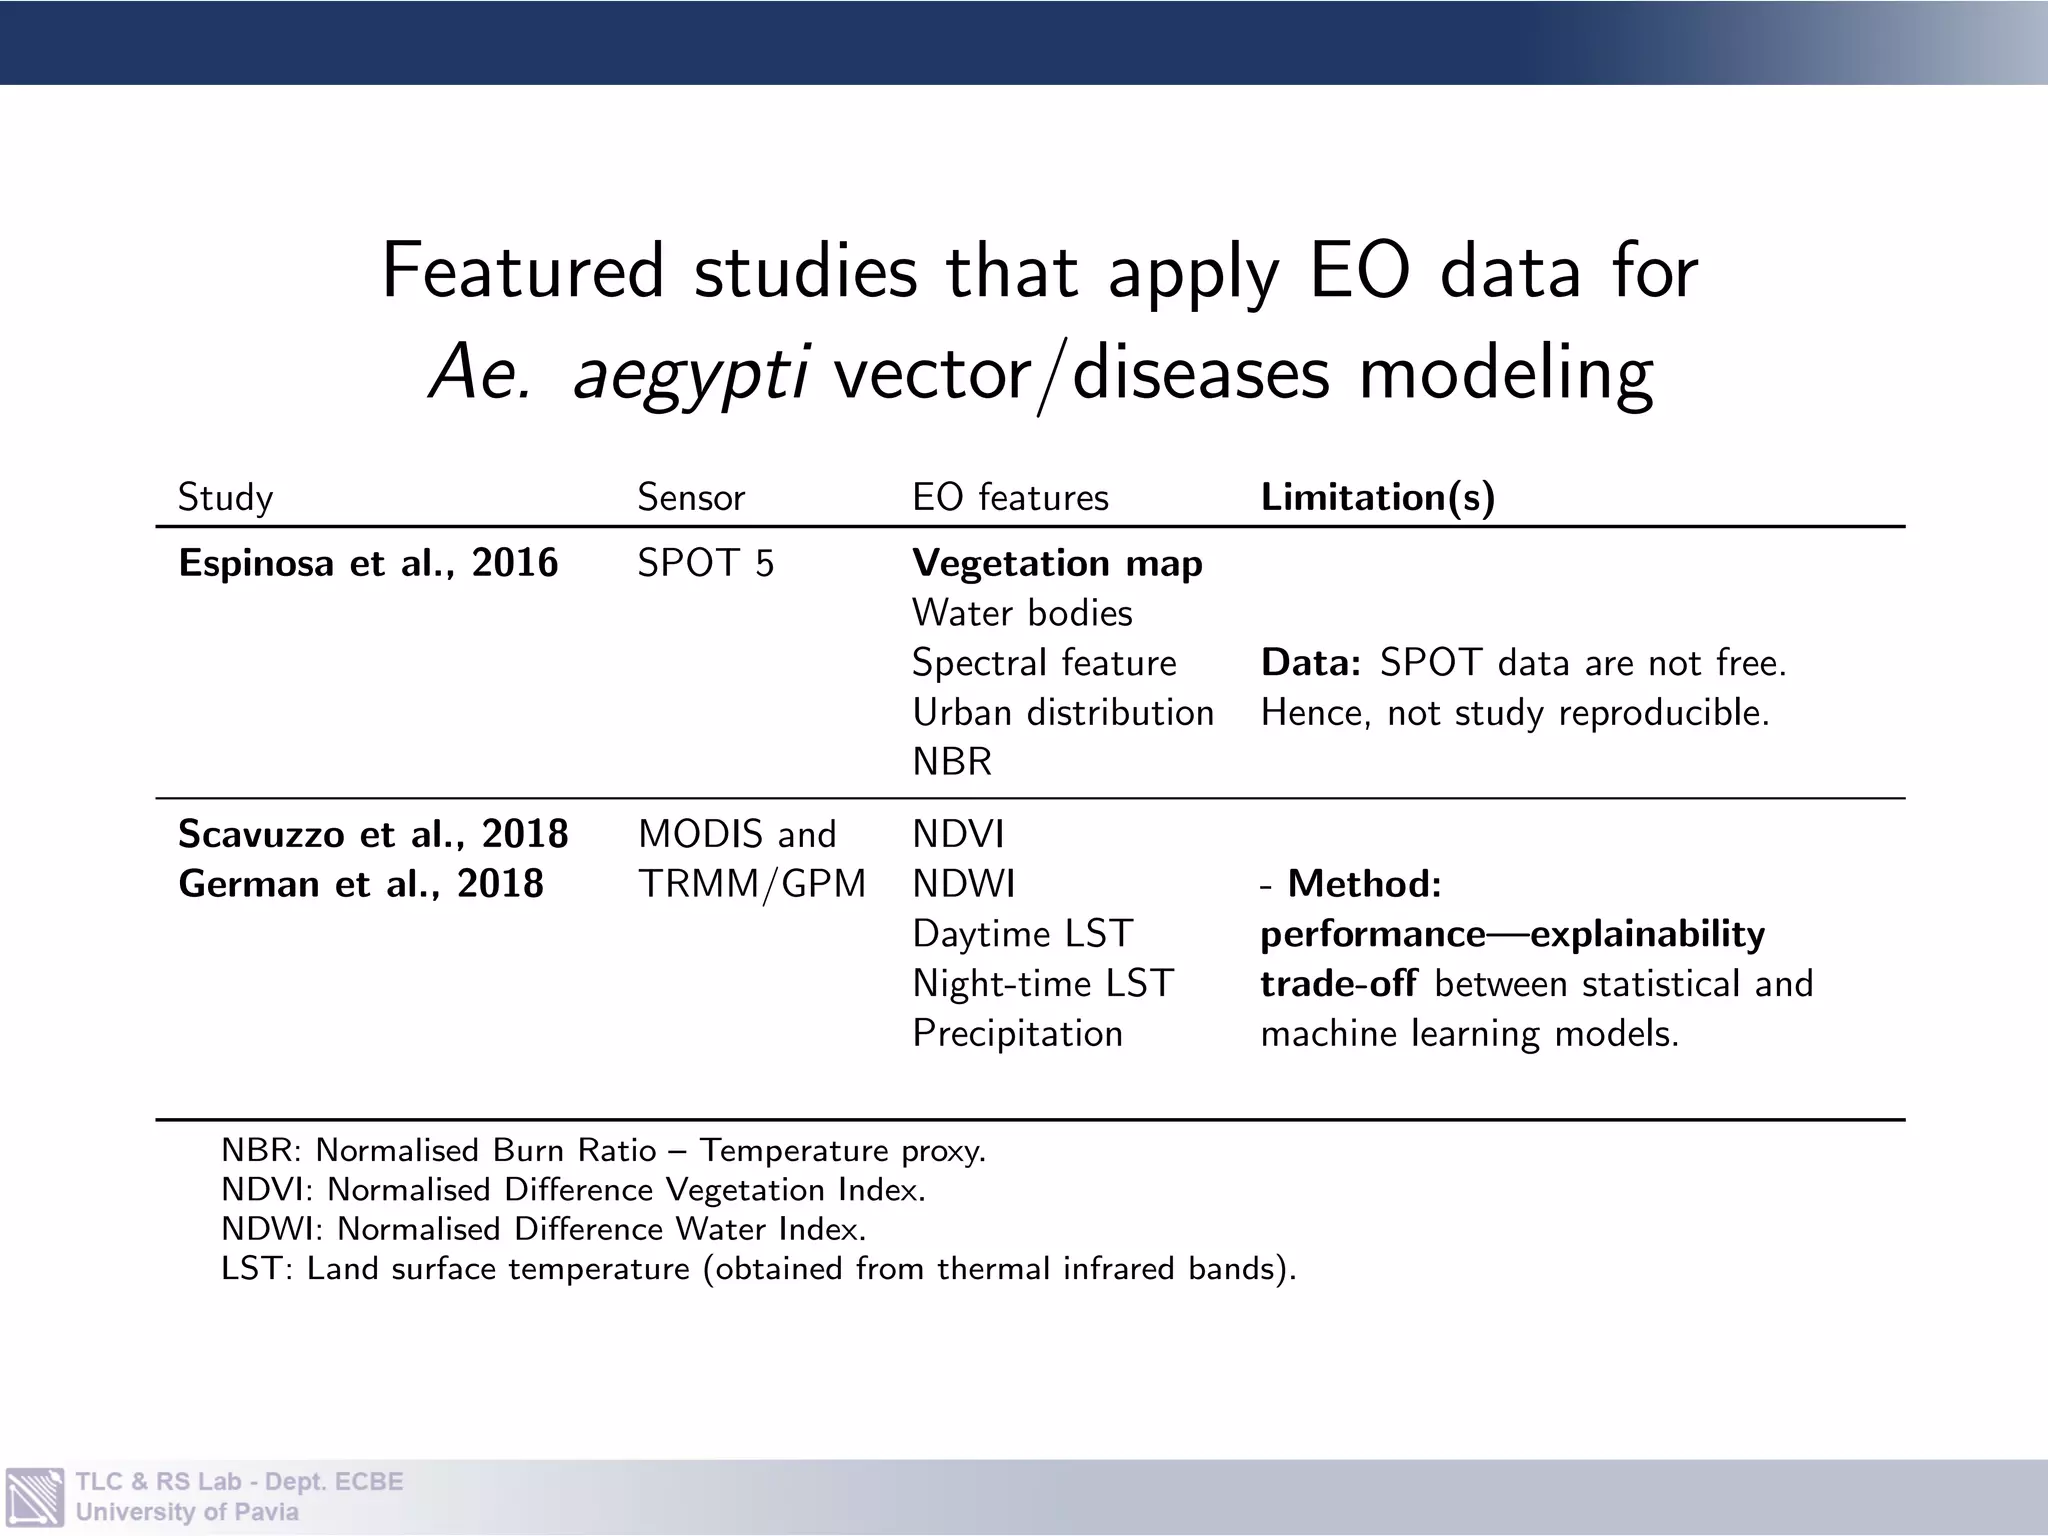
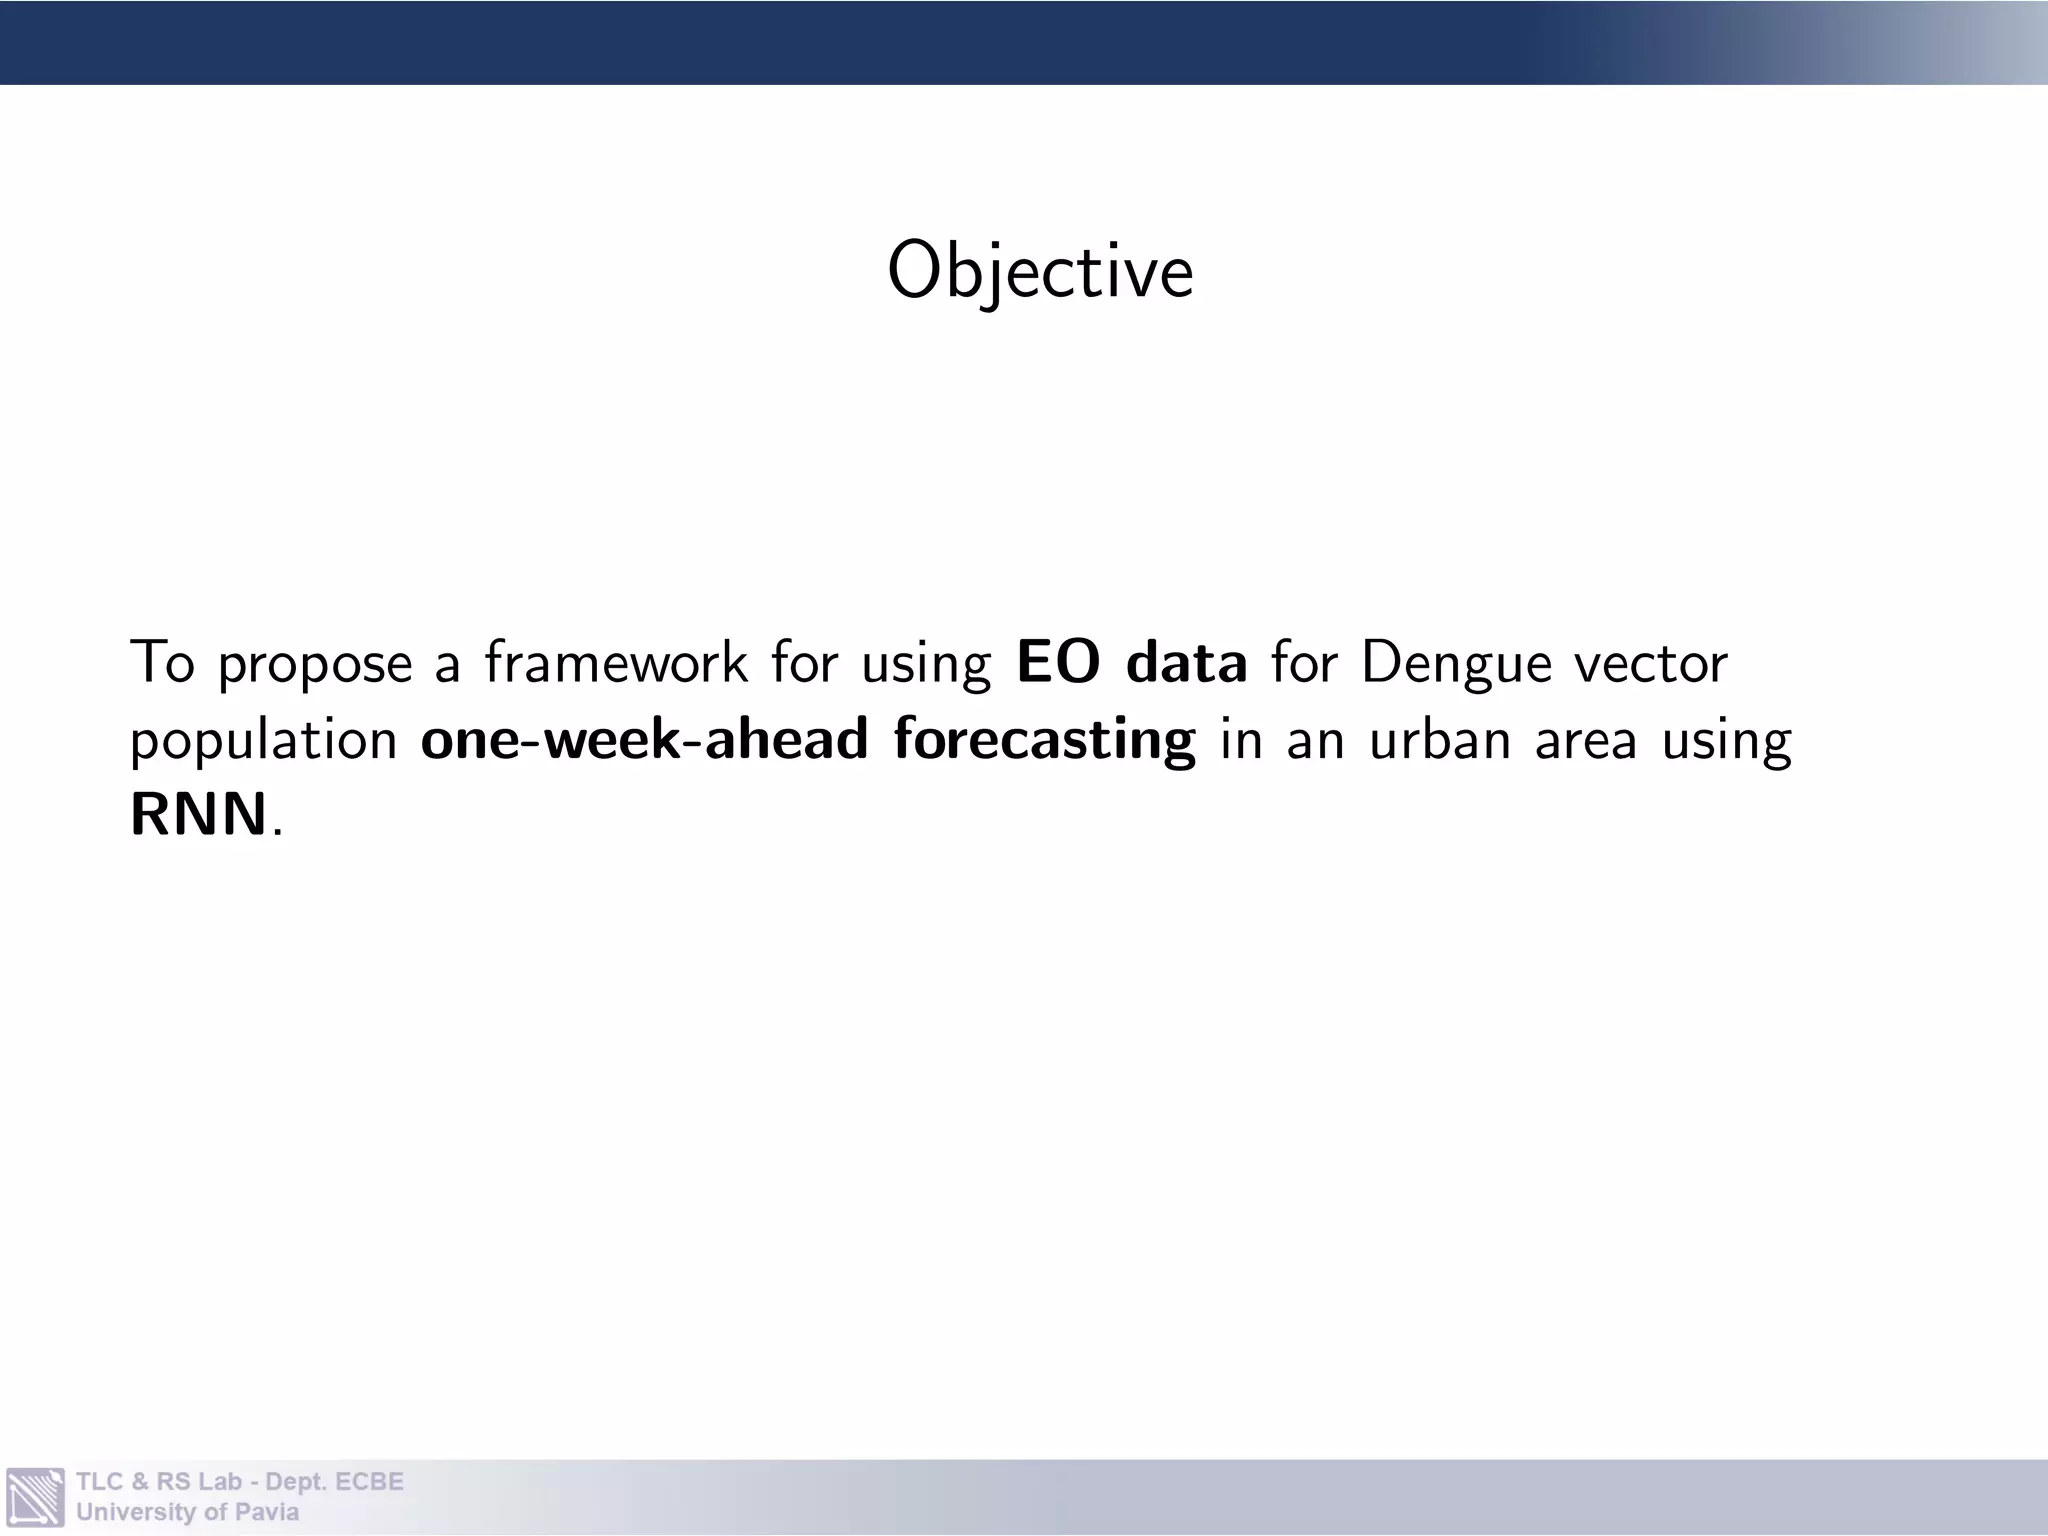
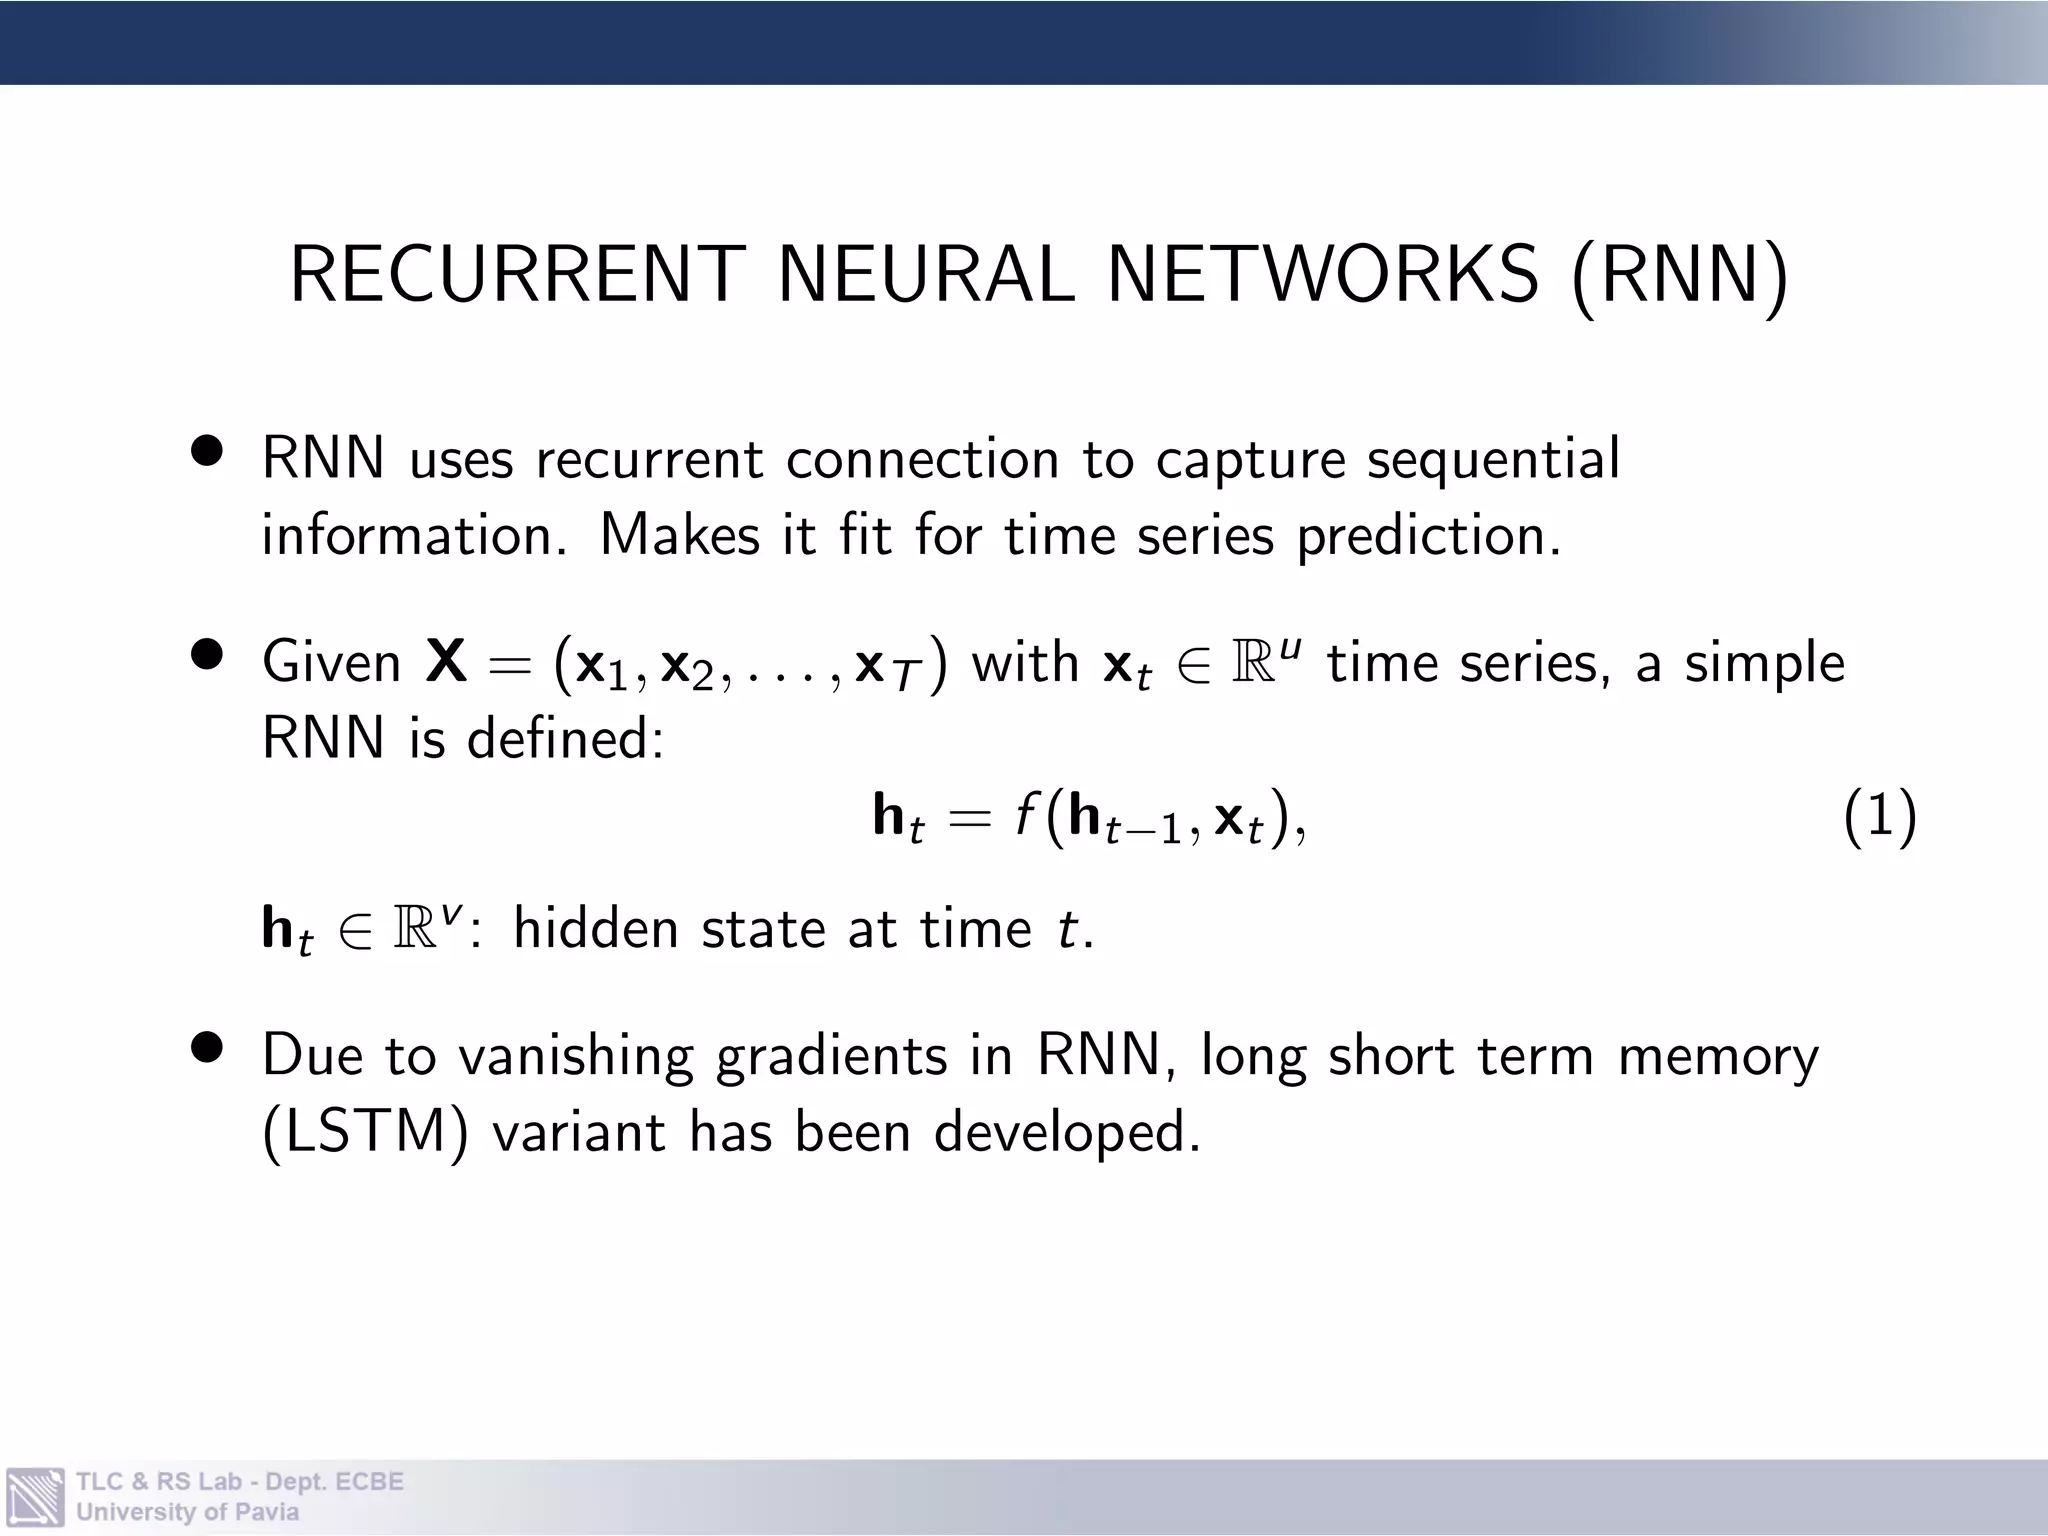
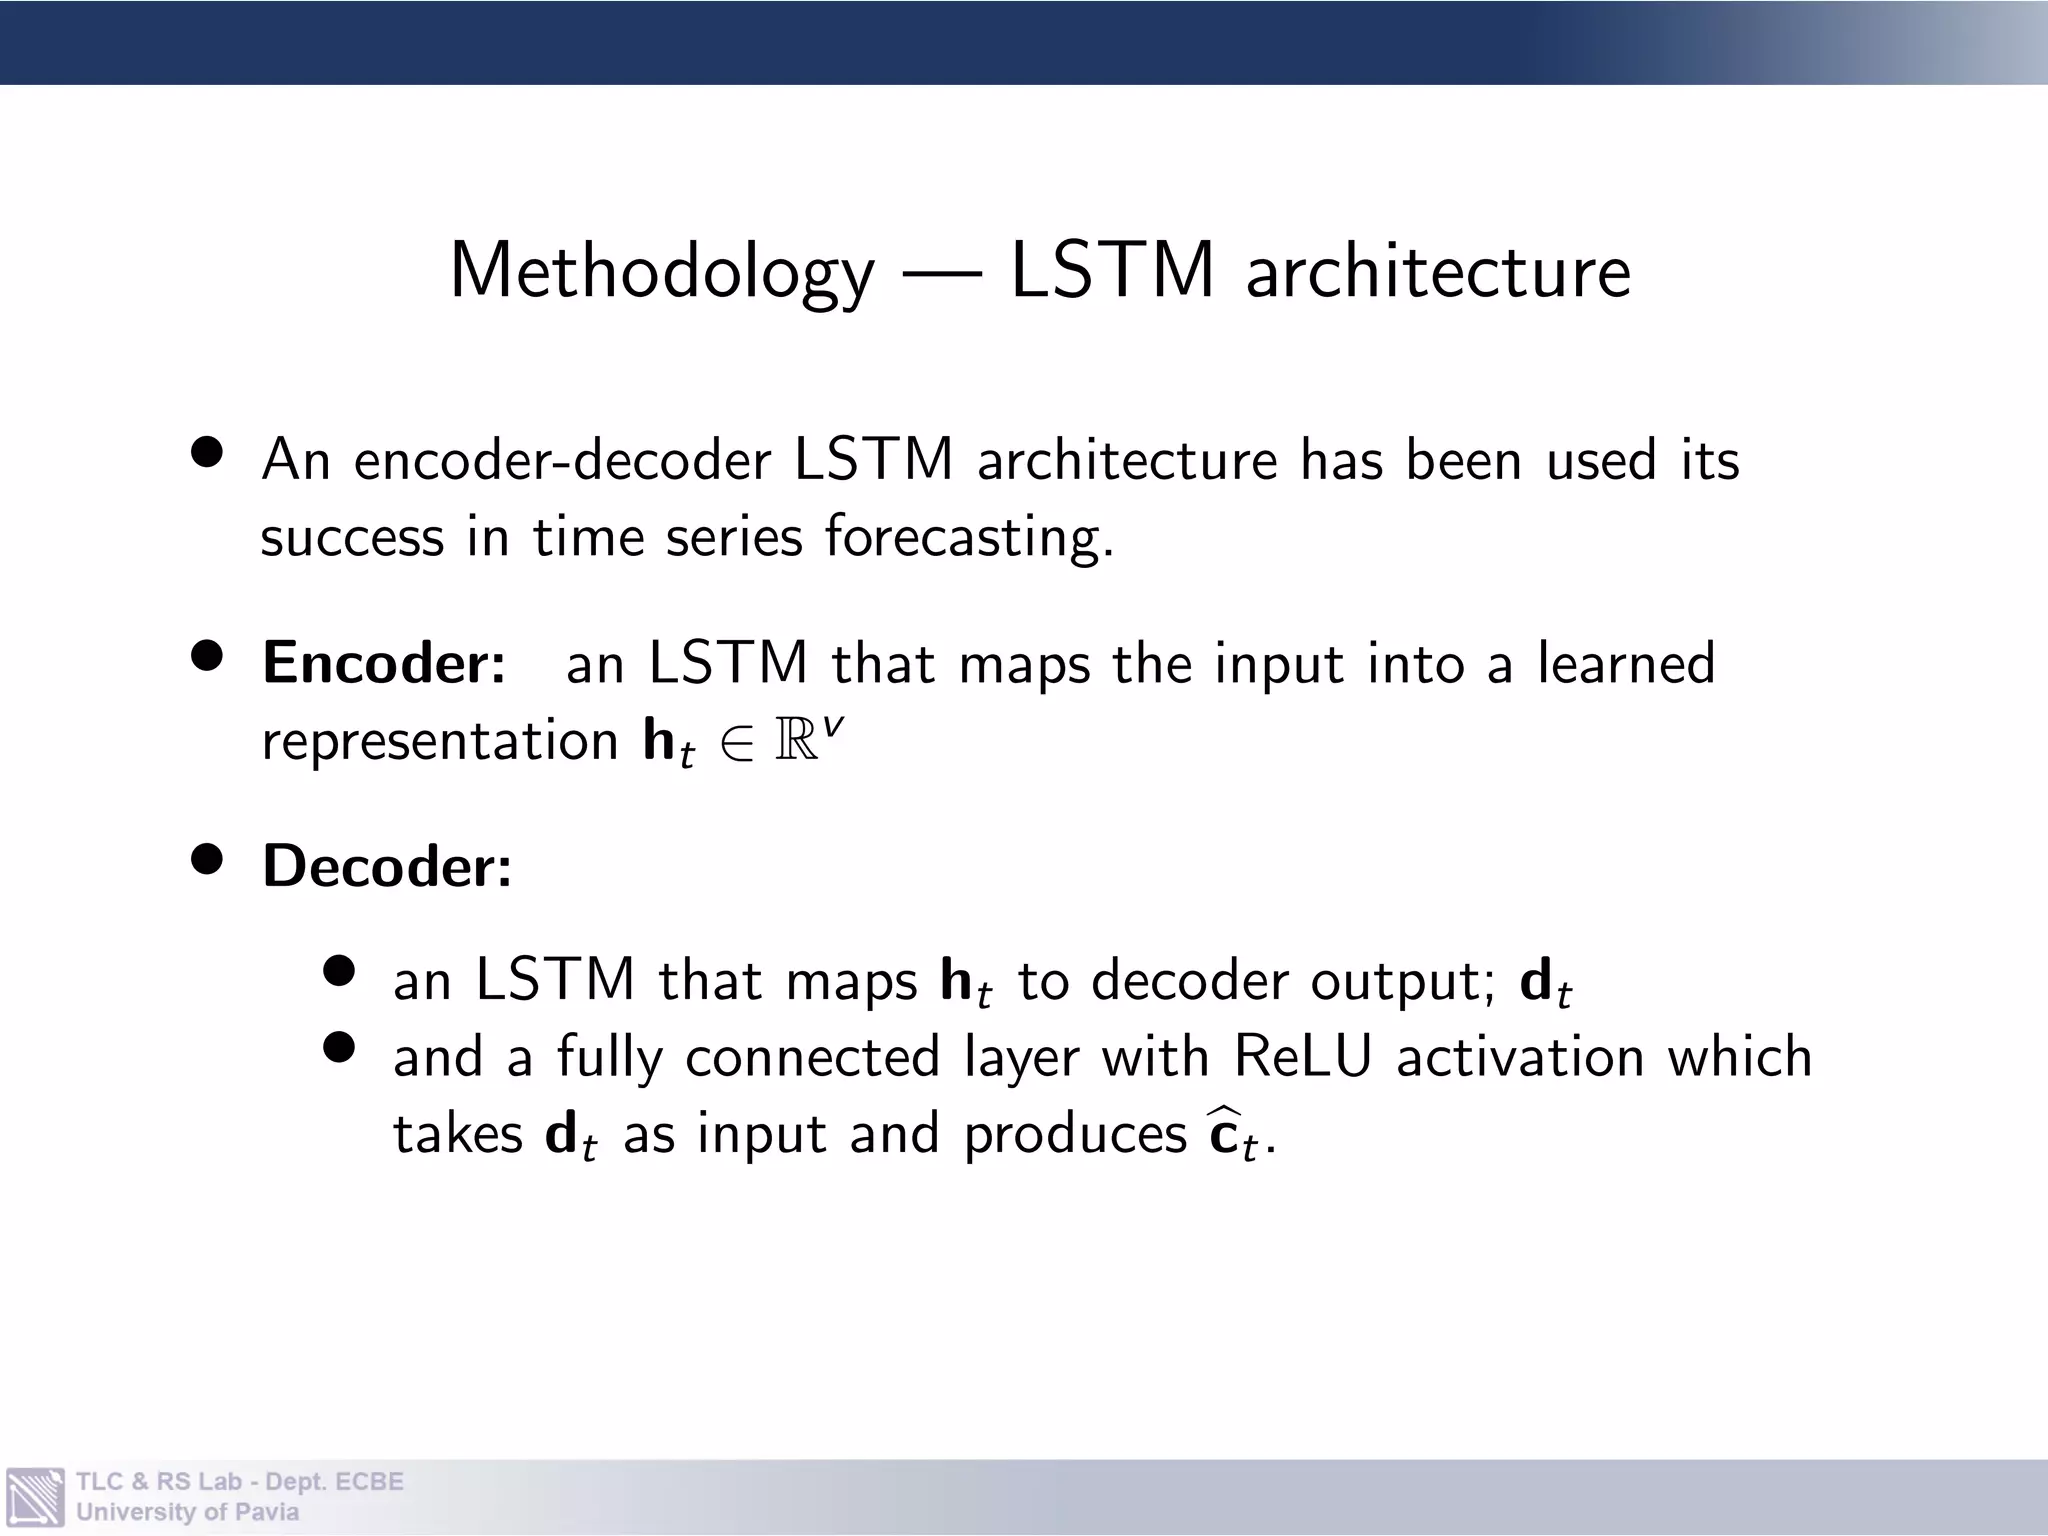
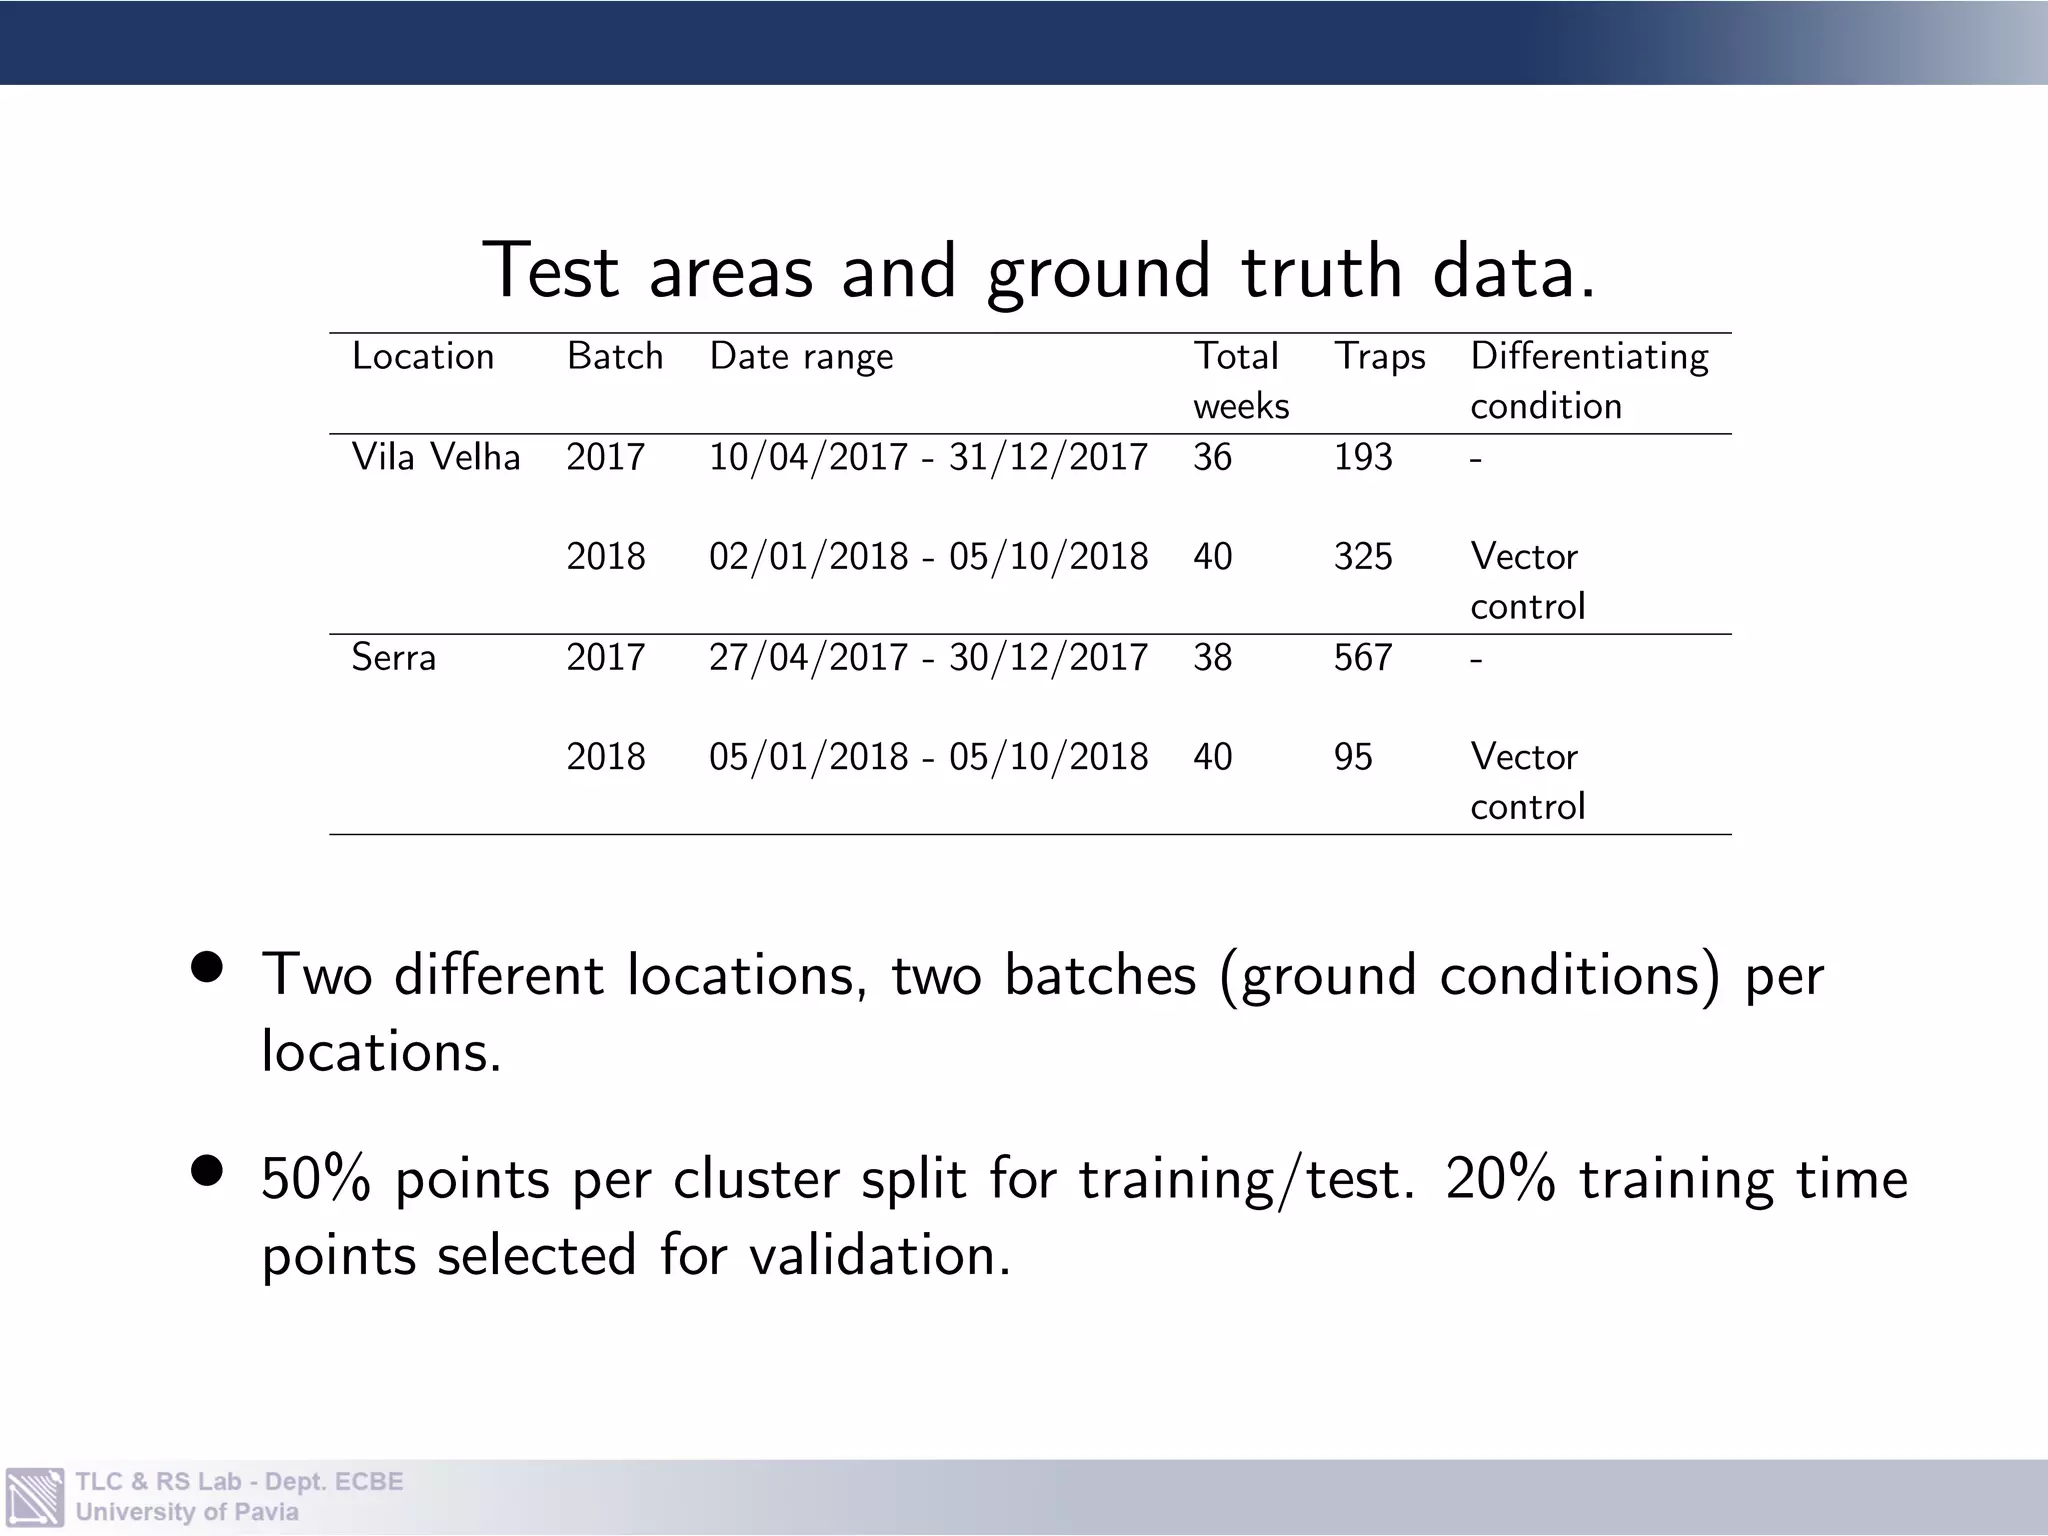
The document describes a methodology for forecasting dengue vector populations one week ahead using multi-source earth observation data and recurrent neural networks. The methodology clusters mosquito population ground truth data using k-means clustering. It then trains an encoder-decoder LSTM neural network on time series data of earth observation features means for each cluster. The model is tested against random forest and k-nearest neighbor models on data from two locations in Brazil. Results show the LSTM model more accurately follows the highest and lowest observed mosquito population values compared to the other models.