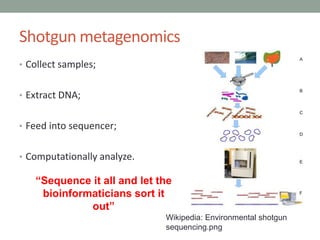
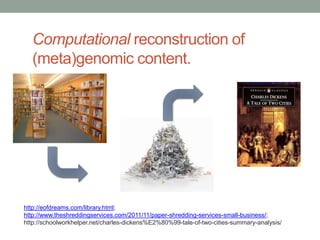
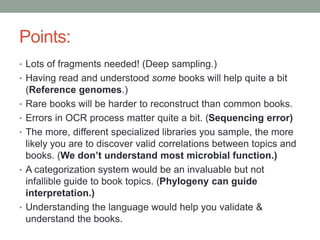
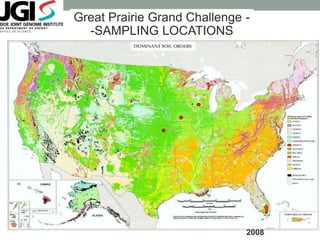
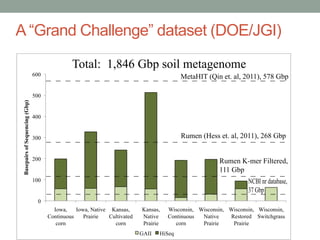
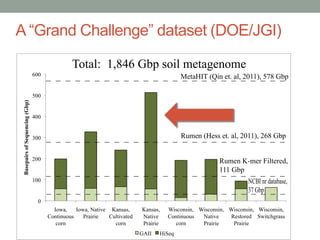
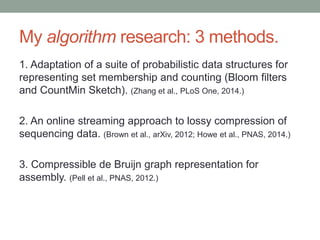
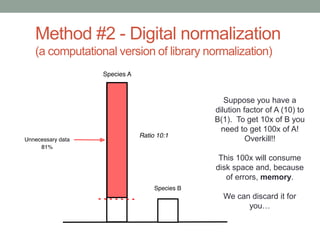
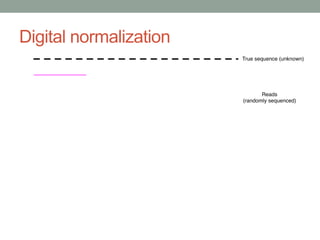
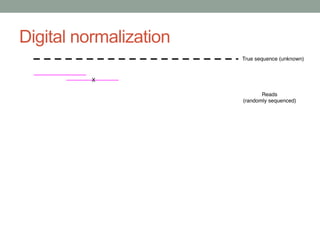
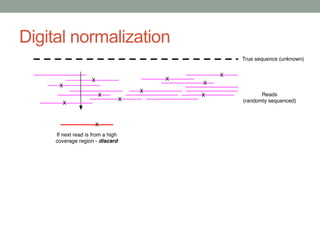
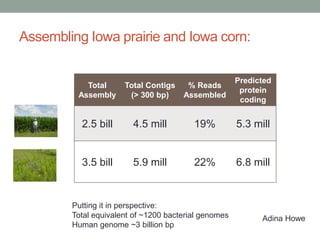
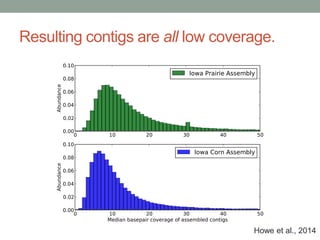
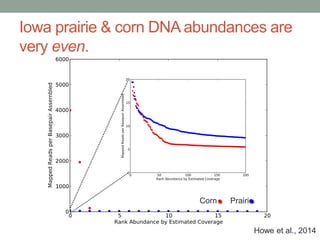
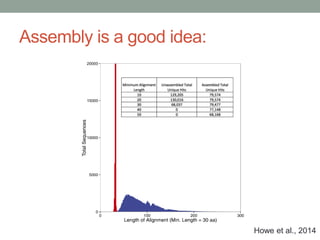
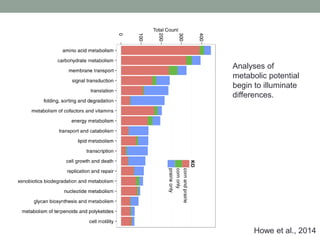
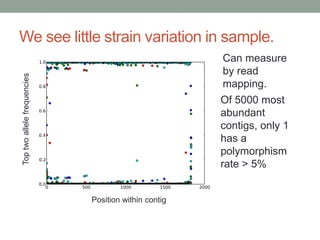
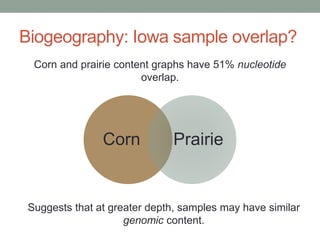
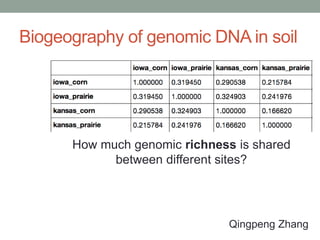
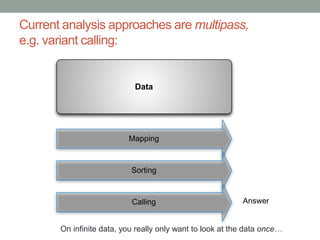
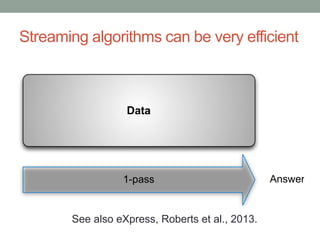
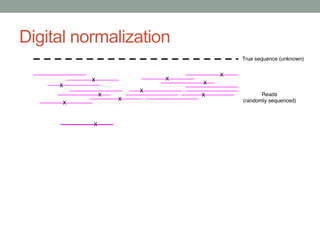
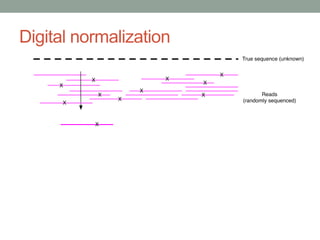
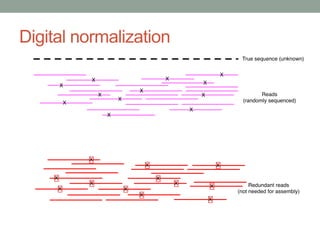
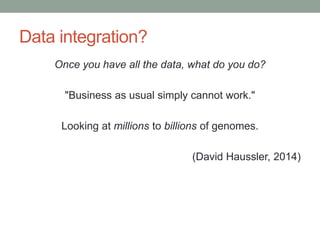
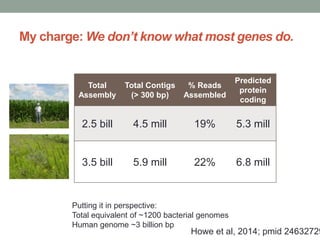
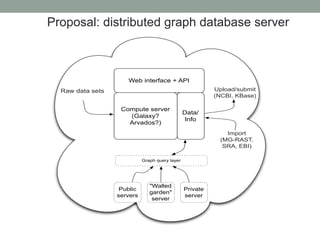
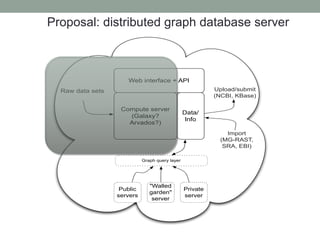
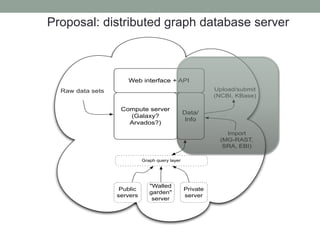
SCALABLE APPROACHES 
TO EXPLORING 
MICROBIAL DIVERSITY 
C. Titus Brown 
ctb@msu.edu 
Asst Professor, MMG / CSE; Michigan State University 
1/15: Population Health & Reproduction, VetMed, UC Davis 
Talk slides on slideshare.net/c.titus.brown
Funding and motivation:
The central question of my lab -- 
How can we most effectively use computation to extract 
information from large sequence data sets, for the purpose 
of better understanding non- and semi-model organisms? 
Focus on environmental microbes, marine animals, 
& agricultural and veterinary animals.
Biology is becoming data rich – and a 
rising tide lifts all boats! 
http://susieinfrance.blogspot.com/2010/06/rising-tide-lifts-all-boats.html
…but sometimes the tide comes in a bit 
fast.
Our foil for today: 
Investigating soil microbial communities 
Life on earth depends on soil microbes, but: 
• 95% or more of soil microbes cannot be cultured in lab. 
• Very little transport in soil and sediment => 
slow mixing rates. 
• Estimates of immense diversity: 
• Billions of microbial cells per gram of soil. 
• Million+ microbial species per gram of soil (Gans et al, 2005) 
• One observed lower bound for genomic sequence complexity => 
26 Gbp (Amazon Rain Forest Microbial Observatory)
“By 'soil' we understand (Vil'yams, 1931) a loose surface 
layer of earth capable of yielding plant crops. In the physical 
N. A. Krasil'nikov, SOIL MICROORGANISMS AND HIGHER PLANTS 
http://www.soilandhealth.org/01aglibrary/010112krasil/010112krasil.ptII.h 
tml 
sense the soil represents a complex disperse system 
consisting of three phases: solid, liquid, and gaseous.” 
Microbes live in & on: 
• Surfaces of 
aggregate particles; 
• Pores within 
microaggregates;
Specific questions to address: 
• Role of soil microbes in nutrient cycling? 
• How does agricultural soil differ from native soil? 
• How do soil microbial communities respond to climate 
perturbation? 
• Genome-level questions: 
• What kind of strain-level heterogeneity is present in the population? 
• What are the phage and viral populations & dynamics thereof? 
• What species are where, and how much is shared between 
different geographical locations?
Must use culture independent and 
metagenomic approaches 
• Many reasons why you can’t or don’t want to culture: 
Cross-feeding, niche specificity, dormancy, etc. 
• If you want to get at underlying function, 16s analysis 
alone is not sufficient. 
Single-cell sequencing & shotgun metagenomics are two 
common ways to investigate complex microbial communities.
Shotgun metagenomics 
• Collect samples; 
• Extract DNA; 
• Feed into sequencer; 
• Computationally analyze. 
“Sequence it all and let the 
bioinformaticians sort it 
Wikipedia: Environmental shotgun 
sequencing.png 
out”
Computational reconstruction of 
(meta)genomic content. 
http://eofdreams.com/library.html; 
http://www.theshreddingservices.com/2011/11/paper-shredding-services-small-business/; 
http://schoolworkhelper.net/charles-dickens%E2%80%99-tale-of-two-cities-summary-analysis/
Points: 
• Lots of fragments needed! (Deep sampling.) 
• Having read and understood some books will help quite a bit 
(Reference genomes.) 
• Rare books will be harder to reconstruct than common books. 
• Errors in OCR process matter quite a bit. (Sequencing error) 
• The more, different specialized libraries you sample, the more 
likely you are to discover valid correlations between topics and 
books. (We don’t understand most microbial function.) 
• A categorization system would be an invaluable but not 
infallible guide to book topics. (Phylogeny can guide 
interpretation.) 
• Understanding the language would help you validate & 
understand the books.
Great Prairie Grand Challenge - 
-SAMPLING LOCATIONS 
2008
A “Grand Challenge” dataset (DOE/JGI) 
600 
500 
400 
300 
200 
100 
0 
Iowa, 
Continuous 
corn 
Iowa, Native 
Prairie 
Kansas, 
Cultivated 
corn 
Kansas, 
Native 
Prairie 
MetaHIT (Qin et. al, 2011), 578 Gbp 
Wisconsin, 
Continuous 
corn 
Wisconsin, 
Native 
Prairie 
Wisconsin, 
Restored 
Prairie 
Wisconsin, 
Switchgrass 
Basepairs of Sequencing (Gbp) 
GAII HiSeq 
Rumen (Hess et. al, 2011), 268 Gbp 
NCBI nr database, 
37 Gbp 
Total: 1,846 Gbp soil metagenome 
Rumen K-mer Filtered, 
111 Gbp
My algorithm research: 3 methods. 
1. Adaptation of a suite of probabilistic data structures for 
representing set membership and counting (Bloom filters 
and CountMin Sketch). (Zhang et al., PLoS One, 2014.) 
2. An online streaming approach to lossy compression of 
sequencing data. (Brown et al., arXiv, 2012; Howe et al., PNAS, 2014.) 
3. Compressible de Bruijn graph representation for 
assembly. (Pell et al., PNAS, 2012.)
Method #2 - Digital normalization 
(a computational version of library normalization) 
Suppose you have a 
dilution factor of A (10) to 
B(1). To get 10x of B you 
need to get 100x of A! 
Overkill!! 
This 100x will consume 
disk space and, because 
of errors, memory. 
We can discard it for 
you…
Digital normalization
Assembling Iowa prairie and Iowa corn: 
Total 
Assembly 
Total Contigs 
(> 300 bp) 
% Reads 
Assembled 
Putting it in perspective: 
Total equivalent of ~1200 bacterial genomes 
Human genome ~3 billion bp 
Predicted 
protein 
coding 
2.5 bill 4.5 mill 19% 5.3 mill 
3.5 bill 5.9 mill 22% 6.8 mill 
Adina Howe
Resulting contigs are all low coverage. 
Howe et al., 2014 
Figure11: Coverage (median basepair) dist ribut ion of assembled cont igs from soil metagenomes.
Iowa prairie & corn DNA abundances are 
very even. 
Corn Prairie 
Howe et al., 2014
Assembly is a good idea: 
Howe et al., 2014
Analyses of 
metabolic potential 
begin to illuminate 
differences. 
Howe et al., 2014
We see little strain variation in sample. 
Top two allele frequencies 
Position within contig 
Can measure 
by read 
mapping. 
Of 5000 most 
abundant 
contigs, only 1 
has a 
polymorphism 
rate > 5%
Biogeography: Iowa sample overlap? 
Corn and prairie content graphs have 51% nucleotide 
overlap. 
Corn Prairie 
Suggests that at greater depth, samples may have similar 
genomic content.
Biogeography of genomic DNA in soil 
How much genomic richness is shared 
between different sites? 
Qingpeng Zhang
So, for soil: 
• We really do need more data; 
• But at least now we can assemble what we already have. 
• Estimate required sequencing depth at 50 Tbp; 
• Now also have 2-8 Tbp from Amazon Rain Forest 
Microbial Observatory. 
• …still not saturated coverage, but getting closer. 
Iowa soil work has been published: 
Howe et al., 2014, PNAS.
So, for soil: 
Note! There are now much faster assembly approaches…! 
See: Megahit, http://arxiv.org/abs/1409.7208 
(Technology marches on!)
So, for soil: 
• We really do need more data; 
• But at least now we can assemble what we already have. 
• Estimate required sequencing depth at 50 Tbp; 
• Now also have 2-8 Tbp from Amazon Rain Forest 
Microbial Observatory. 
• …still not saturated coverage, but getting closer. 
But, diginorm approach turns out to also be widely 
useful.
Digital normalization is popular… 
Estimated ~1000 users of our software. 
Diginorm algorithm now included in Trinity 
software from Broad Institute (~10,000 users) 
Illumina TruSeq long-read technology now 
incorporates our approach (~100,000 users)
The data problem: Looking forward 5 
years… 
Navin et al., 2011
Some basic math: 
• 1000 single cells from a tumor… 
• …sequenced to 40x haploid coverage with Illumina… 
• …yields 120 Gbp each cell… 
• …or 120 Tbp of data. 
• HiSeq X10 can do the sequencing in ~3 weeks. 
• The variant calling will require 2,000 CPU weeks… 
• …so, given ~2,000 computers, can do this all in one 
month.
Similar math applies: 
• Pathogen detection in blood; 
• Environmental sequencing; 
• Sequencing rare DNA from circulating blood. 
• Two issues: 
•Volume of data & compute 
infrastructure; 
• Latency for clinical applications.
We face an infinite data problem. 
• For all intents and purposes 
• For example, Illumina estimates that 228,000 human 
genomes will be resequenced this year, primarily by 
researchers; this is only going to grow. 
• Similar stories across all of biology (although #s lower :)
Current analysis approaches are multipass, 
e.g. variant calling: 
Data 
Mapping 
Sorting 
Calling Answer 
On infinite data, you really only want to look at the data once…
Streaming algorithms can be very efficient 
Data 
1-pass 
Answer 
See also eXpress, Roberts et al., 2013.
Some key points -- 
• Digital normalization is streaming. 
• Digital normalizing is computationally efficient (lower 
memory than other approaches; parallelizable/multicore; 
single-pass) 
• Currently, primarily used for prefiltering for assembly, but 
relies on underlying abstraction (De Bruijn graph) that is 
also used in variant calling.
Digital normalization
Some key points -- 
• Digital normalization is streaming. 
• Digital normalizing is computationally efficient (lower 
memory than other approaches; parallelizable/multicore; 
single-pass) 
• Currently, primarily used for prefiltering for assembly, but 
relies on underlying abstraction (De Bruijn graph) that is 
also used in variant calling.
Error correction as the solution for our ills 
Current work: error correction (??) 
Errors in sequencing data are at the root of many 
problems: 
• Assembly is 100x lower memory in the absence of errors. 
• Mapping is computationally trivial when there are no 
errors. 
• Variant calling and genotyping become simple, as does 
species detection.
We can error correct high-coverage shotgun data 
with k-mer spectra: 
Chaisson et al., 2009 
True k-mers 
Erroneous k-mers
Streaming error correction on E. coli data 
(Early days…) 
TP FP TN FN 
1% error rate, 100x coverage. 
Michael Crusoe, Jordan Fish, Jason Pell 
Error 
correction 3,494,631 3,865 460,601,171 5,533 
(corrected) (mistakes) (OK) (missed)
Error correction  variant calling 
Single pass, reference free, tunable, streaming 
online variant calling.
Streaming with reads… 
Sequence... 
Graph 
Sequence... 
Sequence... 
Sequence... 
Sequence... 
Sequence... 
Sequence... 
Sequence... 
.... 
Variants
Analysis is done after sequencing. 
Sequencing Analysis
Streaming with bases 
k bases... 
Graph 
k+1 
k bases... k+1 
k+2 
k bases... k+1 
k bases... k+1 
k bases... k+1 
... 
k bases... k+1 
Variants
Integrate sequencing and analysis 
Sequencing 
Analysis 
Are we done yet?
What does the future hold? 
• More emphasis on training and infrastructure. 
• Data integration! 
• Identifying the function of unknown genes…
Summer NGS workshop (2010-2017)
The infrastructure challenge 
In 5-10 years, we will have nigh-infinite data. 
(Genomic, transcriptomic, proteomic, metabolomic, 
…?) 
We currently have no good way of querying, 
exploring, investigating, or mining these data sets, 
especially across multiple locations..
Distributed graph database server 
Web interface + API 
Compute server 
(Galaxy? 
Arvados?) 
Data/ 
Info 
Raw data sets 
Public 
servers 
"Walled 
garden" 
server 
Private 
server 
Graph query layer 
Upload/submit 
(NCBI, KBase) 
Import 
(MG-RAST, 
SRA, EBI)
Data integration? 
Once you have all the data, what do you do? 
"Business as usual simply cannot work." 
Looking at millions to billions of genomes. 
(David Haussler, 2014)
My charge: We don’t know what most genes do. 
Total 
Assembly 
Total Contigs 
(> 300 bp) 
% Reads 
Assembled 
Putting it in perspective: 
Total equivalent of ~1200 bacterial genomes 
Human genome ~3 billion bp 
Predicted 
protein 
coding 
2.5 bill 4.5 mill 19% 5.3 mill 
3.5 bill 5.9 mill 22% 6.8 mill 
Howe et al, 2014; pmid 24632729
Data Intensive Biology 
Opportunities & challenges; how can we best support the 
biology? 
"I have traveled the length and breadth of this 
country and talked with the best people, and I can 
assure you that data processing is a fad that won't 
last out the year." --The editor in charge of business 
books for Prentice Hall, 1957
Thanks! 
Key points: 
• Facing nigh-infinite data situation; 
• The first stages of sequence analysis, assembly and variant 
calling, are computationally intensive (but we’re hoping to fix 
that); 
• Training in data intensive biology is critical to the future of 
biology. 
• Data sharing and data integration infrastructure is also critical.
Graph alignment can detect read saturation
Proposal: distributed graph database server 
Web interface + API 
Compute server 
(Galaxy? 
Arvados?) 
Data/ 
Info 
Raw data sets 
Public 
servers 
"Walled 
garden" 
server 
Private 
server 
Graph query layer 
Upload/submit 
(NCBI, KBase) 
Import 
(MG-RAST, 
SRA, EBI)
Proposal: distributed graph database server 
Web interface + API 
Compute server 
(Galaxy? 
Arvados?) 
Data/ 
Info 
Raw data sets 
Public 
servers 
"Walled 
garden" 
server 
Private 
server 
Graph query layer 
Upload/submit 
(NCBI, KBase) 
Import 
(MG-RAST, 
SRA, EBI)
Proposal: distributed graph database server 
Web interface + API 
Compute server 
(Galaxy? 
Arvados?) 
Data/ 
Info 
Raw data sets 
Public 
servers 
"Walled 
garden" 
server 
Private 
server 
Graph query layer 
Upload/submit 
(NCBI, KBase) 
Import 
(MG-RAST, 
SRA, EBI)
Proposal: distributed graph database server 
Web interface + API 
Compute server 
(Galaxy? 
Arvados?) 
Data/ 
Info 
Raw data sets 
Public 
servers 
"Walled 
garden" 
server 
Private 
server 
Graph query layer 
Upload/submit 
(NCBI, KBase) 
Import 
(MG-RAST, 
SRA, EBI)
Graph queries 
across public & walled-garden data sets: 
assembled 
sequence 
SIMILARITY TO ALSO CONTAINS 
nitrite 
reductase 
ppaZ 
raw 
sequence 
See Lee, 
Alekseyenko, Brown, 
paper in SciPy 2009: 
the “pygr” project.

2014 nyu-bio-talk

  • 1.
    SCALABLE APPROACHES TOEXPLORING MICROBIAL DIVERSITY C. Titus Brown ctb@msu.edu Asst Professor, MMG / CSE; Michigan State University 1/15: Population Health & Reproduction, VetMed, UC Davis Talk slides on slideshare.net/c.titus.brown
  • 2.
  • 3.
    The central questionof my lab -- How can we most effectively use computation to extract information from large sequence data sets, for the purpose of better understanding non- and semi-model organisms? Focus on environmental microbes, marine animals, & agricultural and veterinary animals.
  • 4.
    Biology is becomingdata rich – and a rising tide lifts all boats! http://susieinfrance.blogspot.com/2010/06/rising-tide-lifts-all-boats.html
  • 5.
    …but sometimes thetide comes in a bit fast.
  • 6.
    Our foil fortoday: Investigating soil microbial communities Life on earth depends on soil microbes, but: • 95% or more of soil microbes cannot be cultured in lab. • Very little transport in soil and sediment => slow mixing rates. • Estimates of immense diversity: • Billions of microbial cells per gram of soil. • Million+ microbial species per gram of soil (Gans et al, 2005) • One observed lower bound for genomic sequence complexity => 26 Gbp (Amazon Rain Forest Microbial Observatory)
  • 7.
    “By 'soil' weunderstand (Vil'yams, 1931) a loose surface layer of earth capable of yielding plant crops. In the physical N. A. Krasil'nikov, SOIL MICROORGANISMS AND HIGHER PLANTS http://www.soilandhealth.org/01aglibrary/010112krasil/010112krasil.ptII.h tml sense the soil represents a complex disperse system consisting of three phases: solid, liquid, and gaseous.” Microbes live in & on: • Surfaces of aggregate particles; • Pores within microaggregates;
  • 8.
    Specific questions toaddress: • Role of soil microbes in nutrient cycling? • How does agricultural soil differ from native soil? • How do soil microbial communities respond to climate perturbation? • Genome-level questions: • What kind of strain-level heterogeneity is present in the population? • What are the phage and viral populations & dynamics thereof? • What species are where, and how much is shared between different geographical locations?
  • 9.
    Must use cultureindependent and metagenomic approaches • Many reasons why you can’t or don’t want to culture: Cross-feeding, niche specificity, dormancy, etc. • If you want to get at underlying function, 16s analysis alone is not sufficient. Single-cell sequencing & shotgun metagenomics are two common ways to investigate complex microbial communities.
  • 10.
    Shotgun metagenomics •Collect samples; • Extract DNA; • Feed into sequencer; • Computationally analyze. “Sequence it all and let the bioinformaticians sort it Wikipedia: Environmental shotgun sequencing.png out”
  • 11.
    Computational reconstruction of (meta)genomic content. http://eofdreams.com/library.html; http://www.theshreddingservices.com/2011/11/paper-shredding-services-small-business/; http://schoolworkhelper.net/charles-dickens%E2%80%99-tale-of-two-cities-summary-analysis/
  • 12.
    Points: • Lotsof fragments needed! (Deep sampling.) • Having read and understood some books will help quite a bit (Reference genomes.) • Rare books will be harder to reconstruct than common books. • Errors in OCR process matter quite a bit. (Sequencing error) • The more, different specialized libraries you sample, the more likely you are to discover valid correlations between topics and books. (We don’t understand most microbial function.) • A categorization system would be an invaluable but not infallible guide to book topics. (Phylogeny can guide interpretation.) • Understanding the language would help you validate & understand the books.
  • 13.
    Great Prairie GrandChallenge - -SAMPLING LOCATIONS 2008
  • 14.
    A “Grand Challenge”dataset (DOE/JGI) 600 500 400 300 200 100 0 Iowa, Continuous corn Iowa, Native Prairie Kansas, Cultivated corn Kansas, Native Prairie MetaHIT (Qin et. al, 2011), 578 Gbp Wisconsin, Continuous corn Wisconsin, Native Prairie Wisconsin, Restored Prairie Wisconsin, Switchgrass Basepairs of Sequencing (Gbp) GAII HiSeq Rumen (Hess et. al, 2011), 268 Gbp NCBI nr database, 37 Gbp Total: 1,846 Gbp soil metagenome Rumen K-mer Filtered, 111 Gbp
  • 15.
    A “Grand Challenge”dataset (DOE/JGI) 600 500 400 300 200 100 0 Iowa, Continuous corn Iowa, Native Prairie Kansas, Cultivated corn Kansas, Native Prairie MetaHIT (Qin et. al, 2011), 578 Gbp Wisconsin, Continuous corn Wisconsin, Native Prairie Wisconsin, Restored Prairie Wisconsin, Switchgrass Basepairs of Sequencing (Gbp) GAII HiSeq Rumen (Hess et. al, 2011), 268 Gbp NCBI nr database, 37 Gbp Total: 1,846 Gbp soil metagenome Rumen K-mer Filtered, 111 Gbp
  • 16.
    My algorithm research:3 methods. 1. Adaptation of a suite of probabilistic data structures for representing set membership and counting (Bloom filters and CountMin Sketch). (Zhang et al., PLoS One, 2014.) 2. An online streaming approach to lossy compression of sequencing data. (Brown et al., arXiv, 2012; Howe et al., PNAS, 2014.) 3. Compressible de Bruijn graph representation for assembly. (Pell et al., PNAS, 2012.)
  • 17.
    Method #2 -Digital normalization (a computational version of library normalization) Suppose you have a dilution factor of A (10) to B(1). To get 10x of B you need to get 100x of A! Overkill!! This 100x will consume disk space and, because of errors, memory. We can discard it for you…
  • 18.
  • 19.
  • 20.
  • 21.
  • 22.
  • 23.
  • 24.
    Assembling Iowa prairieand Iowa corn: Total Assembly Total Contigs (> 300 bp) % Reads Assembled Putting it in perspective: Total equivalent of ~1200 bacterial genomes Human genome ~3 billion bp Predicted protein coding 2.5 bill 4.5 mill 19% 5.3 mill 3.5 bill 5.9 mill 22% 6.8 mill Adina Howe
  • 25.
    Resulting contigs areall low coverage. Howe et al., 2014 Figure11: Coverage (median basepair) dist ribut ion of assembled cont igs from soil metagenomes.
  • 26.
    Iowa prairie &corn DNA abundances are very even. Corn Prairie Howe et al., 2014
  • 27.
    Assembly is agood idea: Howe et al., 2014
  • 28.
    Analyses of metabolicpotential begin to illuminate differences. Howe et al., 2014
  • 29.
    We see littlestrain variation in sample. Top two allele frequencies Position within contig Can measure by read mapping. Of 5000 most abundant contigs, only 1 has a polymorphism rate > 5%
  • 30.
    Biogeography: Iowa sampleoverlap? Corn and prairie content graphs have 51% nucleotide overlap. Corn Prairie Suggests that at greater depth, samples may have similar genomic content.
  • 31.
    Biogeography of genomicDNA in soil How much genomic richness is shared between different sites? Qingpeng Zhang
  • 32.
    So, for soil: • We really do need more data; • But at least now we can assemble what we already have. • Estimate required sequencing depth at 50 Tbp; • Now also have 2-8 Tbp from Amazon Rain Forest Microbial Observatory. • …still not saturated coverage, but getting closer. Iowa soil work has been published: Howe et al., 2014, PNAS.
  • 33.
    So, for soil: Note! There are now much faster assembly approaches…! See: Megahit, http://arxiv.org/abs/1409.7208 (Technology marches on!)
  • 34.
    So, for soil: • We really do need more data; • But at least now we can assemble what we already have. • Estimate required sequencing depth at 50 Tbp; • Now also have 2-8 Tbp from Amazon Rain Forest Microbial Observatory. • …still not saturated coverage, but getting closer. But, diginorm approach turns out to also be widely useful.
  • 35.
    Digital normalization ispopular… Estimated ~1000 users of our software. Diginorm algorithm now included in Trinity software from Broad Institute (~10,000 users) Illumina TruSeq long-read technology now incorporates our approach (~100,000 users)
  • 36.
    The data problem:Looking forward 5 years… Navin et al., 2011
  • 37.
    Some basic math: • 1000 single cells from a tumor… • …sequenced to 40x haploid coverage with Illumina… • …yields 120 Gbp each cell… • …or 120 Tbp of data. • HiSeq X10 can do the sequencing in ~3 weeks. • The variant calling will require 2,000 CPU weeks… • …so, given ~2,000 computers, can do this all in one month.
  • 38.
    Similar math applies: • Pathogen detection in blood; • Environmental sequencing; • Sequencing rare DNA from circulating blood. • Two issues: •Volume of data & compute infrastructure; • Latency for clinical applications.
  • 39.
    We face aninfinite data problem. • For all intents and purposes • For example, Illumina estimates that 228,000 human genomes will be resequenced this year, primarily by researchers; this is only going to grow. • Similar stories across all of biology (although #s lower :)
  • 40.
    Current analysis approachesare multipass, e.g. variant calling: Data Mapping Sorting Calling Answer On infinite data, you really only want to look at the data once…
  • 41.
    Streaming algorithms canbe very efficient Data 1-pass Answer See also eXpress, Roberts et al., 2013.
  • 42.
    Some key points-- • Digital normalization is streaming. • Digital normalizing is computationally efficient (lower memory than other approaches; parallelizable/multicore; single-pass) • Currently, primarily used for prefiltering for assembly, but relies on underlying abstraction (De Bruijn graph) that is also used in variant calling.
  • 43.
  • 44.
  • 45.
  • 46.
  • 47.
  • 48.
    Some key points-- • Digital normalization is streaming. • Digital normalizing is computationally efficient (lower memory than other approaches; parallelizable/multicore; single-pass) • Currently, primarily used for prefiltering for assembly, but relies on underlying abstraction (De Bruijn graph) that is also used in variant calling.
  • 49.
    Error correction asthe solution for our ills Current work: error correction (??) Errors in sequencing data are at the root of many problems: • Assembly is 100x lower memory in the absence of errors. • Mapping is computationally trivial when there are no errors. • Variant calling and genotyping become simple, as does species detection.
  • 50.
    We can errorcorrect high-coverage shotgun data with k-mer spectra: Chaisson et al., 2009 True k-mers Erroneous k-mers
  • 51.
    Streaming error correctionon E. coli data (Early days…) TP FP TN FN 1% error rate, 100x coverage. Michael Crusoe, Jordan Fish, Jason Pell Error correction 3,494,631 3,865 460,601,171 5,533 (corrected) (mistakes) (OK) (missed)
  • 54.
    Error correction variant calling Single pass, reference free, tunable, streaming online variant calling.
  • 55.
    Streaming with reads… Sequence... Graph Sequence... Sequence... Sequence... Sequence... Sequence... Sequence... Sequence... .... Variants
  • 56.
    Analysis is doneafter sequencing. Sequencing Analysis
  • 57.
    Streaming with bases k bases... Graph k+1 k bases... k+1 k+2 k bases... k+1 k bases... k+1 k bases... k+1 ... k bases... k+1 Variants
  • 58.
    Integrate sequencing andanalysis Sequencing Analysis Are we done yet?
  • 59.
    What does thefuture hold? • More emphasis on training and infrastructure. • Data integration! • Identifying the function of unknown genes…
  • 60.
  • 61.
    The infrastructure challenge In 5-10 years, we will have nigh-infinite data. (Genomic, transcriptomic, proteomic, metabolomic, …?) We currently have no good way of querying, exploring, investigating, or mining these data sets, especially across multiple locations..
  • 62.
    Distributed graph databaseserver Web interface + API Compute server (Galaxy? Arvados?) Data/ Info Raw data sets Public servers "Walled garden" server Private server Graph query layer Upload/submit (NCBI, KBase) Import (MG-RAST, SRA, EBI)
  • 63.
    Data integration? Onceyou have all the data, what do you do? "Business as usual simply cannot work." Looking at millions to billions of genomes. (David Haussler, 2014)
  • 64.
    My charge: Wedon’t know what most genes do. Total Assembly Total Contigs (> 300 bp) % Reads Assembled Putting it in perspective: Total equivalent of ~1200 bacterial genomes Human genome ~3 billion bp Predicted protein coding 2.5 bill 4.5 mill 19% 5.3 mill 3.5 bill 5.9 mill 22% 6.8 mill Howe et al, 2014; pmid 24632729
  • 65.
    Data Intensive Biology Opportunities & challenges; how can we best support the biology? "I have traveled the length and breadth of this country and talked with the best people, and I can assure you that data processing is a fad that won't last out the year." --The editor in charge of business books for Prentice Hall, 1957
  • 66.
    Thanks! Key points: • Facing nigh-infinite data situation; • The first stages of sequence analysis, assembly and variant calling, are computationally intensive (but we’re hoping to fix that); • Training in data intensive biology is critical to the future of biology. • Data sharing and data integration infrastructure is also critical.
  • 67.
    Graph alignment candetect read saturation
  • 68.
    Proposal: distributed graphdatabase server Web interface + API Compute server (Galaxy? Arvados?) Data/ Info Raw data sets Public servers "Walled garden" server Private server Graph query layer Upload/submit (NCBI, KBase) Import (MG-RAST, SRA, EBI)
  • 69.
    Proposal: distributed graphdatabase server Web interface + API Compute server (Galaxy? Arvados?) Data/ Info Raw data sets Public servers "Walled garden" server Private server Graph query layer Upload/submit (NCBI, KBase) Import (MG-RAST, SRA, EBI)
  • 70.
    Proposal: distributed graphdatabase server Web interface + API Compute server (Galaxy? Arvados?) Data/ Info Raw data sets Public servers "Walled garden" server Private server Graph query layer Upload/submit (NCBI, KBase) Import (MG-RAST, SRA, EBI)
  • 71.
    Proposal: distributed graphdatabase server Web interface + API Compute server (Galaxy? Arvados?) Data/ Info Raw data sets Public servers "Walled garden" server Private server Graph query layer Upload/submit (NCBI, KBase) Import (MG-RAST, SRA, EBI)
  • 72.
    Graph queries acrosspublic & walled-garden data sets: assembled sequence SIMILARITY TO ALSO CONTAINS nitrite reductase ppaZ raw sequence See Lee, Alekseyenko, Brown, paper in SciPy 2009: the “pygr” project.

Editor's Notes

  • #14 Fly-over country (that I live in)
  • #30 Diginorm is a subsampling approach that may help assemble highly polymorphic sequences. Observed levels of variation are quite low relative to e.g. marine free spawning animals.
  • #52 Update from Jordan
  • #61 Lure them in with bioinformatics and then show them that Michigan, in the summertime, is qite nice!
  • #63 Analyze data in cloud; import and export important; connect to other databases.
  • #69 Analyze data in cloud; import and export important; connect to other databases.
  • #70 Analyze data in cloud; import and export important; connect to other databases.
  • #71 Analyze data in cloud; import and export important; connect to other databases.
  • #72 Analyze data in cloud; import and export important; connect to other databases.
  • #73 Set up infrastructure for distributed query; base on graph database concept of standing relationships between data sets.