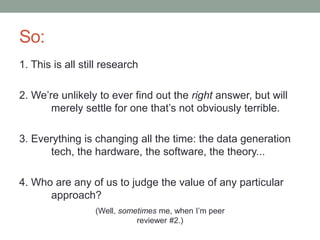
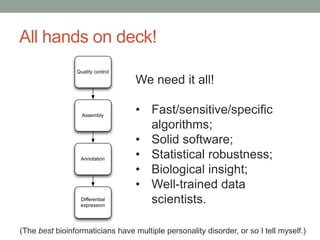
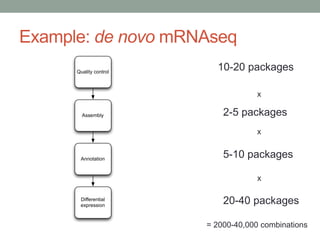
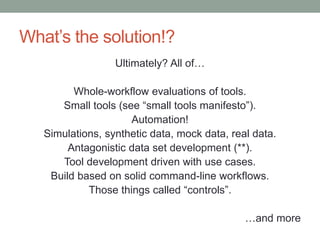
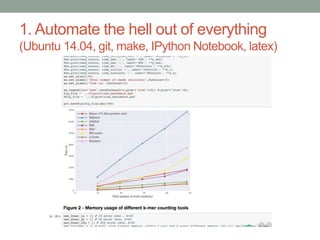
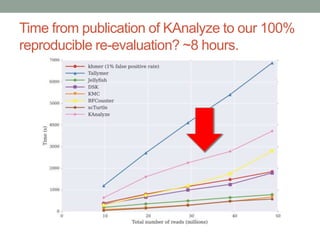
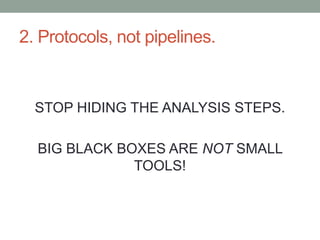
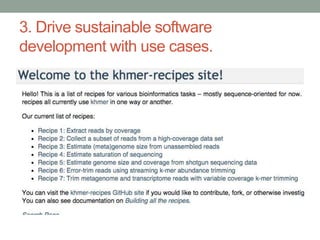
BUILDING BETTER 
BIOINFORMATICS 
SOFTWARE 
(WHY THE HECK NOT?) 
C. Titus Brown 
ctb@msu.edu 
Assistant Professor, MMG / CSE 
Michigan State University
BUILDING BETTER 
BIOINFORMATICS 
SOFTWARE 
(WHY THE HECK NOT?) 
C. Titus Brown 
ctb@msu.edu 
A???????? Professor, VetMed, UC Davis
Lansing, Michigan -> Davis, California
Dot plots FTW! 
Brown et al., 2005.
So I said these things… 
“this tipping point was exacerbated by the loss of about 
80% of the worlds data scientists in the 2021 Great 
California Disruption.” 
“[ Benchmarks ] have proven to be stifling of innovation, 
because of the tendency to do incremental improvement.” 
ivory.idyll.org/blog/2014-bosc-keynote.html
So I said these things… 
“this tipping point was exacerbated by the loss of about 
80% of the worlds data scientists in the 2021 Great 
California Disruption.” 
“[ Benchmarks ] have proven to be stifling of 
innovation, because of the tendency to do incremental 
improvement.” 
ivory.idyll.org/blog/2014-bosc-keynote.html
There is a real problem.
There is a massive profusion of software! 
Mick Watson, @BioMickWatson: 
biomickwatson.wordpress.com/20 
12/12/28/an-embargo-on-short-read- 
alignment-software/ 
jeffvictor.deviantart.com
The players, in caricature: 
1. Computer scientists 
2. Software engineers 
3. Data scientists 
4. Statisticians 
5. Biologists
The Computer Scientist 
Fast, sensitive, specific – pick one.
The (Good) Software Engineer 
Does it have any unit tests?
The Data Scientist 
How quickly can I run it, starting from 
scratch?
The Statistician 
What gives me the best p-value?
The Biologist 
What gives me the most publishable 
result?
Problems all along the way… 
1. Computer scientists: build delicate, hard to use, very high 
performance software that solves the wrong problem. 
2. Software engineers: all work for Google. 
3. Data scientists: uses the wrong programs -- because they’re 
actually usable. 
4. Statisticians: only get invited into the project six months after 
all the data is generated. 
5. Biologists: are desperate to find any one of the above that 
know any biology at all.
Example: de novo mRNAseq 
Quality control 
Assembly 
Annotation 
Differential 
expression 
Every one of these 
steps is still an open 
research problem, 
with computational 
challenges and direct 
biological implications!
So: 
1. This is all still research. 
2. We’re unlikely to ever find out the right answer, but will 
merely settle for one that’s not obviously terrible. 
3. Everything is changing all the time: the data generation 
tech, the hardware, the software, the theory... 
4. Who are any of us to judge the value of any particular 
approach?
So: 
1. This is all still research 
2. We’re unlikely to ever find out the right answer, but will 
merely settle for one that’s not obviously terrible. 
3. Everything is changing all the time: the data generation 
tech, the hardware, the software, the theory... 
4. Who are any of us to judge the value of any particular 
approach? 
(Well, sometimes me, when I’m peer 
reviewer #2.)
All hands on deck! 
Quality control 
Assembly 
Annotation 
Differential 
expression 
We need it all! 
• Fast/sensitive/specific 
algorithms; 
• Solid software; 
• Statistical robustness; 
• Biological insight; 
• Well-trained data 
scientists. 
(The best bioinformaticians have multiple personality disorder, or so I tell myself.)
That sort of explains why. 
But this still leaves us with too many 
choices.
Example: de novo mRNAseq 
Quality control 
Assembly 
Annotation 
Differential 
expression 
10-20 packages 
x 
2-5 packages 
x 
5-10 packages 
x 
20-40 packages 
= 2000-40,000 combinations
What’s the solution!? 
Ultimately? All of… 
Whole-workflow evaluations of tools. 
Small tools (see “small tools manifesto”). 
Automation! 
Simulations, synthetic data, mock data, real data. 
Antagonistic data set development (**). 
Tool development driven with use cases. 
Build based on solid command-line workflows. 
Those things called “controls”. 
…and more
Trying out a few approaches…
1. Automate the hell out of everything 
(Ubuntu 14.04, git, make, IPython Notebook, latex)
Time from publication of KAnalyze to our 100% 
reproducible re-evaluation? ~8 hours.
2. Protocols, not pipelines. 
STOP HIDING THE ANALYSIS STEPS. 
BIG BLACK BOXES ARE NOT SMALL 
TOOLS!
Write down what you’re doing… 
https://khmer-protocols.readthedocs.org/
…and add automated end-to-end tests. 
c.f. “literate ReSTing”
3. Drive sustainable software 
development with use cases.
…that are explicit…
…versioned…
…and automated.
4. Put everything in the cloud and 
measure it. 
~40 hours; 
m1.xlarge 
Eel Pond mRNAseq protocol.
5. Compare programs and workflows fairly. 
Genome Reference 
Quality Filtered Diginorm Partition Reinflation 
Velvet - 80.90 83.64 84.57 
IDBA 90.96 91.38 90.52 88.80 
SPAde 
90.42 90.35 89.57 90.02 
s 
Mis-assembled Contig Length 
Velvet - 52071358 44730449 45381867 
IDBA 21777032 20807513 17159671 18684159 
SPAde 
28238787 21506019 14247392 18851571 
s 
Kalamazoo metagenome protocol run on mock data from Shakya et al., 2013 
Also! Tip o’ the hat to Michael Barton, nucleotid.es
A super fun way to do reviews! 
• “What a nice new transcriptome assembler! Interesting 
how it doesn’t perform that well on my 10 test data sets.” 
• “Hey, so you make these claims, but I ran your code, 
and…” 
• “Fun fact! Your source code has a syntax error in it – even 
Perl has standards! You’re still sure that’s the script you 
used?” 
• “Here – use our evaluation pipeline, since you clearly 
need something better.” 
The Brown Lab: taking passive aggression to a whole new level!
We breed our own problems. 
Reward the behavior you want to see. 
Let’s level up the field, already.
What are we working on, scientifically 
speaking?
Streaming error correction of genomic, transcriptomic, 
metagenomic data via graph alignment 
Jason Pell, Jordan Fish, Michael Crusoe
Error correction on simulated E. coli data 
TP FP TN FN 
1.2-pass 3,494,631 99.8% 3,865 460,601,171 5,533 2.8% 
(corrected) (mistakes) (OK) (missed) 
1% error rate, 100x coverage. 
Michael Crusoe, Jordan Fish, Jason Pell
Error correction  variant calling 
Single pass, reference free, tunable, streaming 
online variant calling. 
(Hey, look, ma – a new mapper!)
Infrastructure: distributed graph database server 
Web interface + API 
Compute server 
(Galaxy? 
Arvados?) 
Data/ 
Info 
Raw data sets 
Public 
servers 
"Walled 
garden" 
server 
Private 
server 
Graph query layer 
Upload/submit 
(NCBI, KBase) 
Import 
(MG-RAST, 
SRA, EBI) 
ivory.idyll.org/blog/2014-moore-ddd-talk.html
AGTA talk on Monday 
• 3:15-4pm – come see me try to convince biomedical 
researchers to share their data! 
• 4-4:30pm – come listen to Ana Conesa talk about multi-omics 
data integration! 
Thanks!

2014 abic-talk

  • 1.
    BUILDING BETTER BIOINFORMATICS SOFTWARE (WHY THE HECK NOT?) C. Titus Brown ctb@msu.edu Assistant Professor, MMG / CSE Michigan State University
  • 2.
    BUILDING BETTER BIOINFORMATICS SOFTWARE (WHY THE HECK NOT?) C. Titus Brown ctb@msu.edu A???????? Professor, VetMed, UC Davis
  • 3.
    Lansing, Michigan ->Davis, California
  • 4.
    Dot plots FTW! Brown et al., 2005.
  • 5.
    So I saidthese things… “this tipping point was exacerbated by the loss of about 80% of the worlds data scientists in the 2021 Great California Disruption.” “[ Benchmarks ] have proven to be stifling of innovation, because of the tendency to do incremental improvement.” ivory.idyll.org/blog/2014-bosc-keynote.html
  • 6.
    So I saidthese things… “this tipping point was exacerbated by the loss of about 80% of the worlds data scientists in the 2021 Great California Disruption.” “[ Benchmarks ] have proven to be stifling of innovation, because of the tendency to do incremental improvement.” ivory.idyll.org/blog/2014-bosc-keynote.html
  • 8.
    There is areal problem.
  • 9.
    There is amassive profusion of software! Mick Watson, @BioMickWatson: biomickwatson.wordpress.com/20 12/12/28/an-embargo-on-short-read- alignment-software/ jeffvictor.deviantart.com
  • 10.
    The players, incaricature: 1. Computer scientists 2. Software engineers 3. Data scientists 4. Statisticians 5. Biologists
  • 11.
    The Computer Scientist Fast, sensitive, specific – pick one.
  • 12.
    The (Good) SoftwareEngineer Does it have any unit tests?
  • 13.
    The Data Scientist How quickly can I run it, starting from scratch?
  • 14.
    The Statistician Whatgives me the best p-value?
  • 15.
    The Biologist Whatgives me the most publishable result?
  • 16.
    Problems all alongthe way… 1. Computer scientists: build delicate, hard to use, very high performance software that solves the wrong problem. 2. Software engineers: all work for Google. 3. Data scientists: uses the wrong programs -- because they’re actually usable. 4. Statisticians: only get invited into the project six months after all the data is generated. 5. Biologists: are desperate to find any one of the above that know any biology at all.
  • 17.
    Example: de novomRNAseq Quality control Assembly Annotation Differential expression Every one of these steps is still an open research problem, with computational challenges and direct biological implications!
  • 18.
    So: 1. Thisis all still research. 2. We’re unlikely to ever find out the right answer, but will merely settle for one that’s not obviously terrible. 3. Everything is changing all the time: the data generation tech, the hardware, the software, the theory... 4. Who are any of us to judge the value of any particular approach?
  • 19.
    So: 1. Thisis all still research 2. We’re unlikely to ever find out the right answer, but will merely settle for one that’s not obviously terrible. 3. Everything is changing all the time: the data generation tech, the hardware, the software, the theory... 4. Who are any of us to judge the value of any particular approach? (Well, sometimes me, when I’m peer reviewer #2.)
  • 20.
    All hands ondeck! Quality control Assembly Annotation Differential expression We need it all! • Fast/sensitive/specific algorithms; • Solid software; • Statistical robustness; • Biological insight; • Well-trained data scientists. (The best bioinformaticians have multiple personality disorder, or so I tell myself.)
  • 21.
    That sort ofexplains why. But this still leaves us with too many choices.
  • 22.
    Example: de novomRNAseq Quality control Assembly Annotation Differential expression 10-20 packages x 2-5 packages x 5-10 packages x 20-40 packages = 2000-40,000 combinations
  • 23.
    What’s the solution!? Ultimately? All of… Whole-workflow evaluations of tools. Small tools (see “small tools manifesto”). Automation! Simulations, synthetic data, mock data, real data. Antagonistic data set development (**). Tool development driven with use cases. Build based on solid command-line workflows. Those things called “controls”. …and more
  • 24.
    Trying out afew approaches…
  • 25.
    1. Automate thehell out of everything (Ubuntu 14.04, git, make, IPython Notebook, latex)
  • 26.
    Time from publicationof KAnalyze to our 100% reproducible re-evaluation? ~8 hours.
  • 27.
    2. Protocols, notpipelines. STOP HIDING THE ANALYSIS STEPS. BIG BLACK BOXES ARE NOT SMALL TOOLS!
  • 28.
    Write down whatyou’re doing… https://khmer-protocols.readthedocs.org/
  • 29.
    …and add automatedend-to-end tests. c.f. “literate ReSTing”
  • 31.
    3. Drive sustainablesoftware development with use cases.
  • 32.
  • 33.
  • 34.
  • 35.
    4. Put everythingin the cloud and measure it. ~40 hours; m1.xlarge Eel Pond mRNAseq protocol.
  • 36.
    5. Compare programsand workflows fairly. Genome Reference Quality Filtered Diginorm Partition Reinflation Velvet - 80.90 83.64 84.57 IDBA 90.96 91.38 90.52 88.80 SPAde 90.42 90.35 89.57 90.02 s Mis-assembled Contig Length Velvet - 52071358 44730449 45381867 IDBA 21777032 20807513 17159671 18684159 SPAde 28238787 21506019 14247392 18851571 s Kalamazoo metagenome protocol run on mock data from Shakya et al., 2013 Also! Tip o’ the hat to Michael Barton, nucleotid.es
  • 37.
    A super funway to do reviews! • “What a nice new transcriptome assembler! Interesting how it doesn’t perform that well on my 10 test data sets.” • “Hey, so you make these claims, but I ran your code, and…” • “Fun fact! Your source code has a syntax error in it – even Perl has standards! You’re still sure that’s the script you used?” • “Here – use our evaluation pipeline, since you clearly need something better.” The Brown Lab: taking passive aggression to a whole new level!
  • 38.
    We breed ourown problems. Reward the behavior you want to see. Let’s level up the field, already.
  • 40.
    What are weworking on, scientifically speaking?
  • 41.
    Streaming error correctionof genomic, transcriptomic, metagenomic data via graph alignment Jason Pell, Jordan Fish, Michael Crusoe
  • 42.
    Error correction onsimulated E. coli data TP FP TN FN 1.2-pass 3,494,631 99.8% 3,865 460,601,171 5,533 2.8% (corrected) (mistakes) (OK) (missed) 1% error rate, 100x coverage. Michael Crusoe, Jordan Fish, Jason Pell
  • 43.
    Error correction variant calling Single pass, reference free, tunable, streaming online variant calling. (Hey, look, ma – a new mapper!)
  • 44.
    Infrastructure: distributed graphdatabase server Web interface + API Compute server (Galaxy? Arvados?) Data/ Info Raw data sets Public servers "Walled garden" server Private server Graph query layer Upload/submit (NCBI, KBase) Import (MG-RAST, SRA, EBI) ivory.idyll.org/blog/2014-moore-ddd-talk.html
  • 45.
    AGTA talk onMonday • 3:15-4pm – come see me try to convince biomedical researchers to share their data! • 4-4:30pm – come listen to Ana Conesa talk about multi-omics data integration! Thanks!

Editor's Notes

  • #43 Update from Jordan
  • #45 Analyze data in cloud; import and export important; connect to other databases.