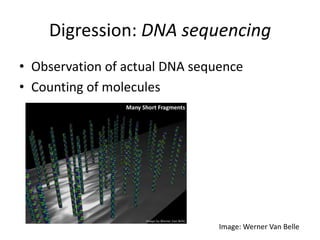
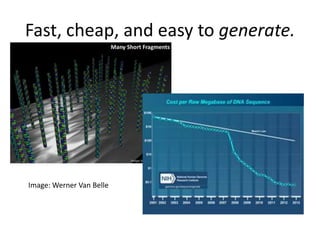
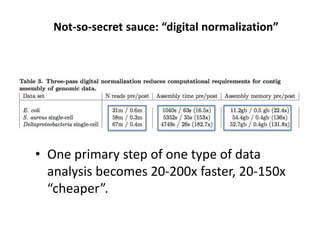
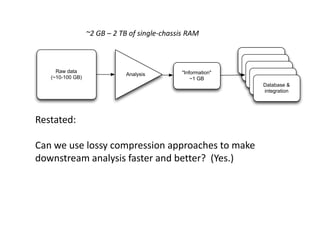
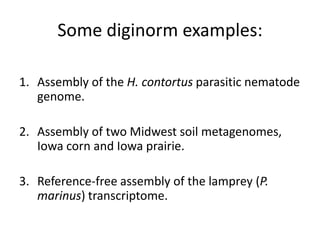
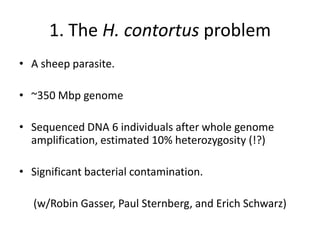
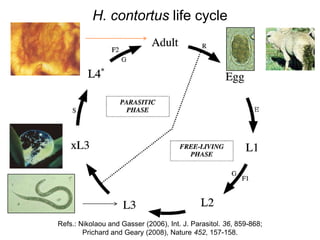
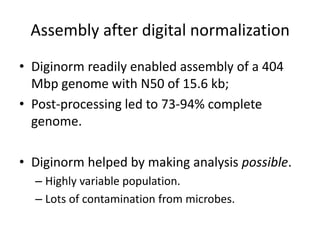
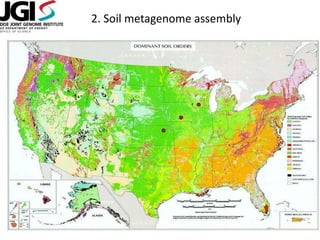
I’ve got the Big Data Blues
C. Titus Brown
ctb@msu.edu
Microbiology, Computer Science, and
BEACON
Outline
1. Genetics 101 and 102 - what you need to know.
2. Marek’s Disease – chicken cancer.
3. Generating lots of data – the sequencing
revolution.
4. The problems of data analysis and data
integration.
5. Some preliminary results on Marek’s Disease
5. An apparent digression: chess and computers.
6. My actual research :)
Genetics 101: DNA to RNA to protein to phenotype…
Genome
(DNA)
Transcripts
(Genes; RNA)
Proteins
(Amino acids)
Animal
http://commons.wikimedia.org/wiki/File:Spombe_Pop2p_protein_stru
cture_rainbow.png;
http://commons.wikimedia.org/wiki/File:Protein_CA2_PDB_12ca.png
…plus diploidy (2x each chromosome)
Genome
(DNA)
Transcripts
(Genes; RNA)
Proteins
(Amino acids)
Animal
GT
A
C
…plus regulation and interaction.
Genome
(DNA)
Transcripts
(Genes; RNA)
Proteins
(Amino acids)
Animal
GT
A
C
Regulation
Interaction
PHYSICAL
AGENTS
INFECTIOUS
AGENTS
HORMONES RADIATION
GENETIC
FACTORS
CHEMICAL
CARCINOGENS
LIFESTYLE
FACTORS
(slide courtesy Suga Subramanian)
Herpesvirus and Cancer
• Epstein-Barr Virus
– Burkitt’s lymphoma
– Hodgkin’s lymphoma
– Nasopharyngeal
carcinoma
• Herpes Virus-8
– Kaposi’s sarcoma
– Multicentric lymphoma
• Mardivirus
– Marek’s Disease
• Viral neoplastic disease
• Alpha-herpesvirus
• Model for Burkitt’s lymphoma
(slide courtesy Suga Subramanian)
Clinical Signs Asymmetric Paralysis
http://partnersah.vet.cornell.edu/avian-atlas/
Visceral Lymphoma
Liver
NORMAL
LYMPHOMA
Courtesy: John Dunn, USDA
Importance of Marek’s Disease
• Agricultural Impact
– Economic losses (2 billion)
– Viral evolution: Increased virulence
– Current Vaccines: Not enough
– Long term viral persistence
• Model Sytem
– Human herpes viral infections
– Viral induced lymphoma
(slide courtesy Suga Subramanian)
MAREK’S DISEASE
VIRUS
(MDV)
INBRED CHICKEN
LINES
MD-RESISTANT
LINE
MD-SUSCEPTIBLE
LINE
LINE 62 LINE 73
GENETIC RESISTANCE TO
MAREK’S DISEASE
(slide courtesy Suga Subramanian)
What happens when we infect?
Genome
(DNA)
Transcripts
(Genes; RNA)
Proteins
(Amino acids)
Animal
GT
A
C
Regulation
Interaction
Infect with virus
?
…how does the virus specifically interact with
genes?
Genome
(DNA)
Transcripts
(Genes; RNA)
Proteins
(Amino acids)
Animal
GT
A
C
Regulation
Interaction
Infect with virus
?
Mechanism of regulation?
…and what are the mechanisms of resistance?
Genome
(DNA)
Transcripts
(Genes; RNA)
Proteins
(Amino acids)
Animal
GT
A
C
Regulation
Interaction
Infect with virus
?
Mechanism of resistance?
Digression: DNA sequencing
• Observation of actual DNA sequence
• Counting of molecules
Image: Werner Van Belle
Fast, cheap, and easy to generate.
Image: Werner Van Belle
Applying sequencing to Marek’s Disease
Genome
(DNA)
Transcripts
(Genes; RNA)
Proteins
(Amino acids)
Animal
GT
A
C
Regulation
Interaction
SEQUENCING
Differentially expressed genes (DEG) due to infection
Gene GO Analysis, IPA Pathway Analysis
DEGs in Md5-infected and not in Md5ΔMeq-infected groups
YES NO
Meq-dependent DEGs DEGs not dependent on Meq
DEGs in Line 6 and not in Line 7 DEGs in Line 7 and not in Line 6
YES NO NO YES
Meq-dependent
DEGs involved in
MD resistance
Meq-dependent
DEGs involved in
MD susceptibility
Meq-dependent DEGs
common to both lines
Back to Marek’s disease:
(slide courtesy Suga Subramanian)
LINE 6
MD-RESISTANCE: ROLE OF MEQ
MDV MDV-no Meq
Genes involved in
MD-resistance
that are regulated
by Meq
Genes involved in
MD-resistance that
are not regulated
by Meq
1031 1670
(slide courtesy Suga Subramanian)
Pathway Analysis: MD resistance
(slide courtesy Suga Subramanian)
LINE 7
MD-SUSCEPTIBILITY: ROLE OF MEQ
MDV MDV-no Meq
Genes involved in
MD-susceptibility
that are regulated
by Meq
Genes involved in
MD-susceptibility
that are not
regulated by Meq
650 540
(slide courtesy Suga Subramanian)
Pathway Analysis: MD susceptibility
(slide courtesy Suga Subramanian)
Next problem: data analysis &
integration!
• Once you can generate virtually any data set you
want…
• …the next problem becomes finding your answer
in the data set!
• Think of it as a gigantic NSA treasure hunt: you
know there are terrorists out there, but to find
them you to hunt through 1 bn phone calls a
day…
Digression: “Heuristics”
• What do computers do when the answer is
either really, really hard to compute exactly, or
actually impossible?
• They approximate! Or guess!
• The term “heuristic” refers to a guess, or
shortcut procedure, that usually returns a
pretty good answer.
Often explicit or implicit tradeoffs between
compute “amount” and quality of result
http://www.infernodevelopment.com/how-
computer-chess-engines-think-minimax-tree
My actual research focus
What we do is think about ways to get
computers to play chess better, by:
– Identifying better ways to guess;
– Speeding up the guessing process;
– Improving people’s ability to use the chess playing
computer
Now, replace “play chess” with
“analyze biological data”...
My actual research focus…
We build tools that help experimental biologists work
efficiently and correctly with large amounts of data, to help
answer their scientific questions.
This touches on many problems, including:
• Computational and scientific correctness.
• Computational efficiency.
• Cultural divides between experimental biologists and
computational scientists.
• Lack of training (biology and medical curricula devoid of
math and computing).
Not-so-secret sauce: “digital normalization”
• One primary step of one type of data
analysis becomes 20-200x faster, 20-150x
“cheaper”.
http://en.wikipedia.org/wiki/JPEG
Lossy compression
http://en.wikipedia.org/wiki/JPEG
Lossy compression
http://en.wikipedia.org/wiki/JPEG
Lossy compression
http://en.wikipedia.org/wiki/JPEG
Lossy compression
http://en.wikipedia.org/wiki/JPEG
Lossy compression
Raw data
(~10-100 GB)
Analysis "Information"
~1 GB
"Information"
"Information"
"Information"
"Information"
Database &
integration
Restated:
Can we use lossy compression approaches to make
downstream analysis faster and better? (Yes.)
~2 GB – 2 TB of single-chassis RAM
Some diginorm examples:
1. Assembly of the H. contortus parasitic nematode
genome.
2. Assembly of two Midwest soil metagenomes,
Iowa corn and Iowa prairie.
3. Reference-free assembly of the lamprey (P.
marinus) transcriptome.
1. The H. contortus problem
• A sheep parasite.
• ~350 Mbp genome
• Sequenced DNA 6 individuals after whole genome
amplification, estimated 10% heterozygosity (!?)
• Significant bacterial contamination.
(w/Robin Gasser, Paul Sternberg, and Erich Schwarz)
H. contortus life cycle
Refs.: Nikolaou and Gasser (2006), Int. J. Parasitol. 36, 859-868;
Prichard and Geary (2008), Nature 452, 157-158.
Assembly after digital normalization
• Diginorm readily enabled assembly of a 404
Mbp genome with N50 of 15.6 kb;
• Post-processing led to 73-94% complete
genome.
• Diginorm helped by making analysis possible.
– Highly variable population.
– Lots of contamination from microbes.
Next steps with H. contortus
• Publish the genome paper 
• Identification of antibiotic targets for
treatment in agricultural settings (animal
husbandry).
• Serving as “reference approach” for a wide
variety of parasitic nematodes, many of which
have similar genomic issues.
2. Soil metagenome assembly
A “Grand Challenge” dataset (DOE/JGI)
0
100
200
300
400
500
600
Iowa,
Continuous
corn
Iowa, Native
Prairie
Kansas,
Cultivated
corn
Kansas,
Native
Prairie
Wisconsin,
Continuous
corn
Wisconsin,
Native
Prairie
Wisconsin,
Restored
Prairie
Wisconsin,
Switchgrass
BasepairsofSequencing(Gbp)
GAII HiSeq
Rumen (Hess et. al, 2011), 268 Gbp
MetaHIT (Qin et. al, 2011), 578 Gbp
NCBI nr database,
37 Gbp
Total: 1,846 Gbp soil metagenome
Rumen K-mer Filtered,
111 Gbp
Putting it in perspective:
Total equivalent of ~1200 bacterial genomes
Human genome ~3 billion bp
Assembly results for Iowa corn and prairie
(2x ~300 Gbp soil metagenomes)
Total
Assembly
Total Contigs
(> 300 bp)
% Reads
Assembled
Predicted
protein
coding
2.5 bill 4.5 mill 19% 5.3 mill
3.5 bill 5.9 mill 22% 6.8 mill
Adina Howe
3. Sea lamprey gene expression
• Non-native
• Parasite of
medium to
large fishes
• Caused
populations of
host fishes to
crash
Li Lab / Y-W C-D
Transcriptome results
• Started with 5.1 billion reads from 50 different tissues.
(4 years of computational research, and about 1 month of compute
time, GO HERE)
• Final assembly contains ~95% of genes (est.)
• This is an extra 40% over previous work.
• Enabling studies in –
– Basal vertebrate phylogeny
– Biliary atresia
– Evolutionary origin of brown fat (previously thought to be
mammalian only!) – J Exp Biol. 2013
– Pheromonal response in adults
What are the tissue level changes in gene expression that support
regeneration? Transcriptome analysis of a regenerating vertebrate after SCI
brain
spinal cord
RNA-Seq to determine
differential expression
profile after injury
Sampling >weekly
-/+ Dex
Ona Bloom
Challenges ahead
• We need more people working at the interface
– “Priesthood” model doesn’t scale!
– Cultural shifts in biology needed…
• We need more data!
– Data often only makes sense in context of other data
– This is a hard sell: “if you give us 1000x as much data,
we might start to develop some idea of what it
means.”
• We actually know very little about biology still!
Open science & sharing
• Science, and biology in particular, is in the
middle of a transition to a “data intensive”
field.
• The sharing ethos is not incentivized properly;
you get more credit for discovering new stuff
than for discoveries resulting from sharing.
• We are focused on sharing: methods,
programs, educational materials…
Being disruptive?
Possible initiative from my lab:
“We will analyze your data for you if we can
make your data openly available in 1 yr.”
Will it work, or sink like a stone? Ask me in a
year 
MSU’s role in my research
• MSU provides nice infrastructure, great
administrative support, and a truly excellent
community (students, profs, and other
researchers).
• MSU is also uniquely interdisciplinary in many
ways; very few “hard” boundaries in biology
research.
Credits
• Marek’s Disease: Suga Subramanian and Hans Cheng (USDA)
• Haemonchus: Erich Schwarz (Caltech/Cornell), Paul Sternberg
(Caltech), Robin Gasser (U. Melbourne)
• Lamprey: Weiming Li (MSU), Ona Bloom (Feinstein), Jen
Morgan (MBL/Woods Hole)
• Great Prairie: Jim Tiedje (MSU), Janet Jansson (LBL), Susanna
Tringe (Joint Genome Inst.)
Funding: MSU; USDA; NSF; NIH.
Drop me a line – ctb@msu.edu

2013 alumni-webinar

  • 1.
    I’ve got theBig Data Blues C. Titus Brown ctb@msu.edu Microbiology, Computer Science, and BEACON
  • 2.
    Outline 1. Genetics 101and 102 - what you need to know. 2. Marek’s Disease – chicken cancer. 3. Generating lots of data – the sequencing revolution. 4. The problems of data analysis and data integration. 5. Some preliminary results on Marek’s Disease 5. An apparent digression: chess and computers. 6. My actual research :)
  • 3.
    Genetics 101: DNAto RNA to protein to phenotype… Genome (DNA) Transcripts (Genes; RNA) Proteins (Amino acids) Animal http://commons.wikimedia.org/wiki/File:Spombe_Pop2p_protein_stru cture_rainbow.png; http://commons.wikimedia.org/wiki/File:Protein_CA2_PDB_12ca.png
  • 4.
    …plus diploidy (2xeach chromosome) Genome (DNA) Transcripts (Genes; RNA) Proteins (Amino acids) Animal GT A C
  • 5.
    …plus regulation andinteraction. Genome (DNA) Transcripts (Genes; RNA) Proteins (Amino acids) Animal GT A C Regulation Interaction
  • 6.
  • 7.
    Herpesvirus and Cancer •Epstein-Barr Virus – Burkitt’s lymphoma – Hodgkin’s lymphoma – Nasopharyngeal carcinoma • Herpes Virus-8 – Kaposi’s sarcoma – Multicentric lymphoma • Mardivirus – Marek’s Disease • Viral neoplastic disease • Alpha-herpesvirus • Model for Burkitt’s lymphoma (slide courtesy Suga Subramanian)
  • 8.
    Clinical Signs AsymmetricParalysis http://partnersah.vet.cornell.edu/avian-atlas/
  • 9.
  • 10.
    Importance of Marek’sDisease • Agricultural Impact – Economic losses (2 billion) – Viral evolution: Increased virulence – Current Vaccines: Not enough – Long term viral persistence • Model Sytem – Human herpes viral infections – Viral induced lymphoma (slide courtesy Suga Subramanian)
  • 11.
    MAREK’S DISEASE VIRUS (MDV) INBRED CHICKEN LINES MD-RESISTANT LINE MD-SUSCEPTIBLE LINE LINE62 LINE 73 GENETIC RESISTANCE TO MAREK’S DISEASE (slide courtesy Suga Subramanian)
  • 12.
    What happens whenwe infect? Genome (DNA) Transcripts (Genes; RNA) Proteins (Amino acids) Animal GT A C Regulation Interaction Infect with virus ?
  • 13.
    …how does thevirus specifically interact with genes? Genome (DNA) Transcripts (Genes; RNA) Proteins (Amino acids) Animal GT A C Regulation Interaction Infect with virus ? Mechanism of regulation?
  • 14.
    …and what arethe mechanisms of resistance? Genome (DNA) Transcripts (Genes; RNA) Proteins (Amino acids) Animal GT A C Regulation Interaction Infect with virus ? Mechanism of resistance?
  • 15.
    Digression: DNA sequencing •Observation of actual DNA sequence • Counting of molecules Image: Werner Van Belle
  • 16.
    Fast, cheap, andeasy to generate. Image: Werner Van Belle
  • 17.
    Applying sequencing toMarek’s Disease Genome (DNA) Transcripts (Genes; RNA) Proteins (Amino acids) Animal GT A C Regulation Interaction SEQUENCING
  • 18.
    Differentially expressed genes(DEG) due to infection Gene GO Analysis, IPA Pathway Analysis DEGs in Md5-infected and not in Md5ΔMeq-infected groups YES NO Meq-dependent DEGs DEGs not dependent on Meq DEGs in Line 6 and not in Line 7 DEGs in Line 7 and not in Line 6 YES NO NO YES Meq-dependent DEGs involved in MD resistance Meq-dependent DEGs involved in MD susceptibility Meq-dependent DEGs common to both lines Back to Marek’s disease: (slide courtesy Suga Subramanian)
  • 19.
    LINE 6 MD-RESISTANCE: ROLEOF MEQ MDV MDV-no Meq Genes involved in MD-resistance that are regulated by Meq Genes involved in MD-resistance that are not regulated by Meq 1031 1670 (slide courtesy Suga Subramanian)
  • 20.
    Pathway Analysis: MDresistance (slide courtesy Suga Subramanian)
  • 21.
    LINE 7 MD-SUSCEPTIBILITY: ROLEOF MEQ MDV MDV-no Meq Genes involved in MD-susceptibility that are regulated by Meq Genes involved in MD-susceptibility that are not regulated by Meq 650 540 (slide courtesy Suga Subramanian)
  • 22.
    Pathway Analysis: MDsusceptibility (slide courtesy Suga Subramanian)
  • 23.
    Next problem: dataanalysis & integration! • Once you can generate virtually any data set you want… • …the next problem becomes finding your answer in the data set! • Think of it as a gigantic NSA treasure hunt: you know there are terrorists out there, but to find them you to hunt through 1 bn phone calls a day…
  • 24.
    Digression: “Heuristics” • Whatdo computers do when the answer is either really, really hard to compute exactly, or actually impossible? • They approximate! Or guess! • The term “heuristic” refers to a guess, or shortcut procedure, that usually returns a pretty good answer.
  • 25.
    Often explicit orimplicit tradeoffs between compute “amount” and quality of result http://www.infernodevelopment.com/how- computer-chess-engines-think-minimax-tree
  • 26.
    My actual researchfocus What we do is think about ways to get computers to play chess better, by: – Identifying better ways to guess; – Speeding up the guessing process; – Improving people’s ability to use the chess playing computer Now, replace “play chess” with “analyze biological data”...
  • 27.
    My actual researchfocus… We build tools that help experimental biologists work efficiently and correctly with large amounts of data, to help answer their scientific questions. This touches on many problems, including: • Computational and scientific correctness. • Computational efficiency. • Cultural divides between experimental biologists and computational scientists. • Lack of training (biology and medical curricula devoid of math and computing).
  • 28.
    Not-so-secret sauce: “digitalnormalization” • One primary step of one type of data analysis becomes 20-200x faster, 20-150x “cheaper”.
  • 29.
  • 30.
  • 31.
  • 32.
  • 33.
  • 34.
    Raw data (~10-100 GB) Analysis"Information" ~1 GB "Information" "Information" "Information" "Information" Database & integration Restated: Can we use lossy compression approaches to make downstream analysis faster and better? (Yes.) ~2 GB – 2 TB of single-chassis RAM
  • 35.
    Some diginorm examples: 1.Assembly of the H. contortus parasitic nematode genome. 2. Assembly of two Midwest soil metagenomes, Iowa corn and Iowa prairie. 3. Reference-free assembly of the lamprey (P. marinus) transcriptome.
  • 36.
    1. The H.contortus problem • A sheep parasite. • ~350 Mbp genome • Sequenced DNA 6 individuals after whole genome amplification, estimated 10% heterozygosity (!?) • Significant bacterial contamination. (w/Robin Gasser, Paul Sternberg, and Erich Schwarz)
  • 37.
    H. contortus lifecycle Refs.: Nikolaou and Gasser (2006), Int. J. Parasitol. 36, 859-868; Prichard and Geary (2008), Nature 452, 157-158.
  • 38.
    Assembly after digitalnormalization • Diginorm readily enabled assembly of a 404 Mbp genome with N50 of 15.6 kb; • Post-processing led to 73-94% complete genome. • Diginorm helped by making analysis possible. – Highly variable population. – Lots of contamination from microbes.
  • 39.
    Next steps withH. contortus • Publish the genome paper  • Identification of antibiotic targets for treatment in agricultural settings (animal husbandry). • Serving as “reference approach” for a wide variety of parasitic nematodes, many of which have similar genomic issues.
  • 40.
  • 41.
    A “Grand Challenge”dataset (DOE/JGI) 0 100 200 300 400 500 600 Iowa, Continuous corn Iowa, Native Prairie Kansas, Cultivated corn Kansas, Native Prairie Wisconsin, Continuous corn Wisconsin, Native Prairie Wisconsin, Restored Prairie Wisconsin, Switchgrass BasepairsofSequencing(Gbp) GAII HiSeq Rumen (Hess et. al, 2011), 268 Gbp MetaHIT (Qin et. al, 2011), 578 Gbp NCBI nr database, 37 Gbp Total: 1,846 Gbp soil metagenome Rumen K-mer Filtered, 111 Gbp
  • 42.
    Putting it inperspective: Total equivalent of ~1200 bacterial genomes Human genome ~3 billion bp Assembly results for Iowa corn and prairie (2x ~300 Gbp soil metagenomes) Total Assembly Total Contigs (> 300 bp) % Reads Assembled Predicted protein coding 2.5 bill 4.5 mill 19% 5.3 mill 3.5 bill 5.9 mill 22% 6.8 mill Adina Howe
  • 43.
    3. Sea lampreygene expression • Non-native • Parasite of medium to large fishes • Caused populations of host fishes to crash Li Lab / Y-W C-D
  • 44.
    Transcriptome results • Startedwith 5.1 billion reads from 50 different tissues. (4 years of computational research, and about 1 month of compute time, GO HERE) • Final assembly contains ~95% of genes (est.) • This is an extra 40% over previous work. • Enabling studies in – – Basal vertebrate phylogeny – Biliary atresia – Evolutionary origin of brown fat (previously thought to be mammalian only!) – J Exp Biol. 2013 – Pheromonal response in adults
  • 45.
    What are thetissue level changes in gene expression that support regeneration? Transcriptome analysis of a regenerating vertebrate after SCI brain spinal cord RNA-Seq to determine differential expression profile after injury Sampling >weekly -/+ Dex Ona Bloom
  • 46.
    Challenges ahead • Weneed more people working at the interface – “Priesthood” model doesn’t scale! – Cultural shifts in biology needed… • We need more data! – Data often only makes sense in context of other data – This is a hard sell: “if you give us 1000x as much data, we might start to develop some idea of what it means.” • We actually know very little about biology still!
  • 47.
    Open science &sharing • Science, and biology in particular, is in the middle of a transition to a “data intensive” field. • The sharing ethos is not incentivized properly; you get more credit for discovering new stuff than for discoveries resulting from sharing. • We are focused on sharing: methods, programs, educational materials…
  • 48.
    Being disruptive? Possible initiativefrom my lab: “We will analyze your data for you if we can make your data openly available in 1 yr.” Will it work, or sink like a stone? Ask me in a year 
  • 49.
    MSU’s role inmy research • MSU provides nice infrastructure, great administrative support, and a truly excellent community (students, profs, and other researchers). • MSU is also uniquely interdisciplinary in many ways; very few “hard” boundaries in biology research.
  • 50.
    Credits • Marek’s Disease:Suga Subramanian and Hans Cheng (USDA) • Haemonchus: Erich Schwarz (Caltech/Cornell), Paul Sternberg (Caltech), Robin Gasser (U. Melbourne) • Lamprey: Weiming Li (MSU), Ona Bloom (Feinstein), Jen Morgan (MBL/Woods Hole) • Great Prairie: Jim Tiedje (MSU), Janet Jansson (LBL), Susanna Tringe (Joint Genome Inst.) Funding: MSU; USDA; NSF; NIH. Drop me a line – ctb@msu.edu

Editor's Notes

  • #10 This image depict numerous lymphoma aggregates in the liver
  • #21 Figure 6. IPA Pathway analysis for significantly expressed genes that are Meq-dependent and involved in resistance to MD (A) and MD susceptibility (B). P-value < 0.05 and FDR <0.05 were used as thresholds to select significant canonical pathways.
  • #29 Goal is to do first stage data reduction/analysis in less time than it takes to generate the data. Compression => OLC assembly.
  • #44 Larvae/stream bottoms 3-6 years; parasitic adult -> great lakes, 12-20 months feeding. 5-8 years. 40 lbs of fish per life as parasite. 98% of fish in great lakes went away!