SlideShare a Scribd company logo
T H E P R O J E C T F O R A S S E S S M E N T O F
E A R T H Q U A K E D I S A S T E R R I S K F O R
T H E K A T H M A N D U V A L L E Y I N N E P A L
April 11, 2017
Seismic Risk Assessment for
Kathmandu Valley
Suman Salike, SDE, MoUD
Kenpei Kojika, JICA Project Team
CONTENTS
→ Earthquake and Its Consequence
→ Procedure of Seismic Risk Assessment
→ Scenario Earthquake and Seismic Hazard
→ Building Damage
→ Damage of Infrastructure and Lifeline
→ Human Casualty
→ Economic Loss
→ Conclusions
2
→ Earthquake and Its Consequence
3
How an Earthquake Happens
Elastic Rebound Theory
4
Fault
Where the Earthquake Happens
Antarctic plate
African plate
South American plate
Indian plate
Eurasian plate
Philippine sea plate
Pacific plate
North American plate
Plate Boundary or Fault inside Plate
Source of Gorkha Earthquake (from S. Wesnousky, et.al.)
5
Characteristics of the Earthquake
X 31.6X 1000X
Magnitude and Intensity Distribution of
Gorkha Earthquake (from USGS)
Difference of Magnitude and its energy 6
Magnitude describes the
energy released by an
earthquake (e.g. Richter
scale)
Intensity gives the
information of ground
shaking strength and
related to damage degree,
changing with the distance
from the site to the source
of earthquake (e.g. MMI)
M=7.8
VIII
VII
VI
Diversity of Earthquake Consequence
Building Damage
Fire
Landslide
Tsunami
Liquefaction
7
→ Procedure of Seismic Risk Assessment
8
Hazard:
A dangerous phenomenon,
substance, human activity
or condition that may
cause loss of life, injury or
other health impacts,
property damage, loss of
livelihoods and services,
social and economic
disruption, or
environmental damage
Vulnerability:
The characteristics and
circumstances of a community,
system or asset that make it
susceptible to the damaging
effects of a hazard
Definition of Disaster Risk
Exposure:
People, property, systems,
or other elements present
in hazard zones that are
thereby subject to
potential losses
Disaster risk = Hazard * Vulnerability * Exposure
RISK
Hazard
Exposure
Vulnerability
Hazard, exposure, vulnerability and disaster risk (According to ISDR)
9
Law, Regulation
Avoidance
Sustainable
Development
Components of Disaster Risk Management
10
We Are Here
Approach of Seismic Hazard and Risk Assessment
Earthquake Source
Site response
Attenuation
Total risk is determined by the intensity of ground motion, vulnerability of
structure and the number of vulnerable structures 11
Target of Seismic Risk Assessment
Building Road Bridge
Water & Sewage Power & Communication Human and Economic Loss
12
→ Scenario Earthquake and Seismic Hazard
13
Scenario Earthquakes
Thomas Ader et al. 2012 J. R. Elliote et al. 2016
2015 Gorkha Earthquake
14
(1) Far-Mid Western Nepal
M=8.6
(2) Western
Nepal
(3) Central Nepal South
M=7.8
M=7.8
1934 Bihar Earthquake
Ground Shaking Level for Risk Assessment
15
Gorkha Earthquake
Scenario Earthquake
Fault Model
(1)
(2)
(3)
CNS-2/CNS-1 ≅ 1.5
CNS-3/CNS-1 ≅ 2.0
Peak Ground Acceleration (PGA) Distribution
Case WN
Case CNS-1 Case CNS-2 Case CNS-3
Gorkha earthquake
(estimated for verification)
16
150 - 200
150 - 400
150 - 200
300 - 800250 - 600
Intensity (MMI) Distribution
Case WN
Case CNS-1 Case CNS-2 Case CNS-3
17
Gorkha earthquake
(estimated for verification)
Liquefaction Distribution
Case WN Case CNS-1 Case CNS-2 Case CNS-3
18
Case WN Case CNS-1 Case CNS-2 Case CNS-3
Rainy Season
High potential
Moderate potential
Low potential
Dry Season
Note: Due to soil properties are insufficient, some
assumption are made for the liquefaction estimation
Slope Failure Distribution
Case WN
Case CNS-1 Case CNS-2 Case CNS-3
19
Note: Due to soil properties are
insufficient, some assumption are
made for the slope failure estimation
→ Building Damage
20
Damage of Gorkha Earthquake
Kathmandu Durbar Square
(2015/5/6)
Bhaktapur (2015/5/7)
Gongabu (2015/5/23)
Sankhu (2017/3/24)Sankhu (2015/5/23)
Gongabu (2017/3/24)
21
NowImmediately after earthquake Masonry RC building
Level 1: Negligible to slight damage
No structural damage, slight non-
structural damage)
Level 2: Moderate damage
Slight structural damage, moderate non-
structural damage
Level 3: Substantial to heavy damage
Moderate structural damage, heavy non-
structural damage
Level 4: Very heavy damage
Heavy structural damage, very heavy
non-structural damage
Level 5: Destruction
Very heavy structural damage, collapse
of ground floor or parts of buildings.
Building Damage Level
European Macroseismic Scale (EMS) 1998
22
Procedure of Building Damage Assessment
Damage Function
Building Damage
Ground Shaking (PGA)
∑ Building
23
Ground Shaking (PGA)
DamageRatio
Building Structure
DL4+5
DL3+4+5
DL2+3+4+5
Proposed Damage Function
Category Structural type
1 Masonry 1 Adobe
2 Masonry 2 Brick masonry with mud mortar,
flex roof & 20 years and more
Stone with mud mortar
3 Masonry 3 Brick masonry with mud mortar, rigid roof, &
flex roof within 1~20 years
4 Masonry 4 Brick masonry with cement mortar Stone with cement mortar
5 RC 1 RC non-engineered
6 RC 2 RC engineered with low to mid-rise
Six structure types for center and perimeter areas, respectively
24
0%
20%
40%
60%
80%
100%
0 200 400 600 800
Masonry 1 Masonry 2 Masonry 3
Peak ground acceleration (PGA: cm/sec2, gal)
DamageGrade4+5
0%
20%
40%
60%
80%
100%
0 200 400 600 800
Masonry 1p Masonry 2p Masonry 3p
Masonry 4p RC 1p RC 2p
Peak ground acceleration (PGA: cm/sec2, gal)
DamageGrade4+5
Perimeter area of the ValleyCenter area of the Valley
predominant period Tg > 1.5s predominant period 0.3s < Tg < 1.5s
1 2 3 4 5 6 1 2 3 4 5 6
Estimation of Building Inventory in 2015
Total Number: 444,554 25
Entire Building Inventory Survey in 4 Municipalities
Sampling Building Survey (More than 10,000 Buildings in study area)
Interpretation of Building Footprint using High Resolution Satellite Image
The Urbanization Pattern analysis, Land use mapping, etc
Component Ratio of Building TypesBuilding Number
Estimation of Baseline Inventory for Risk Assessment
Assumption: Heavily damaged buildings (GD4+5) due to Gorkha
Earquake were supposed to be reconstructued with Brick Masonry
with Cement or RC-Engineered.
Total Number: 444,554
26
RC Non-eng. to RC Eng.: 1%
B/S with mud to B/S with cement : 5%
Adobe to B/S with cement : 2%
Baseline inventory
Total Number: 444,554
Building Damage Distribution for Baseline Inventory
27
Building Damage
Distribution
Building Damage Ratio
Distribution
CNS-2CNS-2
Building Damage Estimation (Baseline inventory)
28
Heavy, Moderate and Slight Damage Building
School Building Damage Estimation
29
Damage Distribution (CNS-2)
Scenario
Earthquake
Damage Level
Total (5,731)
DL2 DL3 DL 4 & 5
WN 568 253 237 1,058 18.5%
CNS-1 916 539 737 2,192 38.2%
CNS-2 1,057 810 1,654 3,521 61.4%
CNS-3 960 875 2,486 4,321 75.4%
Damage by Structure Type
Health Facility Building Damage Estimation
30Damage Distribution (CNS-2) Damage by Structure Type
Scenario
Earthquake
Damage Level
Total (584)
DL2 DL3 DL 4 & 5
WN 51 24 20 95 16.3%
CNS-1 85 55 64 204 34.9%
CNS-2 105 83 153 341 58.4%
CNS-3 97 94 235 426 72.9%
Government Building Damage Estimation
31
Scenario
Earthquake
Damage Level
Total (478)
DL2 DL3 DL 4 & 5
WN 44 20 20 84 17.6%
CNS-1 71 44 59 174 36.4%
CNS-2 85 66 126 277 57.9%
CNS-3 80 73 186 339 70.9%
Damage Distribution (CNS-2) Damage by Structure Type
Building Inventory Assumption for 2030
RC Eng. 7%
RC Non-Eng. 48%
Masonry (all) 45%
RC Eng. 20%
RC Non-Eng. 35%
Masonry (all) 45%
RC Eng. 20%
RC Non-Eng. 35%
Masonry (cement) 45%
RC Eng. 55%
RC Non-Eng. 0%
Masonry (cement) 45%
RC Eng. 53%
RC Non-Eng. 24%
Masonry (all) 23%
RC Eng. 69%
RC Non-Eng. 17%
Masonry (all) 14%
Case 0, same as 2016
Case 3 Case 4 Case 5
Case 2Case 1
32
Bldg. at 2016: 444,554
Bldg. at 2030: 606,506
(New bldg.: 161,592)
Building Damage Estimation (2030)
33
Cost: 57,335/year mil. NPRCost: 231,931/year mil. NPR
Cost: 172,761/year mil. NPR
Cost: 209,210/year mil. NPR
Cost: 72,702/year mil. NPR
→ Damage of Infrastructure and Lifeline
Road
Bridge
Water Supply Pipeline
Power Distribution Network
Telecom Network (BTS)
34
Road
35
Hazardous Road Segment of Road Network
Potential area of
Landslide
Potential area of
Landslide
Potential area of
Liquefaction
Potential area of
Liquefaction
Road NetworkRoad Network
Hazardous road segment is identified by comparing the road network with
the potential landslide and liquefaction sites
36
Possible road damage by Liquefaction
Possible road damage by landslide
Road-link Blockage by Building Damage in Kobe Earthquake
37
Width of representative road: Less than 3.5m
Rate of road-link blockage (%)=0.9009×Rate of damaged building(%)+19.845
Width of representative road: 3.5m to < 5.5m
Rate of road-link blockage (%)= 0.3514 ×Rate of damaged building(%)+13.189
Width of representative road: 5.5m to < 13m
Rate of road-link blockage (%)= 0.2229 ×Rate of damaged building(%) -1.5026
(Source: Central Disaster Prevention Council, Japan)
Hazardous Road Segment (CNS-2)
38
By landslide
98.5 km
1.7%
274.9 km
4.7%
Blockage of emergency roadBy blockage
By liquefaction
Bridge
39
Main Mode of Bridge Damage
40
Bridge Fall
http://www.ktr.mlit.go.jp
http://www.city.yokohama.lg.jp
Shear Failure of Pier
Bending Failure of Pier
https://www.hanshin-exp.co.jp
Bridge Inventory
41
62 bridges from DOR bridge database
83 bridges from project survey
Total 145 bridges
Single-span bridges: 73
Multi-span bridges: 72
RC pier: 45 for Evaluation
Others: 27
Bridge Damage Estimation
42
Damage WN CNS-1 CNS-2 CNS-3
Heavy 0 1 12 32
Moderate 2 21 27 11
Slight 18 17 6 2
Water Supply Pipeline
43
Procedure of Damage Estimation for Pipeline
PGA (gal)
Seismic Intensity (MMI)
Liquefaction Potential
Calculation of Damage Rate
by each Grid
Pipe Line Damage Rate
(Damage Spot / Km)
Pipeline
Seismic HazardSeismic Hazard
Water Supply
Network
Water Supply
Network
44
45
Water Supply Pipeline Network
Existing Network Planned Network
(under construction)
46
Damage Estimation of Water Supply Pipeline
Existing Network Planned Network
(under construction)
Damage WN CNS-1 CNS-2 CNS-3
spot 982 1,921 3,496 5,161
spot/km 0.84 1.65 3.00 4.42
Damage WN CNS-1 CNS-2 CNS-3
spot 124 255 460 676
spot/km 0.18 0.36 0.66 0.97
Power Distribution Network
47
Power Pole
Seismic HazardSeismic Hazard
Building Damage RatioBuilding Damage Ratio
Procedure of Damage Estimation for Power Network
48
Number of Power Pole
Damage
Electricity
Network
Electricity
Network
Pole Failure Rate due to
seismic shaking[%]
Pole Failure Rate due to
seismic shaking[%]
Pole Failure Rate due to
building collapse [%]
Pole Failure Rate due to
building collapse [%]
Damage Assessment Procedure for Power Pole
Estimation of Power Pole Damage
49
Total number of poles in KV : 190,851
Damage WN CNS-1 CNS-2 CNS-3
No. of pole 1,327 3,991 9,156 13,992
Ratio 0.7% 2.1% 4.8% 7.3%
Telecom Network (BTS)
50
Damage Estimation Method for Rooftop BTS Tower
51
Ground Shaking
No damageDamage
No damageDamage No damageDamage
Not Function
Not
Function
Function
Not
Function
Damage Estimation of Rooftop BTS Tower
52
Damage WN CNS-1 CNS-2 CNS-3
No. of BTS 43 143 372 601
Ratio 4.1% 13.7% 35.7% 57.6%
Total number of BTS tower : 1,043
→ Human Casualty
53
Procedure of Human Casualty Estimation
PGA
distribution
Building
inventory
Building
damage
Number of
death
Number of
injured
Injured
Rate
Scenario
earthquakes
Damage
function
Population
distribution
Death
Rate
54
Earthquake Occurrence Scenes
2016 Daytime (12:00)Weekday
Night (2:00)
Weekend Daytime (18:00)
Weekday
Weekend
Inside Bldg. : 70%
Inside Bldg. : 100%
Inside Bldg. : 90%
Scene Features of Damage
Night
More human casualty occur
Difficult for speedily evacuation, especially in winter or rainy season,
which may enlarge human casualty
Weekday
Daytime
More human casualty happen in office and commercial facilities, rather
than in home
A large number of people who have to stay in office, commercial facilities
due to transportation problem
Weekend
Daytime
Minimum number of human casualty than the other scenes
May cause delay on search and rescue due to the difficulty of personnel
mobilization
55
Results of Death Estimation
56
Scenario
Earthquake
Earthquake Occurrence Scene
Weekend (18:00) Weekday (12:00) Night
WN 2,123 0.08% 2,784 0.10% 3,034 0.11%
CNS-1 6,393 0.23% 8,282 0.30% 9,133 0.33%
CNS-2 15,526 0.56% 19,959 0.72% 22,179 0.80%
CNS-3 25,008 0.90% 31,956 1.15% 35,726 1.28%
Total population: 2,786,929
Results of Injured Estimation
57
Scenario
Earthquake
Earthquake Occurrence Scene
Weekend (18:00) Weekday (12:00) Night
WN 8,316 0.30% 10,905 0.39% 11,880 0.43%
CNS-1 25,036 0.90% 32,435 1.16% 35,766 1.28%
CNS-2 60,803 2.18% 78,168 2.80% 86,861 3.12%
CNS-3 97,940 3.51% 125,152 4.49% 139,914 5.02%
Results of Evacuee Estimation
58
Scenario
Earthquake
Earthquake Occurrence Scene
Weekend (18:00) Weekday (12:00) Night
WN 279,942 10.0% 285,850 10.3% 279,031 10.0%
CNS-1 645,483 23.2% 652,798 23.4% 642,743 23.1%
CNS-2 1,202,734 43.2% 1,206,530 43.3% 1,196,080 42.9%
CNS-3 1,624,032 58.3% 1,619,792 58.1% 1,613,314 57.9%
Death Distribution (CNS-1, Night)
59
Death Distribution Death Ratio Distribution
Human Casualty due to School Building Damage
60
→ Economic Loss
61
Coverage Sectors for Economic Loss Estimation
Direct damage
Indirect
damage
Tourism
Agriculture
Small and medium-
size enterprise (SME)
Commerce
Building Road Bridge
Water supply Power Communication
Quantitative
Evaluation
62
Note: Quantitative evaluation of indirect loss is difficult because the correlation of indirect
loss cannot be evaluated definitely, thus indirect loss is principally conducted by qualitative
evaluation. As the tourism sector is an important source of foreign exchange earnings, the
decreased amount of production in tourism sector due to the retarded production activities
from earthquake damage is evaluated quantitatively.
Direct Loss Due to Building Damage
Unit: Million NPR
63
Scenario
Ground
Motion
All
Building
School
Government
building
Health
Facility
Historical
Architecture
CNS-3 1,098.353 134,932 22,708 232,782 2,377
CNS-2 761,531 98,171 16,514 165,683 2,267
CNS-1 371,003 51,231 8,669 68,588 1,925
WN 132,999 20,462 2,444 22,534 1,321
Remarks: Director loss of all building includes that of school, government building and health facility.
Direct Loss of Infrastructure and Lifeline
Unit: Million NPR
52.2% 34.7%
51.9%
64
Scenario
Ground
Motion
Road Bridge
Water
Supply
Sewage
Power
Distribution
Mobile
BTS
Total
CNS-3
2,878 1,914 191 290 197 1,142 6,612
43.5% 28.9% 2.9% 4.4% 3.0% 17.3% 100.0%
CNS-2
1,620 1,359 129 200 129 707 4,144
39.1% 32.8% 3.1% 4.8% 3.1% 17.1% 100.0%
CNS-1
471 898 71 135 56 272 1903
24.8% 47.2% 3.7% 7.1% 2.9% 14.3% 100.0%
WN
0 377 36 76 19 82 590
0.0% 63.9% 6.1% 12.9% 3.2% 13.9% 100.0%
Direct Loss of Building & Infrastructure
99.6%
99.5%
Unit: Million NPR
0 200,000 400,000 600,000 800,000 1,000,000 1,200,000
WN
CNS-1
CNS-2
CNS-3
Building
Infrastructure
99.5%
99.5%
99.4%
1,104,965
765,675
99.6%
371,275
133,589
65
Procedure for Indirect Loss
Occurrence of
an earthquake
Decline
in
Tourists
Job loss
in
Tourism
sector
Decline
of tourist
spending
Decline of
Foreign
exchange
earning
Decline
of
GDP
66
Decline of Number of Tourists
67
0
100,000
200,000
300,000
400,000
500,000
600,000
700,000
800,000
900,000
WN
CNS-1
CNS-2
CNS-3
400,000
640,000
560,000
480,000
440,000
640,000
560,000
480,000
440,000
Before
Earthquake
After
Earthquake
(within 1 year)
After
Earthquake
(after 12 months~
within 24 months)
After
Earthquake
(after 24 months~
within 36 months)
800,000
480,000
320,000
280,000
Unit: Tourists
Note: Estimated based on the tourism stats of Nepal
Impact on GDP by Tourist Sector
Note: Estimated based on the data of Ministry of culture, Tourism & Aviation
68
2,120 2,120 2,120 2,120
2,075
2,066
2,059
2,055
2,020
2,040
2,060
2,080
2,100
2,120
2,140
WN CNS-1 CNS-2 CNS-3
Before Earthquake
After Earthquake2.15% decrease
2.53% decrease
2.88% decrease
3.09% decrease
Unit: Billion NPR
Remarks: This impact for GDP does not include the impact due to other industry except
for tourism industry , therefore actual impact for GDP is estimated bigger than this estimation.
→ Conclusions
69
Damage Characteristics of Scenario Earthquakes
Central Nepal south scenario earthquake will damage more
than Gorkha earthquake.
Large number of buildings in KV are highly vulnerable,
including school, hospital and government buildings.
Risk of building damage and human casualty will be
increased in future if no measure is taken to strengthen
building seismic performance.
Although infrastructure and lifeline system had no significant
damage in Gorkha earthquake, there will be more damages
when strong earthquake happens.
The new water supply network (under construction)
significantly reduces the risk with respect to the existing one.
The majority of the damage of rooftop BTS will be by the
building damage.
70
Utilization of Risk Assessment Results in this Project
The risk assessment results will be utilized for the municipal
disaster risk reduction and management plan for the three
pilot municipalities within this project and could be used for
the same purpose for the whole KV.
The risk assessment results provide basic information for
determining the risk reduction target based on the time
span and available budget, technology, etc.
The results of human casualty provide the useful
information on the stockpiling of water, food, emergency
materials as well as securing the evacuation routes and
spaces.
71
Recommendations
Results of risk assessment depends largely on results of
seismic hazard.
Three ground motion levels of Central Nepal South (CNS)
Scenario Earthquake were targeted for risk assessment
due to the uncertainties in the estimation of future
ground motion. Further research on Gorkha earthquake
is necessary. Should be updated for new findings.
Building inventory for whole KV is not existed and data for
infrastructure and lifeline networks is not completely
maintained.
Development and its regular updating of GIS database of
buildings, infrastructure and lifeline network is very
important for the development of disaster risk reduction
and management plan and routine maintenance works.
72
Recommendations (cont.)
Large number of buildings, including school, health facilities
and government buildings, are estimated to suffer heavy
damage for the scenario earthquakes. Strengthening of
buildings is a big issue for both new and existing buildings.
NBC, specially NBC 105, has to be revised.
Enforce NBC for all new buildings
Promotion of seismic strengthening of existing buildings, via.
retrofitting or reconstruction through policy, legal means,
budget arrangement, technology development as well as
public awareness.
For seismic risk reduction, risk assessment for whole Nepal is
considered necessary. Has to be started immediately for other
Metro city like Pokhara, Chitwan, etc.
Based on the risk assessment results, the government
organizations and utility companies could make their Business
Continuity Plan (BCP). 73

More Related Content

Similar to 2. ERAKV- 2nd seminar: Risk Assessment

Detrminiation of building damage in subcidence regions
Detrminiation of building damage in subcidence regionsDetrminiation of building damage in subcidence regions
Detrminiation of building damage in subcidence regions
Ali Saeidi
 
Design and Analysis of a Multistory Reinforced Concrete Frame in Different Se...
Design and Analysis of a Multistory Reinforced Concrete Frame in Different Se...Design and Analysis of a Multistory Reinforced Concrete Frame in Different Se...
Design and Analysis of a Multistory Reinforced Concrete Frame in Different Se...
ijtsrd
 
Rapid visual screening of critical facilities in the Kingston Metropolit
Rapid visual screening of critical facilities in the Kingston MetropolitRapid visual screening of critical facilities in the Kingston Metropolit
Rapid visual screening of critical facilities in the Kingston Metropolit
Christopher Gayle M.Eng
 
Seismic Analysis of Structures under Different Soil Conditions
Seismic Analysis of Structures under Different Soil ConditionsSeismic Analysis of Structures under Different Soil Conditions
Seismic Analysis of Structures under Different Soil Conditions
IJERA Editor
 
Soil-structure interaction uncertainties and their effects on the development...
Soil-structure interaction uncertainties and their effects on the development...Soil-structure interaction uncertainties and their effects on the development...
Soil-structure interaction uncertainties and their effects on the development...
Ali Saeidi
 
ICLR Friday Forum: Sea level rise vulnerability assessments (February 22, 2019)
ICLR Friday Forum: Sea level rise vulnerability assessments (February 22, 2019)ICLR Friday Forum: Sea level rise vulnerability assessments (February 22, 2019)
ICLR Friday Forum: Sea level rise vulnerability assessments (February 22, 2019)
glennmcgillivray
 

Similar to 2. ERAKV- 2nd seminar: Risk Assessment (20)

3 erakv 3rd seminar_risk
3 erakv 3rd seminar_risk3 erakv 3rd seminar_risk
3 erakv 3rd seminar_risk
 
Geotechnical risk on large scale infrastructure projects
Geotechnical risk on large scale infrastructure projectsGeotechnical risk on large scale infrastructure projects
Geotechnical risk on large scale infrastructure projects
 
Guidelines for Planning and Construction of Roads in cyclone Prone Areas
Guidelines for Planning and Construction of Roads in cyclone Prone AreasGuidelines for Planning and Construction of Roads in cyclone Prone Areas
Guidelines for Planning and Construction of Roads in cyclone Prone Areas
 
Earthquake design
Earthquake designEarthquake design
Earthquake design
 
Detrminiation of building damage in subcidence regions
Detrminiation of building damage in subcidence regionsDetrminiation of building damage in subcidence regions
Detrminiation of building damage in subcidence regions
 
Slope stability analysis using flac 3D
Slope stability analysis using flac 3DSlope stability analysis using flac 3D
Slope stability analysis using flac 3D
 
IRJET-Investigation of Landslides and its Effects on Kothagiri
IRJET-Investigation of Landslides and its Effects on KothagiriIRJET-Investigation of Landslides and its Effects on Kothagiri
IRJET-Investigation of Landslides and its Effects on Kothagiri
 
IRJET- Soil Mass Movement with Recent Deluge in Kerala as Backdrop
IRJET- Soil Mass Movement with Recent Deluge in Kerala as BackdropIRJET- Soil Mass Movement with Recent Deluge in Kerala as Backdrop
IRJET- Soil Mass Movement with Recent Deluge in Kerala as Backdrop
 
Design and Analysis of a Multistory Reinforced Concrete Frame in Different Se...
Design and Analysis of a Multistory Reinforced Concrete Frame in Different Se...Design and Analysis of a Multistory Reinforced Concrete Frame in Different Se...
Design and Analysis of a Multistory Reinforced Concrete Frame in Different Se...
 
Rapid visual screening of critical facilities in the Kingston Metropolit
Rapid visual screening of critical facilities in the Kingston MetropolitRapid visual screening of critical facilities in the Kingston Metropolit
Rapid visual screening of critical facilities in the Kingston Metropolit
 
Effect of shear wall position in multi-storied building
Effect of shear wall position in multi-storied buildingEffect of shear wall position in multi-storied building
Effect of shear wall position in multi-storied building
 
IRJET - A Study on Behaviour of RCC Structures for Near and Far Field Earthqu...
IRJET - A Study on Behaviour of RCC Structures for Near and Far Field Earthqu...IRJET - A Study on Behaviour of RCC Structures for Near and Far Field Earthqu...
IRJET - A Study on Behaviour of RCC Structures for Near and Far Field Earthqu...
 
Seismic Analysis of Structures under Different Soil Conditions
Seismic Analysis of Structures under Different Soil ConditionsSeismic Analysis of Structures under Different Soil Conditions
Seismic Analysis of Structures under Different Soil Conditions
 
KRCL Case Study
KRCL Case StudyKRCL Case Study
KRCL Case Study
 
2017 MAIREINFRA Conference, Seoul, South Korea, July 19-21.
2017 MAIREINFRA Conference, Seoul, South Korea, July 19-21.2017 MAIREINFRA Conference, Seoul, South Korea, July 19-21.
2017 MAIREINFRA Conference, Seoul, South Korea, July 19-21.
 
Comparative Study on Seismic and Wind forces on RCC Structure
Comparative Study on Seismic and Wind forces on RCC StructureComparative Study on Seismic and Wind forces on RCC Structure
Comparative Study on Seismic and Wind forces on RCC Structure
 
Soil-structure interaction uncertainties and their effects on the development...
Soil-structure interaction uncertainties and their effects on the development...Soil-structure interaction uncertainties and their effects on the development...
Soil-structure interaction uncertainties and their effects on the development...
 
Ayush_EQ_term_ppt.pptx
Ayush_EQ_term_ppt.pptxAyush_EQ_term_ppt.pptx
Ayush_EQ_term_ppt.pptx
 
ICLR Friday Forum: Sea level rise vulnerability assessments (February 22, 2019)
ICLR Friday Forum: Sea level rise vulnerability assessments (February 22, 2019)ICLR Friday Forum: Sea level rise vulnerability assessments (February 22, 2019)
ICLR Friday Forum: Sea level rise vulnerability assessments (February 22, 2019)
 
Probabilstic seismic risk evaluation of rc buildings (2)
Probabilstic seismic risk evaluation of rc buildings (2)Probabilstic seismic risk evaluation of rc buildings (2)
Probabilstic seismic risk evaluation of rc buildings (2)
 

More from Subhechha Sharma

More from Subhechha Sharma (14)

[JICA ERAKV] 4th Newletter (Final)
[JICA ERAKV] 4th Newletter (Final)[JICA ERAKV] 4th Newletter (Final)
[JICA ERAKV] 4th Newletter (Final)
 
Erakv project pamphlet_english_version
Erakv project pamphlet_english_versionErakv project pamphlet_english_version
Erakv project pamphlet_english_version
 
Erakv project pamphlet_nepali_version
Erakv project pamphlet_nepali_versionErakv project pamphlet_nepali_version
Erakv project pamphlet_nepali_version
 
5 erakv final_seminar_cbdrrm
5 erakv final_seminar_cbdrrm5 erakv final_seminar_cbdrrm
5 erakv final_seminar_cbdrrm
 
4 erakv 3rd seminar_sop_ldcrp
4 erakv 3rd seminar_sop_ldcrp4 erakv 3rd seminar_sop_ldcrp
4 erakv 3rd seminar_sop_ldcrp
 
2 erakv final seminar_seismic hazard
2 erakv final seminar_seismic hazard2 erakv final seminar_seismic hazard
2 erakv final seminar_seismic hazard
 
1 erakv 3nd seminar_outline and results of the project
1 erakv 3nd seminar_outline and results of the project1 erakv 3nd seminar_outline and results of the project
1 erakv 3nd seminar_outline and results of the project
 
9 erakv drr mainstreaming
9 erakv drr mainstreaming9 erakv drr mainstreaming
9 erakv drr mainstreaming
 
8 erakv 3rd seminar_infra
8 erakv 3rd seminar_infra8 erakv 3rd seminar_infra
8 erakv 3rd seminar_infra
 
7 erakv 3rd seminar_building
7 erakv 3rd seminar_building7 erakv 3rd seminar_building
7 erakv 3rd seminar_building
 
6 disaster management act
6 disaster management act6 disaster management act
6 disaster management act
 
3. ERAKV 2nd Seminar-Investment
3. ERAKV 2nd Seminar-Investment 3. ERAKV 2nd Seminar-Investment
3. ERAKV 2nd Seminar-Investment
 
Erakv 3rd Newsletter
Erakv 3rd NewsletterErakv 3rd Newsletter
Erakv 3rd Newsletter
 
1. Erakv 2nd seminar: Introduction of the project and its overall progress
1. Erakv 2nd seminar: Introduction of the project and its overall progress1. Erakv 2nd seminar: Introduction of the project and its overall progress
1. Erakv 2nd seminar: Introduction of the project and its overall progress
 

Recently uploaded

Laundry management system project report.pdf
Laundry management system project report.pdfLaundry management system project report.pdf
Laundry management system project report.pdf
Kamal Acharya
 
Digital Signal Processing Lecture notes n.pdf
Digital Signal Processing Lecture notes n.pdfDigital Signal Processing Lecture notes n.pdf
Digital Signal Processing Lecture notes n.pdf
AbrahamGadissa
 
Standard Reomte Control Interface - Neometrix
Standard Reomte Control Interface - NeometrixStandard Reomte Control Interface - Neometrix
Standard Reomte Control Interface - Neometrix
Neometrix_Engineering_Pvt_Ltd
 
RS Khurmi Machine Design Clutch and Brake Exercise Numerical Solutions
RS Khurmi Machine Design Clutch and Brake Exercise Numerical SolutionsRS Khurmi Machine Design Clutch and Brake Exercise Numerical Solutions
RS Khurmi Machine Design Clutch and Brake Exercise Numerical Solutions
Atif Razi
 
ONLINE VEHICLE RENTAL SYSTEM PROJECT REPORT.pdf
ONLINE VEHICLE RENTAL SYSTEM PROJECT REPORT.pdfONLINE VEHICLE RENTAL SYSTEM PROJECT REPORT.pdf
ONLINE VEHICLE RENTAL SYSTEM PROJECT REPORT.pdf
Kamal Acharya
 
Automobile Management System Project Report.pdf
Automobile Management System Project Report.pdfAutomobile Management System Project Report.pdf
Automobile Management System Project Report.pdf
Kamal Acharya
 
Hall booking system project report .pdf
Hall booking system project report  .pdfHall booking system project report  .pdf
Hall booking system project report .pdf
Kamal Acharya
 
Online blood donation management system project.pdf
Online blood donation management system project.pdfOnline blood donation management system project.pdf
Online blood donation management system project.pdf
Kamal Acharya
 
CFD Simulation of By-pass Flow in a HRSG module by R&R Consult.pptx
CFD Simulation of By-pass Flow in a HRSG module by R&R Consult.pptxCFD Simulation of By-pass Flow in a HRSG module by R&R Consult.pptx
CFD Simulation of By-pass Flow in a HRSG module by R&R Consult.pptx
R&R Consult
 
Fruit shop management system project report.pdf
Fruit shop management system project report.pdfFruit shop management system project report.pdf
Fruit shop management system project report.pdf
Kamal Acharya
 

Recently uploaded (20)

Arduino based vehicle speed tracker project
Arduino based vehicle speed tracker projectArduino based vehicle speed tracker project
Arduino based vehicle speed tracker project
 
Laundry management system project report.pdf
Laundry management system project report.pdfLaundry management system project report.pdf
Laundry management system project report.pdf
 
Digital Signal Processing Lecture notes n.pdf
Digital Signal Processing Lecture notes n.pdfDigital Signal Processing Lecture notes n.pdf
Digital Signal Processing Lecture notes n.pdf
 
Standard Reomte Control Interface - Neometrix
Standard Reomte Control Interface - NeometrixStandard Reomte Control Interface - Neometrix
Standard Reomte Control Interface - Neometrix
 
RS Khurmi Machine Design Clutch and Brake Exercise Numerical Solutions
RS Khurmi Machine Design Clutch and Brake Exercise Numerical SolutionsRS Khurmi Machine Design Clutch and Brake Exercise Numerical Solutions
RS Khurmi Machine Design Clutch and Brake Exercise Numerical Solutions
 
ONLINE VEHICLE RENTAL SYSTEM PROJECT REPORT.pdf
ONLINE VEHICLE RENTAL SYSTEM PROJECT REPORT.pdfONLINE VEHICLE RENTAL SYSTEM PROJECT REPORT.pdf
ONLINE VEHICLE RENTAL SYSTEM PROJECT REPORT.pdf
 
Online resume builder management system project report.pdf
Online resume builder management system project report.pdfOnline resume builder management system project report.pdf
Online resume builder management system project report.pdf
 
Automobile Management System Project Report.pdf
Automobile Management System Project Report.pdfAutomobile Management System Project Report.pdf
Automobile Management System Project Report.pdf
 
Democratizing Fuzzing at Scale by Abhishek Arya
Democratizing Fuzzing at Scale by Abhishek AryaDemocratizing Fuzzing at Scale by Abhishek Arya
Democratizing Fuzzing at Scale by Abhishek Arya
 
Introduction to Machine Learning Unit-4 Notes for II-II Mechanical Engineering
Introduction to Machine Learning Unit-4 Notes for II-II Mechanical EngineeringIntroduction to Machine Learning Unit-4 Notes for II-II Mechanical Engineering
Introduction to Machine Learning Unit-4 Notes for II-II Mechanical Engineering
 
Halogenation process of chemical process industries
Halogenation process of chemical process industriesHalogenation process of chemical process industries
Halogenation process of chemical process industries
 
Hall booking system project report .pdf
Hall booking system project report  .pdfHall booking system project report  .pdf
Hall booking system project report .pdf
 
Online blood donation management system project.pdf
Online blood donation management system project.pdfOnline blood donation management system project.pdf
Online blood donation management system project.pdf
 
CFD Simulation of By-pass Flow in a HRSG module by R&R Consult.pptx
CFD Simulation of By-pass Flow in a HRSG module by R&R Consult.pptxCFD Simulation of By-pass Flow in a HRSG module by R&R Consult.pptx
CFD Simulation of By-pass Flow in a HRSG module by R&R Consult.pptx
 
Explosives Industry manufacturing process.pdf
Explosives Industry manufacturing process.pdfExplosives Industry manufacturing process.pdf
Explosives Industry manufacturing process.pdf
 
KIT-601 Lecture Notes-UNIT-5.pdf Frame Works and Visualization
KIT-601 Lecture Notes-UNIT-5.pdf Frame Works and VisualizationKIT-601 Lecture Notes-UNIT-5.pdf Frame Works and Visualization
KIT-601 Lecture Notes-UNIT-5.pdf Frame Works and Visualization
 
Fruit shop management system project report.pdf
Fruit shop management system project report.pdfFruit shop management system project report.pdf
Fruit shop management system project report.pdf
 
Courier management system project report.pdf
Courier management system project report.pdfCourier management system project report.pdf
Courier management system project report.pdf
 
Event Management System Vb Net Project Report.pdf
Event Management System Vb Net  Project Report.pdfEvent Management System Vb Net  Project Report.pdf
Event Management System Vb Net Project Report.pdf
 
A CASE STUDY ON ONLINE TICKET BOOKING SYSTEM PROJECT.pdf
A CASE STUDY ON ONLINE TICKET BOOKING SYSTEM PROJECT.pdfA CASE STUDY ON ONLINE TICKET BOOKING SYSTEM PROJECT.pdf
A CASE STUDY ON ONLINE TICKET BOOKING SYSTEM PROJECT.pdf
 

2. ERAKV- 2nd seminar: Risk Assessment

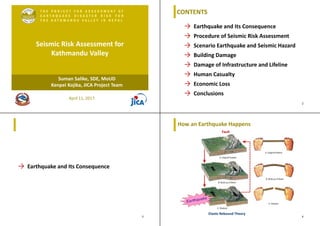
  • 1. T H E P R O J E C T F O R A S S E S S M E N T O F E A R T H Q U A K E D I S A S T E R R I S K F O R T H E K A T H M A N D U V A L L E Y I N N E P A L April 11, 2017 Seismic Risk Assessment for Kathmandu Valley Suman Salike, SDE, MoUD Kenpei Kojika, JICA Project Team CONTENTS → Earthquake and Its Consequence → Procedure of Seismic Risk Assessment → Scenario Earthquake and Seismic Hazard → Building Damage → Damage of Infrastructure and Lifeline → Human Casualty → Economic Loss → Conclusions 2 → Earthquake and Its Consequence 3 How an Earthquake Happens Elastic Rebound Theory 4 Fault
  • 2. Where the Earthquake Happens Antarctic plate African plate South American plate Indian plate Eurasian plate Philippine sea plate Pacific plate North American plate Plate Boundary or Fault inside Plate Source of Gorkha Earthquake (from S. Wesnousky, et.al.) 5 Characteristics of the Earthquake X 31.6X 1000X Magnitude and Intensity Distribution of Gorkha Earthquake (from USGS) Difference of Magnitude and its energy 6 Magnitude describes the energy released by an earthquake (e.g. Richter scale) Intensity gives the information of ground shaking strength and related to damage degree, changing with the distance from the site to the source of earthquake (e.g. MMI) M=7.8 VIII VII VI Diversity of Earthquake Consequence Building Damage Fire Landslide Tsunami Liquefaction 7 → Procedure of Seismic Risk Assessment 8
  • 3. Hazard: A dangerous phenomenon, substance, human activity or condition that may cause loss of life, injury or other health impacts, property damage, loss of livelihoods and services, social and economic disruption, or environmental damage Vulnerability: The characteristics and circumstances of a community, system or asset that make it susceptible to the damaging effects of a hazard Definition of Disaster Risk Exposure: People, property, systems, or other elements present in hazard zones that are thereby subject to potential losses Disaster risk = Hazard * Vulnerability * Exposure RISK Hazard Exposure Vulnerability Hazard, exposure, vulnerability and disaster risk (According to ISDR) 9 Law, Regulation Avoidance Sustainable Development Components of Disaster Risk Management 10 We Are Here Approach of Seismic Hazard and Risk Assessment Earthquake Source Site response Attenuation Total risk is determined by the intensity of ground motion, vulnerability of structure and the number of vulnerable structures 11 Target of Seismic Risk Assessment Building Road Bridge Water & Sewage Power & Communication Human and Economic Loss 12
  • 4. → Scenario Earthquake and Seismic Hazard 13 Scenario Earthquakes Thomas Ader et al. 2012 J. R. Elliote et al. 2016 2015 Gorkha Earthquake 14 (1) Far-Mid Western Nepal M=8.6 (2) Western Nepal (3) Central Nepal South M=7.8 M=7.8 1934 Bihar Earthquake Ground Shaking Level for Risk Assessment 15 Gorkha Earthquake Scenario Earthquake Fault Model (1) (2) (3) CNS-2/CNS-1 ≅ 1.5 CNS-3/CNS-1 ≅ 2.0 Peak Ground Acceleration (PGA) Distribution Case WN Case CNS-1 Case CNS-2 Case CNS-3 Gorkha earthquake (estimated for verification) 16 150 - 200 150 - 400 150 - 200 300 - 800250 - 600
  • 5. Intensity (MMI) Distribution Case WN Case CNS-1 Case CNS-2 Case CNS-3 17 Gorkha earthquake (estimated for verification) Liquefaction Distribution Case WN Case CNS-1 Case CNS-2 Case CNS-3 18 Case WN Case CNS-1 Case CNS-2 Case CNS-3 Rainy Season High potential Moderate potential Low potential Dry Season Note: Due to soil properties are insufficient, some assumption are made for the liquefaction estimation Slope Failure Distribution Case WN Case CNS-1 Case CNS-2 Case CNS-3 19 Note: Due to soil properties are insufficient, some assumption are made for the slope failure estimation → Building Damage 20
  • 6. Damage of Gorkha Earthquake Kathmandu Durbar Square (2015/5/6) Bhaktapur (2015/5/7) Gongabu (2015/5/23) Sankhu (2017/3/24)Sankhu (2015/5/23) Gongabu (2017/3/24) 21 NowImmediately after earthquake Masonry RC building Level 1: Negligible to slight damage No structural damage, slight non- structural damage) Level 2: Moderate damage Slight structural damage, moderate non- structural damage Level 3: Substantial to heavy damage Moderate structural damage, heavy non- structural damage Level 4: Very heavy damage Heavy structural damage, very heavy non-structural damage Level 5: Destruction Very heavy structural damage, collapse of ground floor or parts of buildings. Building Damage Level European Macroseismic Scale (EMS) 1998 22 Procedure of Building Damage Assessment Damage Function Building Damage Ground Shaking (PGA) ∑ Building 23 Ground Shaking (PGA) DamageRatio Building Structure DL4+5 DL3+4+5 DL2+3+4+5 Proposed Damage Function Category Structural type 1 Masonry 1 Adobe 2 Masonry 2 Brick masonry with mud mortar, flex roof & 20 years and more Stone with mud mortar 3 Masonry 3 Brick masonry with mud mortar, rigid roof, & flex roof within 1~20 years 4 Masonry 4 Brick masonry with cement mortar Stone with cement mortar 5 RC 1 RC non-engineered 6 RC 2 RC engineered with low to mid-rise Six structure types for center and perimeter areas, respectively 24 0% 20% 40% 60% 80% 100% 0 200 400 600 800 Masonry 1 Masonry 2 Masonry 3 Peak ground acceleration (PGA: cm/sec2, gal) DamageGrade4+5 0% 20% 40% 60% 80% 100% 0 200 400 600 800 Masonry 1p Masonry 2p Masonry 3p Masonry 4p RC 1p RC 2p Peak ground acceleration (PGA: cm/sec2, gal) DamageGrade4+5 Perimeter area of the ValleyCenter area of the Valley predominant period Tg > 1.5s predominant period 0.3s < Tg < 1.5s 1 2 3 4 5 6 1 2 3 4 5 6
  • 7. Estimation of Building Inventory in 2015 Total Number: 444,554 25 Entire Building Inventory Survey in 4 Municipalities Sampling Building Survey (More than 10,000 Buildings in study area) Interpretation of Building Footprint using High Resolution Satellite Image The Urbanization Pattern analysis, Land use mapping, etc Component Ratio of Building TypesBuilding Number Estimation of Baseline Inventory for Risk Assessment Assumption: Heavily damaged buildings (GD4+5) due to Gorkha Earquake were supposed to be reconstructued with Brick Masonry with Cement or RC-Engineered. Total Number: 444,554 26 RC Non-eng. to RC Eng.: 1% B/S with mud to B/S with cement : 5% Adobe to B/S with cement : 2% Baseline inventory Total Number: 444,554 Building Damage Distribution for Baseline Inventory 27 Building Damage Distribution Building Damage Ratio Distribution CNS-2CNS-2 Building Damage Estimation (Baseline inventory) 28 Heavy, Moderate and Slight Damage Building
  • 8. School Building Damage Estimation 29 Damage Distribution (CNS-2) Scenario Earthquake Damage Level Total (5,731) DL2 DL3 DL 4 & 5 WN 568 253 237 1,058 18.5% CNS-1 916 539 737 2,192 38.2% CNS-2 1,057 810 1,654 3,521 61.4% CNS-3 960 875 2,486 4,321 75.4% Damage by Structure Type Health Facility Building Damage Estimation 30Damage Distribution (CNS-2) Damage by Structure Type Scenario Earthquake Damage Level Total (584) DL2 DL3 DL 4 & 5 WN 51 24 20 95 16.3% CNS-1 85 55 64 204 34.9% CNS-2 105 83 153 341 58.4% CNS-3 97 94 235 426 72.9% Government Building Damage Estimation 31 Scenario Earthquake Damage Level Total (478) DL2 DL3 DL 4 & 5 WN 44 20 20 84 17.6% CNS-1 71 44 59 174 36.4% CNS-2 85 66 126 277 57.9% CNS-3 80 73 186 339 70.9% Damage Distribution (CNS-2) Damage by Structure Type Building Inventory Assumption for 2030 RC Eng. 7% RC Non-Eng. 48% Masonry (all) 45% RC Eng. 20% RC Non-Eng. 35% Masonry (all) 45% RC Eng. 20% RC Non-Eng. 35% Masonry (cement) 45% RC Eng. 55% RC Non-Eng. 0% Masonry (cement) 45% RC Eng. 53% RC Non-Eng. 24% Masonry (all) 23% RC Eng. 69% RC Non-Eng. 17% Masonry (all) 14% Case 0, same as 2016 Case 3 Case 4 Case 5 Case 2Case 1 32 Bldg. at 2016: 444,554 Bldg. at 2030: 606,506 (New bldg.: 161,592)
  • 9. Building Damage Estimation (2030) 33 Cost: 57,335/year mil. NPRCost: 231,931/year mil. NPR Cost: 172,761/year mil. NPR Cost: 209,210/year mil. NPR Cost: 72,702/year mil. NPR → Damage of Infrastructure and Lifeline Road Bridge Water Supply Pipeline Power Distribution Network Telecom Network (BTS) 34 Road 35 Hazardous Road Segment of Road Network Potential area of Landslide Potential area of Landslide Potential area of Liquefaction Potential area of Liquefaction Road NetworkRoad Network Hazardous road segment is identified by comparing the road network with the potential landslide and liquefaction sites 36 Possible road damage by Liquefaction Possible road damage by landslide
  • 10. Road-link Blockage by Building Damage in Kobe Earthquake 37 Width of representative road: Less than 3.5m Rate of road-link blockage (%)=0.9009×Rate of damaged building(%)+19.845 Width of representative road: 3.5m to < 5.5m Rate of road-link blockage (%)= 0.3514 ×Rate of damaged building(%)+13.189 Width of representative road: 5.5m to < 13m Rate of road-link blockage (%)= 0.2229 ×Rate of damaged building(%) -1.5026 (Source: Central Disaster Prevention Council, Japan) Hazardous Road Segment (CNS-2) 38 By landslide 98.5 km 1.7% 274.9 km 4.7% Blockage of emergency roadBy blockage By liquefaction Bridge 39 Main Mode of Bridge Damage 40 Bridge Fall http://www.ktr.mlit.go.jp http://www.city.yokohama.lg.jp Shear Failure of Pier Bending Failure of Pier https://www.hanshin-exp.co.jp
  • 11. Bridge Inventory 41 62 bridges from DOR bridge database 83 bridges from project survey Total 145 bridges Single-span bridges: 73 Multi-span bridges: 72 RC pier: 45 for Evaluation Others: 27 Bridge Damage Estimation 42 Damage WN CNS-1 CNS-2 CNS-3 Heavy 0 1 12 32 Moderate 2 21 27 11 Slight 18 17 6 2 Water Supply Pipeline 43 Procedure of Damage Estimation for Pipeline PGA (gal) Seismic Intensity (MMI) Liquefaction Potential Calculation of Damage Rate by each Grid Pipe Line Damage Rate (Damage Spot / Km) Pipeline Seismic HazardSeismic Hazard Water Supply Network Water Supply Network 44
  • 12. 45 Water Supply Pipeline Network Existing Network Planned Network (under construction) 46 Damage Estimation of Water Supply Pipeline Existing Network Planned Network (under construction) Damage WN CNS-1 CNS-2 CNS-3 spot 982 1,921 3,496 5,161 spot/km 0.84 1.65 3.00 4.42 Damage WN CNS-1 CNS-2 CNS-3 spot 124 255 460 676 spot/km 0.18 0.36 0.66 0.97 Power Distribution Network 47 Power Pole Seismic HazardSeismic Hazard Building Damage RatioBuilding Damage Ratio Procedure of Damage Estimation for Power Network 48 Number of Power Pole Damage Electricity Network Electricity Network Pole Failure Rate due to seismic shaking[%] Pole Failure Rate due to seismic shaking[%] Pole Failure Rate due to building collapse [%] Pole Failure Rate due to building collapse [%] Damage Assessment Procedure for Power Pole
  • 13. Estimation of Power Pole Damage 49 Total number of poles in KV : 190,851 Damage WN CNS-1 CNS-2 CNS-3 No. of pole 1,327 3,991 9,156 13,992 Ratio 0.7% 2.1% 4.8% 7.3% Telecom Network (BTS) 50 Damage Estimation Method for Rooftop BTS Tower 51 Ground Shaking No damageDamage No damageDamage No damageDamage Not Function Not Function Function Not Function Damage Estimation of Rooftop BTS Tower 52 Damage WN CNS-1 CNS-2 CNS-3 No. of BTS 43 143 372 601 Ratio 4.1% 13.7% 35.7% 57.6% Total number of BTS tower : 1,043
  • 14. → Human Casualty 53 Procedure of Human Casualty Estimation PGA distribution Building inventory Building damage Number of death Number of injured Injured Rate Scenario earthquakes Damage function Population distribution Death Rate 54 Earthquake Occurrence Scenes 2016 Daytime (12:00)Weekday Night (2:00) Weekend Daytime (18:00) Weekday Weekend Inside Bldg. : 70% Inside Bldg. : 100% Inside Bldg. : 90% Scene Features of Damage Night More human casualty occur Difficult for speedily evacuation, especially in winter or rainy season, which may enlarge human casualty Weekday Daytime More human casualty happen in office and commercial facilities, rather than in home A large number of people who have to stay in office, commercial facilities due to transportation problem Weekend Daytime Minimum number of human casualty than the other scenes May cause delay on search and rescue due to the difficulty of personnel mobilization 55 Results of Death Estimation 56 Scenario Earthquake Earthquake Occurrence Scene Weekend (18:00) Weekday (12:00) Night WN 2,123 0.08% 2,784 0.10% 3,034 0.11% CNS-1 6,393 0.23% 8,282 0.30% 9,133 0.33% CNS-2 15,526 0.56% 19,959 0.72% 22,179 0.80% CNS-3 25,008 0.90% 31,956 1.15% 35,726 1.28% Total population: 2,786,929
  • 15. Results of Injured Estimation 57 Scenario Earthquake Earthquake Occurrence Scene Weekend (18:00) Weekday (12:00) Night WN 8,316 0.30% 10,905 0.39% 11,880 0.43% CNS-1 25,036 0.90% 32,435 1.16% 35,766 1.28% CNS-2 60,803 2.18% 78,168 2.80% 86,861 3.12% CNS-3 97,940 3.51% 125,152 4.49% 139,914 5.02% Results of Evacuee Estimation 58 Scenario Earthquake Earthquake Occurrence Scene Weekend (18:00) Weekday (12:00) Night WN 279,942 10.0% 285,850 10.3% 279,031 10.0% CNS-1 645,483 23.2% 652,798 23.4% 642,743 23.1% CNS-2 1,202,734 43.2% 1,206,530 43.3% 1,196,080 42.9% CNS-3 1,624,032 58.3% 1,619,792 58.1% 1,613,314 57.9% Death Distribution (CNS-1, Night) 59 Death Distribution Death Ratio Distribution Human Casualty due to School Building Damage 60
  • 16. → Economic Loss 61 Coverage Sectors for Economic Loss Estimation Direct damage Indirect damage Tourism Agriculture Small and medium- size enterprise (SME) Commerce Building Road Bridge Water supply Power Communication Quantitative Evaluation 62 Note: Quantitative evaluation of indirect loss is difficult because the correlation of indirect loss cannot be evaluated definitely, thus indirect loss is principally conducted by qualitative evaluation. As the tourism sector is an important source of foreign exchange earnings, the decreased amount of production in tourism sector due to the retarded production activities from earthquake damage is evaluated quantitatively. Direct Loss Due to Building Damage Unit: Million NPR 63 Scenario Ground Motion All Building School Government building Health Facility Historical Architecture CNS-3 1,098.353 134,932 22,708 232,782 2,377 CNS-2 761,531 98,171 16,514 165,683 2,267 CNS-1 371,003 51,231 8,669 68,588 1,925 WN 132,999 20,462 2,444 22,534 1,321 Remarks: Director loss of all building includes that of school, government building and health facility. Direct Loss of Infrastructure and Lifeline Unit: Million NPR 52.2% 34.7% 51.9% 64 Scenario Ground Motion Road Bridge Water Supply Sewage Power Distribution Mobile BTS Total CNS-3 2,878 1,914 191 290 197 1,142 6,612 43.5% 28.9% 2.9% 4.4% 3.0% 17.3% 100.0% CNS-2 1,620 1,359 129 200 129 707 4,144 39.1% 32.8% 3.1% 4.8% 3.1% 17.1% 100.0% CNS-1 471 898 71 135 56 272 1903 24.8% 47.2% 3.7% 7.1% 2.9% 14.3% 100.0% WN 0 377 36 76 19 82 590 0.0% 63.9% 6.1% 12.9% 3.2% 13.9% 100.0%
  • 17. Direct Loss of Building & Infrastructure 99.6% 99.5% Unit: Million NPR 0 200,000 400,000 600,000 800,000 1,000,000 1,200,000 WN CNS-1 CNS-2 CNS-3 Building Infrastructure 99.5% 99.5% 99.4% 1,104,965 765,675 99.6% 371,275 133,589 65 Procedure for Indirect Loss Occurrence of an earthquake Decline in Tourists Job loss in Tourism sector Decline of tourist spending Decline of Foreign exchange earning Decline of GDP 66 Decline of Number of Tourists 67 0 100,000 200,000 300,000 400,000 500,000 600,000 700,000 800,000 900,000 WN CNS-1 CNS-2 CNS-3 400,000 640,000 560,000 480,000 440,000 640,000 560,000 480,000 440,000 Before Earthquake After Earthquake (within 1 year) After Earthquake (after 12 months~ within 24 months) After Earthquake (after 24 months~ within 36 months) 800,000 480,000 320,000 280,000 Unit: Tourists Note: Estimated based on the tourism stats of Nepal Impact on GDP by Tourist Sector Note: Estimated based on the data of Ministry of culture, Tourism & Aviation 68 2,120 2,120 2,120 2,120 2,075 2,066 2,059 2,055 2,020 2,040 2,060 2,080 2,100 2,120 2,140 WN CNS-1 CNS-2 CNS-3 Before Earthquake After Earthquake2.15% decrease 2.53% decrease 2.88% decrease 3.09% decrease Unit: Billion NPR Remarks: This impact for GDP does not include the impact due to other industry except for tourism industry , therefore actual impact for GDP is estimated bigger than this estimation.
  • 18. → Conclusions 69 Damage Characteristics of Scenario Earthquakes Central Nepal south scenario earthquake will damage more than Gorkha earthquake. Large number of buildings in KV are highly vulnerable, including school, hospital and government buildings. Risk of building damage and human casualty will be increased in future if no measure is taken to strengthen building seismic performance. Although infrastructure and lifeline system had no significant damage in Gorkha earthquake, there will be more damages when strong earthquake happens. The new water supply network (under construction) significantly reduces the risk with respect to the existing one. The majority of the damage of rooftop BTS will be by the building damage. 70 Utilization of Risk Assessment Results in this Project The risk assessment results will be utilized for the municipal disaster risk reduction and management plan for the three pilot municipalities within this project and could be used for the same purpose for the whole KV. The risk assessment results provide basic information for determining the risk reduction target based on the time span and available budget, technology, etc. The results of human casualty provide the useful information on the stockpiling of water, food, emergency materials as well as securing the evacuation routes and spaces. 71 Recommendations Results of risk assessment depends largely on results of seismic hazard. Three ground motion levels of Central Nepal South (CNS) Scenario Earthquake were targeted for risk assessment due to the uncertainties in the estimation of future ground motion. Further research on Gorkha earthquake is necessary. Should be updated for new findings. Building inventory for whole KV is not existed and data for infrastructure and lifeline networks is not completely maintained. Development and its regular updating of GIS database of buildings, infrastructure and lifeline network is very important for the development of disaster risk reduction and management plan and routine maintenance works. 72
  • 19. Recommendations (cont.) Large number of buildings, including school, health facilities and government buildings, are estimated to suffer heavy damage for the scenario earthquakes. Strengthening of buildings is a big issue for both new and existing buildings. NBC, specially NBC 105, has to be revised. Enforce NBC for all new buildings Promotion of seismic strengthening of existing buildings, via. retrofitting or reconstruction through policy, legal means, budget arrangement, technology development as well as public awareness. For seismic risk reduction, risk assessment for whole Nepal is considered necessary. Has to be started immediately for other Metro city like Pokhara, Chitwan, etc. Based on the risk assessment results, the government organizations and utility companies could make their Business Continuity Plan (BCP). 73