IRJET - A Study on Behaviour of RCC Structures for Near and Far Field Earthquake with Different Soil Type
•
0 likes•10 views

The document presents the results of a study analyzing the seismic behavior of reinforced concrete (RC) structures located in different soil types and subjected to near-field and far-field earthquakes. 18 models of RC special moment resisting frames with G+8, G+10 and G+12 stories were analyzed using time-history analysis in ETABS. Story displacements, drifts, forces and accelerations were compared for structures in hard, medium and soft soils under near-field and far-field ground motions. In near-field shaking, soft soil led to higher displacements than other soils. In far-field shaking, medium soil produced higher displacements than hard or soft soils. Displacements generally decreased with stiffer soil

Recommended
More Related Content
What's hot
What's hot (20)
Similar to IRJET - A Study on Behaviour of RCC Structures for Near and Far Field Earthquake with Different Soil Type
Similar to IRJET - A Study on Behaviour of RCC Structures for Near and Far Field Earthquake with Different Soil Type (20)
More from IRJET Journal
More from IRJET Journal (20)
Recently uploaded
Recently uploaded (20)
IRJET - A Study on Behaviour of RCC Structures for Near and Far Field Earthquake with Different Soil Type
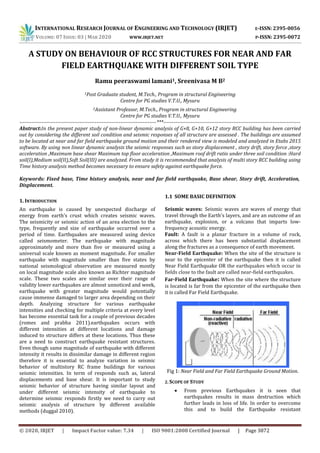
- 1. INTERNATIONAL RESEARCH JOURNAL OF ENGINEERING AND TECHNOLOGY (IRJET) E-ISSN: 2395-0056 VOLUME: 07 ISSUE: 03 | MAR 2020 WWW.IRJET.NET P-ISSN: 2395-0072 © 2020, IRJET | Impact Factor value: 7.34 | ISO 9001:2008 Certified Journal | Page 3872 A STUDY ON BEHAVIOUR OF RCC STRUCTURES FOR NEAR AND FAR FIELD EARTHQUAKE WITH DIFFERENT SOIL TYPE Ramu peeraswami lamani1, Sreenivasa M B2 1Post Graduate student, M.Tech., Program in structural Engineering Centre for PG studies V.T.U., Mysuru 2Assistant Professor, M.Tech., Program in structural Engineering Centre for PG studies V.T.U., Mysuru --------------------------------------------------------------------------------***-------------------------------------------------------------------------------- Abstract:In the present paper study of non-linear dynamic analysis of G+8, G+10, G+12 story RCC building has been carried out by considering the different soil condition and seismic responses of all structure are assessed . The buildings are assumed to be located at near and far field earthquake ground motion and their rendered view is modeled and analyzed in Etabs 2015 software. By using non linear dynamic analysis the seismic responses such as story displacement , story drift, story force ,story acceleration ,Maximum base shear Maximum top floor acceleration ,Maximum roof drift ratio under three soil condition :Hard soil(I),Medium soil(II),Soft Soil(III) are analyzed. From study it is recommended that analysis of multi story RCC building using Time history analysis method becomes necessary to ensure safety against earthquake force. Keywords: Fixed base, Time history analysis, near and far field earthquake, Base shear, Story drift, Acceleration, Displacement. 1. INTRODUCTION An earthquake is caused by unexpected discharge of energy from earth’s crust which creates seismic waves. The seismicity or seismic action of an area election to the type, frequently and size of earthquake occurred over a period of time. Earthquakes are measured using device called seismometer. The earthquake with magnitude approximately and more than five or measured using a universal scale known as moment magnitude. For smaller earthquake with magnitude smaller than five states by national seismological observation are measured mostly on local magnitude scale also known as Richter magnitude scale. These two scales are similar over their range of validity lower earthquakes are almost unnoticed and week, earthquake with greater magnitude would potentially cause immense damaged to larger area depending on their depth. Analyzing structure for various earthquake intensities and checking for multiple criteria at every level has become essential task for a couple of previous decades (romes and prabha 2011).earthquakes occurs with different intensities at different locations and damage induced to structure differs at these locations. Thus these are a need to construct earthquake resistant structures. Even though same magnitude of earthquake with different intensity it results in dissimilar damage in different region therefore it is essential to analyze variation in seismic behavior of multistory RC frame buildings for various seismic intensities. In term of responds such as, lateral displacements and base shear. It is important to study seismic behavior of structure having similar layout and under different seismic intensity of earthquake to determine seismic responds firstly we need to carry out seismic analysis of structure by different available methods (duggal 2010). 1.1 SOME BASIC DEFINITION Seismic waves: Seismic waves are waves of energy that travel through the Earth's layers, and are an outcome of an earthquake, explosion, or a volcano that imparts low- frequency acoustic energy. Fault: A fault is a planar fracture in a volume of rock, across which there has been substantial displacement along the fractures as a consequence of earth movement. Near-Field Earthquake: When the site of the structure is near to the epicenter of the earthquake then it is called Near Field Earthquake OR the earthquakes which occur in fields close to the fault are called near-field earthquakes. Far-Field Earthquake: When the site where the structure is located is far from the epicenter of the earthquake then it is called Far Field Earthquake. Fig 1: Near Field and Far Field Earthquake Ground Motion. 2. SCOPE OF STUDY From previous Earthquakes it is seen that earthquakes results in mass destruction which further leads in loss of life. In order to overcome this and to build the Earthquake resistant
- 2. INTERNATIONAL RESEARCH JOURNAL OF ENGINEERING AND TECHNOLOGY (IRJET) E-ISSN: 2395-0056 VOLUME: 07 ISSUE: 03 | MAR 2020 WWW.IRJET.NET P-ISSN: 2395-0072 © 2020, IRJET | Impact Factor value: 7.34 | ISO 9001:2008 Certified Journal | Page 3873 structures under near and far field earthquake technique can be used. Symmetrical structures impact in a similarly uniform distribution of seismic forces over its segments. The sites which are nearer to the fault line are highly affected than the sites which are located far from the fault line. So the behavior of structures under near field and far field ground motions are studied. 3. METHODOLOGY AND ANALYSIS A. Details of Plan The plan has 3x4 bays, length of each bay is considered 5m.Special RC moment-resisting frame (Frame) of G+8, G+10, G+12 story regular plan is to considered. The each storey height is 3m for all the buildings models considered for analysis using finite element method employing ETABS 2015 version commercial software and EI Centro earthquake as a function applied in the fixed base models after analysis of the models it can be concluded the results as follows; B. Parameters Considered for Analysis Type of structure: Special moment resisting frame (SMRF) Number of storys : G+8, G+10, G+12. Earthquake zone: V (as per IS1893- 2000) Floor to Floor height: 3m Bottom height: 1.5m Concrete grade: M30(Beam, Column), M20(Slab) Grade of steel: Fe 500 Column size: 300x600mm Beam size: 230x600mm Slab thickness: 150mm Live load: 3KN/m2 Floor finish: 1KN/ m2 Wall load: 14KN/m Parapet load: 4.6KN/m Zone factor(Z): 0.36 (as per IS1893- 2000 part-1) Importance factor: 1(as per IS1893- 2000 part-1 ) Response reduction factor(R): 5 (as per IS1893-2000 part-1 ) 18.Damping ratio: 5% Soil type= Hard soil(I),Medium soil(II), Soft soil(III). C. Model Description The plan and Elevation of models considered are as follows: Model 1- Hard soil (I) 3x4 bay G+8 storeys for near field earthquake model. Model 2- Hard soil (I) 3x4 bay G+8 storeys for Far field earthquake model. Model 3- Medium soil (II) 3x4 bay G+8 storeys for near field earthquake model. Model 4- Medium soil (II) 3x4 bay G+8 storeys for Far field earthquake model. Model 5- Soft soil (III) 3x4 bay G+8 storeys for near field earthquake model. Model 6- Soft soil (III) 3x4 bay G+8 storeys for far field earthquake model. Model 7- Hard soil (I) 3x4 bay G+10 storeys for near field earthquake model. Model 8- Hard soil (I) 3x4 bay G+10 storeys for Far field earthquake model. Model 9- Medium soil (II) 3x4 bay G+10 storeys for near field earthquake model. Model 10- Medium soil (II) 3x4 bay G+10 storeys for Far field earthquake model. Model 11- Soft soil (III) 3x4 bay G+10 storeys for near field earthquake model. Model 12- Soft soil (III) 3x4 bay G+10 storeys for far field earthquake model. Model 13- Hard soil (I) 3x4 bay G+12 storeys for near field earthquake model. Model 14- Hard soil (I) 3x4 bay G+12 storeys for Far field earthquake model. Model 15- Medium soil (II) 3x4 bay G+12 storeys for near field earthquake model. Model 16- Medium soil (II) 3x4 bay G+12 storeys for Far field earthquake model. Model 17- Soft soil (III) 3x4 bay G+12 storeys for near field earthquake model. Model 18- Soft soil (III) 3x4 bay G+12 storeys for far field earthquake model. D. ETABS MODELS Fig 2: Plan of view model
- 3. INTERNATIONAL RESEARCH JOURNAL OF ENGINEERING AND TECHNOLOGY (IRJET) E-ISSN: 2395-0056 VOLUME: 07 ISSUE: 03 | MAR 2020 WWW.IRJET.NET P-ISSN: 2395-0072 © 2020, IRJET | Impact Factor value: 7.34 | ISO 9001:2008 Certified Journal | Page 3874 Fig 3: G+8 3D view model Fig 4: G+10 3D view model Fig 5: G+12 3D view model 4. RESULTS AND DISCUSSION E. STORY DISPLACEMENTS Displacement is defined as the absolute displacement of the storey under the action of lateral forces. The maximum displacement values are tabulated for each floor of building with near and far field earthquake with different soil condition such as hard soil, medium soil, soft soil following time history analysis. NEAR FIELD X-DIRECTION: Fig 6: Shows the Story displacement for G+8 story with different soil condition for near field earthquake. Fig 7: Shows the Story displacement for G+10 story with different soil condition for near field earthquake. Fig 8: Shows the Story displacement for G+12 story with different soil condition for near field earthquake The above figures shows that the story displacement of fixed base calculated by time history analysis for various soil conditions, according to IS code. It is observed that the story displacement in near field x-direction has more displacement in soft soil and compared to the other soils such as hard and medium soil, which means that story displacement decreases there is increases in stiffness of soil.
- 4. INTERNATIONAL RESEARCH JOURNAL OF ENGINEERING AND TECHNOLOGY (IRJET) E-ISSN: 2395-0056 VOLUME: 07 ISSUE: 03 | MAR 2020 WWW.IRJET.NET P-ISSN: 2395-0072 © 2020, IRJET | Impact Factor value: 7.34 | ISO 9001:2008 Certified Journal | Page 3875 The maximum story displacement notices on top floor for G+ 8 structures is 17.042mm for soft soil and corresponding to medium soil and hard soil difference of 16.48% and 12.89% is obtained. The maximum story displacement notices on top floor for G+ 10 structures is 17.873mm for soft soil and corresponding to medium soil and hard soil difference of 0.09% and 0.0689% is obtained. The maximum story displacement notices on top floor for G+ 12 structures is 15.652mm for soft soil and corresponding to medium soil and hard soil difference of 6.6% and 3.04% is obtained. NEAR FIELD Y-DIRECTION: Fig 9: Shows the Story displacement for G+8 story with different soil condition for near field earthquake. Fig 10: Shows the Story displacement for G+10 story with different soil condition for near field earthquake. Fig 11: Shows the Story displacement for G+10 story with different soil condition for near field earthquake. The above graph shows that the story displacement of fixed base calculated by time history analysis for various soil conditions, according to IS code. It is observed that the story displacement in near field y-direction has more displacement in soft soil and compared to the other two soil such as hard and medium soil, which means that story displacement decreases whenever there is increases in stiff1ness soil and density is less and liquide limit more. The maximum story displacement notices on top floor for G+8 structure is 24.925 mm for soft soil and corresponding to medium soil and hard soil difference of 8.33% and 33.33% is obtained. The maximum story displacement notices on top floor for G+10 structure is 15.439 mm for soft soil and corresponding to medium soil and hard soil difference of 0.64% and 1.34% is obtained. The maximum story displacement notices on top floor for G+12 structure is 20.455 mm for soft soil and corresponding to medium soil and hard soil difference of 3.44% and 0.25% is obtained. FAR FIELD X-DIRECTION: Figure 12: Shows the Story displacement for G+8 structure with different soil condition for far field earthquake. Fig 13: Shows the Story displacement for G+10 story with different soil condition for far field earthquake. Fig 14: Shows the Story displacement for G+12 story with different soil condition for far field earthquake.
- 5. INTERNATIONAL RESEARCH JOURNAL OF ENGINEERING AND TECHNOLOGY (IRJET) E-ISSN: 2395-0056 VOLUME: 07 ISSUE: 03 | MAR 2020 WWW.IRJET.NET P-ISSN: 2395-0072 © 2020, IRJET | Impact Factor value: 7.34 | ISO 9001:2008 Certified Journal | Page 3876 The above graphs it has been observed that the story displacement for different soil. It is observed that the story displacement in far field x-direction has more displacement in medium soil and compared to the other two soil such as hard and soft soil, which means that story displacement decreases whenever there is increases in stiffness soil.which shows displacement is more in medium soil and more stiffness and less flexibility. The maximum story displacement notices on top floor for G+8 structure is 15.214mm for soft soil and corresponding to soft soil and hard soil difference of 52.2% and 6% is obtained. The maximum story displacement notices on top floor for G+10 structure is 12.222mm for soft soil and corresponding to soft soil and hard soil difference of 1.78% and 1.78% is obtained. The maximum story displacement notices on top floor for G+12 structure is 15.20mm for soft soil and corresponding to soft soil and hard soil difference of 3.34% and 0.03% is obtained. FAR FIELD Y-DIRECTION: Fig 15: Shows the Story displacement for G+8 story with different soil condition for far field earthquake. Fig 16: The Story displacement for G+10 story with different soil condition for far field earthquake. Fig 17: Shows the Story displacement for G+12 story with different soil condition for far field earthquake. The above table or figure shows that the story displacement of fixed base calculated by time history analysis for various soil conditions, according to IS code. It is observed that the story displacement in far field y- direction has more displacement in medium soil and compared to the other two soil such as hard and soft soil, which means that story displacement decreases whenever there is increases in stiffness soil. The maximum story displacement notices on top floor for G+8 structure is 32.3mm for soft soil and corresponding to soft soil and hard soil difference of 54% and 26.78% is obtained. The maximum story displacement notices on top floor for G+10 structure is 14.79mm for soft soil and corresponding to soft soil and hard soil difference of 0.14% and 0.14% is obtained. The maximum story displacement notices on top floor for G+12 structure is 15.803mm for soft soil and corresponding to soft soil and hard soil difference of 0.202% and 0.202% is obtained. 4.2 STORY DRIFT Story drift is the drift of one level of a multistory building relative to the level below. Interstory drift is the differences between the roof and floor displacements of any given story as the building sways during the earthquake, normalized by the story height. the maximum story drift values are tabulated for each floors of building with near and far field earthquake with different soil condition such as hard soil, medium soil, soft soil following time history analysis.
- 6. INTERNATIONAL RESEARCH JOURNAL OF ENGINEERING AND TECHNOLOGY (IRJET) E-ISSN: 2395-0056 VOLUME: 07 ISSUE: 03 | MAR 2020 WWW.IRJET.NET P-ISSN: 2395-0072 © 2020, IRJET | Impact Factor value: 7.34 | ISO 9001:2008 Certified Journal | Page 3877 NEAR FIELD X-DIRECTION: Fig 18: Shows the Story drifts for G+8 story with different soil condition for far field earthquake. Fig 19; Shows the Story drifts for G+10 structure with different soil condition for far field earthquake. Fig 20: Shows the Story drifts for G+12 story with different soil condition for near field earthquake. From above graphs shows that the story drifts of fixed base calculated by time history analysis for various soil conditions, according to IS code. Table or graph shows the values of story drift for particular floor levels for the building models (G+8 G+10 G+12), these values are plotted graphically with story drift in near field x-direction, the graph shows the variation of story drift verses the number of storys. The figure indicates the comparison of story drift for near field x-direction it has more story drift in soft soil and compared to other soils. The maximum story drifts notices in story 3 for G+8 structure is 0.000956 mm for soft soil and corresponding to medium soil and hard soil difference of 14.85% and 31.17% is obtained. The maximum story drifts notices in story 3 for G+10 structure is 0.000712 mm for soft soil and corresponding to medium soil and hard soil difference of 0.42% and 1.26% is obtained. The maximum story drifts notices in story 3 for G+12 structure is 0.000568 mm for soft soil and corresponding to medium soil and hard soil difference of 1.76% and 1.23% is obtained. NEAR FIELD Y-DIRECTION: Fig 21: Shows the Story drifts for G+8 structure with different soil condition for near field earthquake. Fig 22: Shows the Story drifts for G+10 story with different soil condition for near field earthquake. Fig 23: Shows the Story drifts for G+12 story with different soil condition for near field earthquake. The above graph shows that the story drifts of fixed base calculated by time history analysis for various soil conditions, according to IS code. Table or graph shows the values of story drift for particular floor levels for the building models (G+8 G+10 G+12), these values are plotted graphically with story drift in near field y-direction, the graph shows the variation of story drift verses the number of storys. The figure indicates the comparison of story drift for near field y-direction it has more story drift in soft soil and compared to other soils, the maximum story drift each model in story 3. The maximum story drifts notices in story 3 for G+8 structure is 0.001437 mm for soft soil and corresponding
- 7. INTERNATIONAL RESEARCH JOURNAL OF ENGINEERING AND TECHNOLOGY (IRJET) E-ISSN: 2395-0056 VOLUME: 07 ISSUE: 03 | MAR 2020 WWW.IRJET.NET P-ISSN: 2395-0072 © 2020, IRJET | Impact Factor value: 7.34 | ISO 9001:2008 Certified Journal | Page 3878 to medium soil and hard soil difference of 1.39% and 10.29% is obtained. The maximum story drifts notices in story 3 for G+10 structure is 0.000565 mm for soft soil and corresponding to medium soil and hard soil difference of 1.06% and 1.06% is obtained. The maximum story drifts notice in story 5 for G+12 structure is 0.000792 mm for soft soil and corresponding to medium soil and hard soil difference of 1.26% and 0.50% is obtained. FAR FIELD X-DIRECTION; Fig 24: Shows the Story drifts for G+8 structure with different soil condition for far field earthquake. Fig 25: Shows the Story drifts for G+10 story with different soil condition for far field earthquake. . Fig 25 :Shows the Story drifts for G+12 story with different soil condition for far field earthquake The above figure shows that the story drifts of fixed base calculated by time history analysis for various soil conditions, according to IS code. Table or graph shows the values of story drift for particular floor levels for the building models (G+8 G+10 G+12), these values are plotted graphically with story drift in far field x-direction, the graph shows the variation of story drift verses the number of storys. The figure indicates the comparison of story drift for far field x-direction it has more story drift in soft soil and compared to other soils. The maximum story drifts notices story 3 for G+8 structure is 0.000928mm for soft soil and corresponding to medium soil and hard soil difference of 34.80% and 21.55% is obtained. The maximum story drifts notices story 3 for G+10 structure is 0.000568mm for soft soil and corresponding to medium soil and hard soil difference of 3.16% and 3.52% is obtained. The maximum story drifts notices story 8 for G+8 structure is 0.000501mm for soft soil and corresponding to medium soil and hard soil difference of 0.39% and 0.62% is obtained. FAR FIELD Y-DIRECTION: Fig 27: Shows the Story drifts for G+8 story with different soil condition for far field earthquake. Fig 28: Shows the Story drifts for G+10 story with different soil condition for far field earthquake Fig 29: Shows the Story drifts for G+12 story with different soil condition for far field earthquake.
- 8. INTERNATIONAL RESEARCH JOURNAL OF ENGINEERING AND TECHNOLOGY (IRJET) E-ISSN: 2395-0056 VOLUME: 07 ISSUE: 03 | MAR 2020 WWW.IRJET.NET P-ISSN: 2395-0072 © 2020, IRJET | Impact Factor value: 7.34 | ISO 9001:2008 Certified Journal | Page 3879 The above graphs shows that the story drifts of fixed base calculated by time history analysis for various soil conditions, according to IS code. Table or graph shows the values of story drift for particular floor levels for the building models (G+8 G+10 G+12), these values are plotted graphically with story drift in far field y-direction, the graph shows the variation of story drift verses the number of storys. The figure indicates the comparison of story drift for far field y-direction it has more story drift in soft soil and compared to other soils. The maximum story drift notices in story 5 for G+8 structure is 0.001597 mm for soft soil and corresponding to medium soil and hard soil difference of 37.1% and 61.2% is obtained. The maximum story drifts notices in story 4 for G+10 structure is 0.000612 mm for soft soil and corresponding to medium soil and hard soil difference of 1.01% and 1.01% is obtained. The maximum story drifts notices in story 5 for G+12 structure is 0.000583 mm for soft soil and corresponding to medium soil and hard soil difference of 0.17% and 0.17% is obtained. STORY ACCELERATIONS A method to estimate floor acceleration demands in multi- story buildings subjected to earthquake is presented. A parametric study to evaluate the effects of these three parameters on seismic acceleration demands of buildings including peak floor acceleration and floor response spectra is also presented. The story acceleration values are tabulated for each floors of building with near and far field earthquake with different soil condition such as hard soil, medium soil, soft soil following time history analysis. NEAR FIELD X-DIRECTION: Fig 30: Shows the Story acceleration for G+8 story with different soil condition for near field earthquake. Fig 31: Shows the Story acceleration for G+10 story with different soil condition for near field earthquake. Fig 32: Shows the Story acceleration for G+12 structure with different soil condition for near field earthquake. The above figure it has been shows that the story accelerations of fixed base calculated by time history analysis for various soil conditions, according to IS code. It is observed that the story accelerations in near field x- direction has more accelerations in soft soil and compared to the other two soil such as hard and medium soil, which means that story accelerations decreases whenever there is increases in stiffness soil. The maximum story accelerations notices on top floor for G+8 structure is 850.66mm/sec2 for soft soil and corresponding to medium soil and hard soil difference of 40.5% and 50.5% is obtained. The maximum story accelerations notices on top floor for G+10 structure is 576.94mm/sec2 for soft soil and corresponding to medium soil and hard soil difference of 0.17% and 1.17% is obtained. The maximum story accelerations notices on top floor for G+12 structure is 469.73mm/sec2 for soft soil and corresponding to medium soil and hard soil difference of 1.82% and 2.03% is obtained.
- 9. INTERNATIONAL RESEARCH JOURNAL OF ENGINEERING AND TECHNOLOGY (IRJET) E-ISSN: 2395-0056 VOLUME: 07 ISSUE: 03 | MAR 2020 WWW.IRJET.NET P-ISSN: 2395-0072 © 2020, IRJET | Impact Factor value: 7.34 | ISO 9001:2008 Certified Journal | Page 3880 NEAR FIELD Y-DIRECTION: Fig 33: Shows the Story acceleration for G+8 structure with different soil condition for near field earthquake. Fig 34: Shows the Story acceleration for G+10 story with different soil condition for near field earthquake. Fig 35: Shows the Story acceleration for G+12 story with different soil condition for near field earthquake. The story accelerations of fixed base calculated by time history analysis for various soil conditions, according to IS code. It is observed that the story accelerations in near field y-direction has more accelerations in soft soil and compared to the other two soil such as hard and medium soil.Soft soil is a density low and liquied limit is more and strength will be less and near field ground motion are the high amplitude and high velocity and large frequencies. The maximum story accelerations notices on top floor for G+8 structure is 493.42mm/sec2 for soft soil and corresponding to medium soil and hard soil difference of 20.5% and 18.45% is obtained. The maximum story accelerations notices on top floor for G+10 structure is 494.42mm/sec2 for soft soil and corresponding to medium soil and hard soil difference of 0.40% and 0.40% is obtained. The maximum story accelerations notices on top floor for G+12 structure is 413.27mm/sec2 for soft soil and corresponding to medium soil and hard soil difference of 1.93 % and 3.63% is obtained. FAR FIELD X-DIRECTION: Fig 36: Shows the Story acceleration for G+8 story with different soil condition for far field earthquake. Fig 37: Shows the Story acceleration for G+10 structure with different soil condition for far field earthquake. Fig 38: Shows the Story acceleration for G+12 story with different soil condition for far field earthquake. The above graphs shows that the story accelerations of fixed base calculated by time history analysis for various soil conditions, according to IS code. It is observed that the story accelerations in far field x-direction has more accelerations in hard soil and compared to the other two soil such as soft and medium soil, the hard soil are the density more and liquid limit will be less and strength will be high. Far field ground motion are the small amplitude, velocity and frequencies.
- 10. INTERNATIONAL RESEARCH JOURNAL OF ENGINEERING AND TECHNOLOGY (IRJET) E-ISSN: 2395-0056 VOLUME: 07 ISSUE: 03 | MAR 2020 WWW.IRJET.NET P-ISSN: 2395-0072 © 2020, IRJET | Impact Factor value: 7.34 | ISO 9001:2008 Certified Journal | Page 3881 The maximum story accelerations notices on top floor for G+8 structure is 372.54mm/sec2 for hard soil and corresponding to medium soil and soft soil difference of 7.79% and 20.16% is obtained. The maximum story accelerations notices on top floor for G+10 structure is 447.46mm/sec2 for hard soil and corresponding to medium soil and soft soil difference of 0.89% and 0.22% is obtained. The maximum story accelerations notices on top floor for G+12 structure is 356.86mm/sec2 for hard soil and corresponding to medium soil and soft soil difference of 0.56% and 0.19% is obtained. FAR FIELD Y-DIRECTION: Fig 39: Shows the Story acceleration for G+8 structure with different soil condition for far field earthquake. Fig 40: Shows the Story acceleration for G+10 story with different soil condition for far field earthquake. Fig 41: Shows the Story acceleration for G+12 story with different soil condition for far field earthquake. The above table or figure shows that the story accelerations of fixed base calculated by time history analysis for various soil conditions, according to IS code. It is observed that the story accelerations in far field y- direction has more accelerations in hard soil and compared to the other two soil such as soft and medium soil, which means that story accelerations decreases whenever there is increases in stiffness soil. The maximum story accelerations notices on top floor for G+8 structure is 357.11mm/sec2 for hard soil and corresponding to medium soil and soft soil difference of 23.8% and 10.64% is obtained. The maximum story accelerations notices on top floor for G+8 structure is 409.61mm/sec2 for hard soil and corresponding to medium soil and soft soil difference of 0.24% and 0.24% is obtained. The maximum story accelerations notices on top floor for G+8 structure is 397.11mm/sec2 for hard soil and corresponding to medium soil and soft soil difference of 2.51% and 0.5% is obtained. STORY FORCES Story force is the sum of designed lateral forces at all levels above the story under consideration. Story shear value as per IS code, is calculated and plotted for buildings with different heights and resting on different soil types. Representative variations in the pattern of distribution of lateral shear force in a G+8,G+10,G+12 story building corresponding to the seismic provisions of IS code. the maximum story forces values are tabulated for each floors of building with near and far field earthquake with different soil condition such as hard soil, medium soil, soft soil following time history analysis. NEAR FIELD EARTHQUAKE: Fig 42: Shows the Story forces for G+8 story with different soil condition for near field earthquake.
- 11. INTERNATIONAL RESEARCH JOURNAL OF ENGINEERING AND TECHNOLOGY (IRJET) E-ISSN: 2395-0056 VOLUME: 07 ISSUE: 03 | MAR 2020 WWW.IRJET.NET P-ISSN: 2395-0072 © 2020, IRJET | Impact Factor value: 7.34 | ISO 9001:2008 Certified Journal | Page 3882 Fig 43: Shows the Story forces for G+10 story with different soil condition for near field earthquake. Fig 44: Shows the Story forces for G+12 story with different soil condition for near field earthquake The above graph it has been observed that the values of story forces for particular floor levels for the framed structure these values are plotted graphically with story force near field x-direction.the figure shows the variation of story force verses number of storys. The figure indicates comparison of story force in near field x-direction it has more story force in soft soil and compared to other soils. The soft soil are the density of soil is less and liquid limit is more and strength are more. The maximum story forces notices in story 1 for G+ 8 structures is 73092.32 KN for soft soil and corresponding to medium soil and hard soil difference of 1.06% and 1.06% is obtained. The maximum story forces notices in story 1 for G+ 8 structures is 88103.733 KN for soft soil and corresponding to medium soil and hard soil difference of 1.02% and 1.02% is obtained. The maximum story forces notices in story 1 for G+ 8 structures is 103951.1185 KN for soft soil and corresponding to medium soil and hard soil difference of 0.2% and 0.2% is obtained. FAR FIELD EARTHQUAKE: Fig 45: Shows the Story forces for G+8 story with different soil condition for far field earthquake. Fig 46: Shows the Story forces for G+10 story with different soil condition for far field earthquake. Fig 47: Shows the Story forces for G+12 story with different soil condition for far field earthquake. The values of story forces for particular floor levels for the framed structure these values are plotted graphically with story force far field x-direction.the figure shows the variation of story force verses number of storys.The figure indicates comparison of story force in far field x-direction it has more story force in soft soil and compared to other soils because the soft soil less strength and less density and more liquid limit and small amplitude and small frequencies. The maximum story forces notices in story 1 for G+8 structure is 72392.32KN for soft soil and corresponding to medium soil and hard soil difference of 0.96% and 0.11% is obtained.
- 12. INTERNATIONAL RESEARCH JOURNAL OF ENGINEERING AND TECHNOLOGY (IRJET) E-ISSN: 2395-0056 VOLUME: 07 ISSUE: 03 | MAR 2020 WWW.IRJET.NET P-ISSN: 2395-0072 © 2020, IRJET | Impact Factor value: 7.34 | ISO 9001:2008 Certified Journal | Page 3883 The maximum story forces notices in story 1 for G+8 structure is 88100.33KN for soft soil and corresponding to medium soil and hard soil difference of 0.6% and 0.6% is obtained. The maximum story forces notices in story 1 for G+8 structure is 103951.11KN for soft soil and corresponding to medium soil and hard soil difference of 0.1% and 0.1% is obtained. 4.5 MAXIMUM BASE SHEAR Base shear is an estimate of the maximum expected lateral force which will occur due to the ground motion at the base of the structure. The maximum Base reaction values are tabulated for each floors of building with near and far field earthquake with different soil condition such as hard soil, medium soil, soft soil following time history analysis. Fig 48: Shows the maximum base shear for story with different soil condition for near field earthquake. Fig 49: Shows the Maximum base shear for story with different soil condition for far field earthquake. The selecting DCON2 shows that the maximum base shear of fixed base calculated by time history analysis for various soil conditions, according to IS code. It is observed that the story forces in near and far field ground motion has more maximum base shear in soft soil and compared to the other two soil such as hard and medium soil, which means that maximum base shear decreases whenever there is increases in stiffness soil.There is know much difference because the soft soil is more amplitude and frequencies and more velocitys and density is less and strength is less. 4.6 MAXIMUM ROOF DRIFT RATIO The maximum roof story inelastic drift ratio (RDR) is calculated by dividing the top story in elastic deflection by building height. NEAR FIELD X-DIRECTION: TABLE I. SHOWS THE MAXIMUM ROOF DRIFT RATIO FOR G+8 STORY WITH DIFFERENT SOIL CONDITION FOR NEAR FIELD EARTHQUAKE X-DIRECTION. G+8 STORY NEAR FIELD X-DIRECTION IN mm SOIL I SOIL II SOIL III ROOF 0.000245 0.000219 0.000299 TABLE II. SHOWS THE MAXIMUM ROOF DRIFT RATIO FOR G+10 STORY WITH DIFFERENT SOIL CONDITION FOR NEAR FIELD EARTHQUAKE. G+10 STORY NEAR FIELD X-DIRECTION IN mm SOIL I SOIL II SOIL III ROOF 0.000208 0.000203 0.000209 TABLE III. SHOWS THE MAXIMUM ROOF DRIFT RATIO FOR G+12 STORY WITH DIFFERENT SOIL CONDITION FOR NEAR FIELD EARTHQUAKE. G+12 STORY NEAR FIELD X-DIRECTION IN mm SOIL I SOIL II SOIL III ROOF 0.000200 0.000202 0.000206 The above table shows that the maximum roof drift ratio of fixed base calculated by time history analysis for various soil conditions, according to IS code. It is observed that the maximum roof drift ratio in near field x-direction has more maximum roof drift ratio in soft soil and compared to the other two soil such as hard and medium soil, which means that the maximum roof drift ratio decreases whenever there is increases in stiffness soil. NEAR FIELD Y-DIRECTION: TABLE IV. SHOWS THE MAXIMUM ROOF DRIFT RATIO FOR G+8 STORY WITH DIFFERENT SOIL CONDITION FOR NEAR FIELD EARTHQUAKE Y-DIRECTION. G+8 STORY NEAR FIELD X-DIRECTION IN mm SOIL I SOIL II SOIL III ROOF 0.000225 0.000323 0.000325 TABLE V. SHOWS THE MAXIMUM ROOF DRIFT RATIO FOR G+10 STORY WITH DIFFERENT SOIL CONDITION FOR NEAR FIELD EARTHQUAKE. G+10 STORY NEAR FIELD X-DIRECTION IN mm SOIL I SOIL II SOIL III ROOF 0.000188 0.000189 0.000199
- 13. INTERNATIONAL RESEARCH JOURNAL OF ENGINEERING AND TECHNOLOGY (IRJET) E-ISSN: 2395-0056 VOLUME: 07 ISSUE: 03 | MAR 2020 WWW.IRJET.NET P-ISSN: 2395-0072 © 2020, IRJET | Impact Factor value: 7.34 | ISO 9001:2008 Certified Journal | Page 3884 TABLE VI. SHOWS THE MAXIMUM ROOF DRIFT RATIO FOR G+12 STORY WITH DIFFERENT SOIL CONDITION FOR NEAR FIELD EARTHQUAKE. G+12 STORY NEAR FIELD X-DIRECTION IN mm SOIL I SOIL II SOIL III ROOF 0.000167 0.000173 0.000173 The above table shows that the maximum roof drift ratio of fixed base calculated by time history analysis for various soil conditions, according to IS code. It is observed that the maximum roof drift ratio in near field y-direction has more maximum roof drift ratio in soft soil and compared to the other two soil such as hard and medium soil, which means that the maximum roof drift ratio decreases whenever there is increases in stiffness soil. FAR FIELD X-DIRECTION: TABLE VII. SHOWS THE MAXIMUM ROOF DRIFT RATIO FOR G+8 STORY WITH DIFFERENT SOIL CONDITION FOR FAR FIELD EARTHQUAKE X-DIRECTION. G+8 STORY NEAR FIELD X-DIRECTION IN mm SOIL I SOIL II SOIL III ROOF 0.000167 0.000173 0.000173 TABLE VIII. SHOWS THE MAXIMUM ROOF DRIFT RATIO FOR G+10 STORY WITH DIFFERENT SOIL CONDITION FOR FAR FIELD EARTHQUAKE. G+10 STORY NEAR FIELD X-DIRECTION IN mm SOIL I SOIL II SOIL III ROOF 0.000167 0.000173 0.000173 TABLE IX. SHOWS THE MAXIMUM ROOF DRIFT RATIO FOR G+12 STORY WITH DIFFERENT SOIL CONDITION FOR FAR FIELD EARTHQUAKE. G+12 STORY NEAR FIELD X-DIRECTION IN mm SOIL I SOIL II SOIL III ROOF 0.000167 0.000173 0.000173 The above table shows that the maximum roof drift ratio of fixed base calculated by time history analysis for various soil conditions, according to IS code. It is observed that the maximum roof drift ratio in far field x-direction has more maximum roof drift ratio in medium soil and compared to the other two soil such as hard and soft soil, which means that the maximum roof drift ratio decreases whenever there is increases in stiffness soil. FAR FIELD Y-DIRECTION: TABLE X. SHOWS THE MAXIMUM ROOF DRIFT RATIO FOR G+8 STORY WITH DIFFERENT SOIL CONDITION FOR FAR FIELD EARTHQUAKE Y-DIRECTION. G+8 STORY NEAR FIELD X-DIRECTION IN mm SOIL I SOIL II SOIL III ROOF 0.000185 0.000566 0.000373 TABLE XI. SHOWS THE MAXIMUM ROOF DRIFT RATIO FOR G+10 STORY WITH DIFFERENT SOIL CONDITION FOR FAR FIELD EARTHQUAKE. G+10 STORY NEAR FIELD X-DIRECTION IN mm SOIL I SOIL II SOIL III ROOF 0.000181 0.000185 0.000181 TABLE XII. SHOWS THE MAXIMUM ROOF DRIFT RATIO FOR G+12 STORY WITH DIFFERENT SOIL CONDITION FOR FAR FIELD EARTHQUAKE. G+12 STORY NEAR FIELD X-DIRECTION IN mm SOIL I SOIL II SOIL III ROOF 0.000176 0.000177 0.000175 The above table shows that the maximum roof drift ratio of fixed base calculated by time history analysis for various soil conditions, according to IS code. It is observed that the maximum roof drift ratio in far field y-direction has more maximum roof drift ratio in medium soil and compared to the other two soil such as hard and soft soil, which means that the maximum roof drift ratio decreases whenever there is increases in stiffness soil. MAXIMUM TOP FLOOR ACCELERATION NEAR FIELD X-DIRECTION: TABLE XIII. SHOWS THE MAXIMUM TOP FLOOR ACCELERATION FOR G+8 STORY WITH DIFFERENT SOIL CONDITION FOR NEAR FIELD EARTHQUAKE X-DIRECTION. G+8 STORY NEAR FIELD X-DIRECTION IN mm/sec2 SOIL I SOIL II SOIL III ROOF 420.16 0.000566 0.000373 TABLE XIV. SHOWS THE MAXIMUM TOP FLOOR ACCELERATION FOR G+10 STORY WITH DIFFERENT SOIL CONDITION FOR NEAR FIELD EARTHQUAKE. G+10 STORY NEAR FIELD X-DIRECTION IN mm/sec2 SOIL I SOIL II SOIL III ROOF 575.34 570.68 576.94 TABLE XV. SHOWS THE MAXIMUM TOP FLOOR ACCELERATION FOR G+12 STORY WITH DIFFERENT SOIL CONDITION FOR NEAR FIELD EARTHQUAKE. G+12 STORY NEAR FIELD X-DIRECTION IN mm/sec2 SOIL I SOIL II SOIL III ROOF 463.85 467.12 469.73 The above table shows that the maximum top floor accelerations of fixed base calculated by time history analysis for various soil conditions, according to IS code. It is observed that the maximum top floor accelerations in near field x-direction has more maximum top floor accelerations in soft soil and compared to the other two soil such as hard and medium soil, which means that the
- 14. INTERNATIONAL RESEARCH JOURNAL OF ENGINEERING AND TECHNOLOGY (IRJET) E-ISSN: 2395-0056 VOLUME: 07 ISSUE: 03 | MAR 2020 WWW.IRJET.NET P-ISSN: 2395-0072 © 2020, IRJET | Impact Factor value: 7.34 | ISO 9001:2008 Certified Journal | Page 3885 maximum top floor accelerations decreases whenever there is increases in stiffness soil. NEAR FIELD Y-DIRECTION: TABLE XVI. SHOWS THE MAXIMUM TOP FLOOR ACCELERATION FOR G+8 STORY WITH DIFFERENT SOIL CONDITION FOR NEAR FIELD EARTHQUAKE. G+8 STORY NEAR FIELD X-DIRECTION IN mm/sec2 SOIL I SOIL II SOIL III ROOF 420.16 0.000566 0.000373 TABLE XVII. SHOWS THE MAXIMUM TOP FLOOR ACCELERATION FOR G+10 STORY WITH DIFFERENT SOIL CONDITION FOR NEAR FIELD EARTHQUAKE. G+10 STORY NEAR FIELD X-DIRECTION IN mm/sec2 SOIL I SOIL II SOIL III ROOF 420.16 0.000566 0.000373 TABLE XVIII. SHOWS THE MAXIMUM TOP FLOOR ACCELERATION FOR G+12 STORY WITH DIFFERENT SOIL CONDITION FOR NEAR FIELD EARTHQUAKE. G+12 STORY NEAR FIELD X-DIRECTION IN mm/sec2 SOIL I SOIL II SOIL III ROOF 420.16 0.000566 0.000373 The above table shows that the maximum top floor accelerations of fixed base calculated by time history analysis for various soil conditions, according to IS code. It is observed that the maximum top floor accelerations in near field y-direction has more maximum top floor accelerations in soft soil and compared to the other two soil such as hard and medium soil, which means that the maximum top floor accelerations decreases whenever there is increases in stiffness soil. FAR FIELD X-DIRECTION: TABLE XIX. SHOWS THE MAXIMUM TOP FLOOR ACCELERATION FOR G+8 STORY WITH DIFFERENT SOIL CONDITION FOR FAR FIELD EARTHQUAKE X-DIRECTION. G+8 STORY NEAR FIELD X-DIRECTION IN mm/sec2 SOIL I SOIL II SOIL III ROOF 372.54 343.64 297.5 TABLE XX. SHOWS THE MAXIMUM TOP FLOOR ACCELERATION FOR G+10 STORY WITH DIFFERENT SOIL CONDITION FOR FAR FIELD EARTHQUAKE X-DIRECTION. G+10 STORY NEAR FIELD X-DIRECTION IN mm/sec2 SOIL I SOIL II SOIL III ROOF 447.46 443.79 446.46 TABLE XXI. SHOWS THE MAXIMUM TOP FLOOR ACCELERATION FOR G+12 STORY WITH DIFFERENT SOIL CONDITION FOR FAR FIELD EARTHQUAKE X-DIRECTION. G+12 STORY NEAR FIELD X-DIRECTION IN mm/sec2 SOIL I SOIL II SOIL III ROOF 356.86 354.71 356.71 The maximum top floor accelerations of fixed base calculated by time history analysis for various soil conditions, according to IS code. It is observed that the maximum top floor accelerations in far field x-direction has more maximum top floor accelerations in hard soil and compared to the other two soil such as soft and medium soil, which means that the maximum top floor accelerations decreases whenever there is increases in stiffness soil. FAR FIELD Y-DIRECTION: TABLE XXII. SHOWS THE MAXIMUM TOP FLOOR ACCELERATION FOR G+8 STORY WITH DIFFERENT SOIL CONDITION FOR FAR FIELD EARTHQUAKE. G+8 STORY NEAR FIELD X-DIRECTION IN mm/sec2 SOIL I SOIL II SOIL III ROOF 357.11 272.67 319.6 TABLE XXIII. SHOWS THE MAXIMUM TOP FLOOR ACCELERATION FOR G+10 STORY WITH DIFFERENT SOIL CONDITION FOR FAR FIELD EARTHQUAKE. G+10 STORY NEAR FIELD X-DIRECTION IN mm/sec2 SOIL I SOIL II SOIL III ROOF 406.61 408.62 408.61 TABLE XXIV. SHOWS THE MAXIMUM TOP FLOOR ACCELERATION FOR G+12 STORY WITH DIFFERENT SOIL CONDITION FOR FAR FIELD EARTHQUAKE. G+12 STORY NEAR FIELD X-DIRECTION IN mm/sec2 SOIL I SOIL II SOIL III ROOF 397.11 387.11 395.71 The above table shows that the maximum top floor accelerations of fixed base calculated by time hist0ry analysis f0r vari0us soil conditions, acc0rding to IS c0de. It is 0bserved that the maximum top floor accelerations in far field y-direction has more maximum top floor accelerations in hard soil and compared to the other two soil such as medium and soft soil, which means that the maximum top floor accelerations decreases whenever there is increases in stiffness soil. CONCLUSIONS; A tall building of G+8,G+10,G+12 story with a fixed base have been analyzed for a hard soil, medium soil, soft soil conditions. The purpose of the study was to investigate the seismic performance of an under near and far field earthquake fixed base building under various soil conditions according to IS code. The responses of the buildings story displacement, story drift, story force, story acceleration and also maximum inter story drift ratio, maximum top floor acceleration, maximum base shear, maximum roof drift ratio have been studied. The time history analysis carried out by Etabs software & EI Centro earthquake as a function applied in the fixed base models after analysis of the models it can be concluded the results as follows: It is observed that the story displacement increases with the increased stiffness of soil,in the other words the soft soil conditions produced the largest displacement compared with hard and medium soil under near field-x and near field-y
- 15. INTERNATIONAL RESEARCH JOURNAL OF ENGINEERING AND TECHNOLOGY (IRJET) E-ISSN: 2395-0056 VOLUME: 07 ISSUE: 03 | MAR 2020 WWW.IRJET.NET P-ISSN: 2395-0072 © 2020, IRJET | Impact Factor value: 7.34 | ISO 9001:2008 Certified Journal | Page 3886 earthquake direction for all models(G+8 G+10 G+12),It is also observed that the displacement produced due to time history analysis. It has to be observed that the story displacement increases with the increased stiffness of soil,in the other words the medium soil conditions produced the largest displacement compared with hard and soft soil under far field-x and far field-y earthquake direction for all models(G+8 G+10 G+12),It is also observed that the displacement produced due to time history analysis. The maximum interstory drift ratio is produced in the all models in story 3 above the fixed base RC frame structures for various soil conditions which attributes to the flexibility introduced by fixed base model.It is also observed that the maximum interstory drift ratio increases with increases in flexibility of soil under near field-x and near field-y earthquake direction and thus largest drifts created in soft soil comparing hard and medium soil. The maximum interstory drift ratio is produced in the all models in in story 3 above the fixed base RC frame structures for various soil conditions which attributes to the flexibility introduced by fixed base model.It is also observed that the maximum interstory drift ratio increases with increases in flexibility of soil under far field-x and far field-y earthquake direction and thus largest drifts created in soft soil comparing hard and medium soil. It is observed that the story acceleration increases with the increased stiffness of soil,in the other words the soft soil conditions are produced the largest acceleration compared with hard and medium soil under near field-x and near field-y earthquake direction for all models(G+8 G+10 G+12),It is also observed that the acceleration produced due to time history analysis. It is observed that the story acceleration increases with the increased stiffness of soil,in the other words the soft soil conditions are produced the largest acceleration compared with hard and medium soil under far field-x and far field-y earthquake direction for all models(G+8 G+10 G+12),It is also observed that the acceleration produced due to time history analysis. The story forces increases with the increased stiffness of soil,in the other words the soft soil conditions are produced the largest story forces compared with hard and medium soil under near field and far field earthquake ground motion for all models(G+8 G+10 G+12),It is also observed that the story forces to produced due to time history analysis. The maximum base shear obtained in soft soil it has to be compared other two soils such as hard and medium soil under near and far field ground motion for all models(G+8 G+10 G+12) Further also observed that the base shear to produced due to time history analysis. The maximum roof drift ratio it has carries in soft soil and compared the hard and medium soil under near field x and far field y direction for all models such as G+8 G+10 G+12 storys.Same as the far field x and far field y direction produced maximum roof drift ratio in medium soil and compared to other soils to carriey out the time history analysis. The maximum top floor acceleration it has to observed in soft soil and compared the other two soils under near x and near field y direction for all models.Same think as obtained maximum top floor acceleration in hard soil and compared to other soils. Acknowledgment The author would like to thank Mr.Sreenivasa M B.Assistant professor ,M.Tech.,Programme in Structural Engineering,Center for Post Graduate Studies,V.T.U.Mysuru and Dr,Keerthigowda B S Programme Coordinator ,M.Tech,Program in Structural Engineering Center for Graduate Studies,V.T.U.Mysuru and anonymous reviewer’s encouragement and constructive piece of advice that have prompted us for new round of thinking of out research,additional experiments and clear presentation of technical content. REFERENCES [1] Alam,M.S, M. R. Bhuiyan, and A. M. Billah. (2012) “Seismic fragility assessment of SMA bar restrained multi- span continuous highway bridge isolated by different laminated rubber bearings in medium to strong seismic risk zones.” Bull. Earthquake Eng.10(6):18851909. [2] Alhan, C, and S. Oncu-Davas.(2016) “Performance limits of seismically isolated buildings under near-field earthquakes.” Eng. Strut. 116 [3] Bhandari, M, S. Bharti, M. Shrimali,and T. Datta.( 2018) “Assessment of proposed lateral load patterns in pushover analysis for base-isolated frames.” Eng. Struct. 175 (Nov): 531–548. [4] Banazadeh, M, M. Gholhaki, and H. Parvini Sani.( 2017) “Cost-benefit analysis of seismic-isolated structures with viscous damper based on loss estimation.” Struct. Infrastruct. Eng. 13 (8): 1045–1055. [5] Celik, O , C, and B. R. Ellingwood.( 2009) “Seismic risk assessment of gravity load designed reinforced concrete frames subjected to mid- America ground motions.” J. Struct. Eng. 135 (4): 414–424. [6] Dhir, P. K, R. Davis, and P. Sarkar.( 2018) “Safety assessment of gravity load-designed reinforced concrete- framed buildings.” ASCE-ASME J.Risk Uncertainty Eng. Syst. Part A Civ. Eng. 4 (2): 04018004. [7] Han, R, Y. Li, and J. van de Lindt. (2014) “Seismic risk of base isolated non-ductile reinforced concrete buildings considering uncertainties and mainshock-aftershock sequences.” Struct. Saf. 50 (Sep):39–56.
- 16. INTERNATIONAL RESEARCH JOURNAL OF ENGINEERING AND TECHNOLOGY (IRJET) E-ISSN: 2395-0056 VOLUME: 07 ISSUE: 03 | MAR 2020 WWW.IRJET.NET P-ISSN: 2395-0072 © 2020, IRJET | Impact Factor value: 7.34 | ISO 9001:2008 Certified Journal | Page 3887 [8] Kalkan, E. and S. K. Kunnath.( 2006) “Effects of fling step and forward directivity on seismic response of buildings.” Earthquake Spectra 22 (2):367 [9] Li, S, and L. Xie.( 2007) “Progress and trend on near- field problems in civilengineering.”Acta Seismol.Sin.20(1):105–114. [10] Mansouri, I., G. Ghodrati Amiri, J. W. Hu, M. Khoshkalam, S. Soori, and S. Shahbazi. (2017) “Seismic fragility estimates of LRB base isolated frames using performance-baseddesign.” Shock Vib. 2017:5184790. [11] Park, Y., Y. Wen, and A. Ang. (1986) “Random vibration of hysteretic systems under bi-directional ground motions.” Earthquake Eng. Struct.Dyn.14(4):543– 557.. [12] Park, J., P. Towashiraporn, J. I. Craig, and B. J. Goodno. (2009) “Seismic fragility analysis of low-rise unreinforced masonry structures.” Eng. Struct.31(1):125137. [13] PEER (Pacific Earthquake Engineering Research) Center. (2000)“Strong ground motion database.”Univ.of California, Berkeley, CA.Accessed September1,2017. [14] Pitilakis, K., H. Crowley, and A. Kaynia, eds.( 2014) SYNER-G: Typology definition and fragility functions for physical elements at seismic risk.Vol. 27 of Geotechnical, geological and earthquake engineering.Dordrecht, Netherlands: Springer. [15] Porter, K., R. Kennedy, and R. Bachman.(2007) “Creating fragility functions for performance-based earthquake engineering.” EarthquakeSpectra23(2):471– 489. [16] Ramamoorthy, S. K., P. Gardoni, and J. M. Bracci. (2006). “Probabilistic demand models and fragility curves for reinforced concrete frames.” J. Struct.Eng.132(10):1563–1572. [17] Shahi, R., N. T. Lam, E. F. Gad, I. Saifullah, J. L. Wilson, and K. Watson(2014). “Choice of intensity measure in incremental dynamic analysis.”In Proc., Australian Earthquake Engineering Society 2014 Conf.Melbourne, Australia: Australian Earthquake Engineering Society. [18] Somerville, P. G., N. F. Smith, R.W. Graves, and N. A. Abrahamson.( 1997).“Modification of empirical strong ground motion attenuation relationsto include the amplitude and duration effects of rupture directivity.”Seismol. Res. Lett. 68 (1): 199–222.. [19] Surana, M., Y. Singh, and D. H. Lang. (2018) “Fragility analysis of hill side buildings designed for modern seismic design codes.” Struct. Des. Tall Spec.Build.27(14):e1500.https://doi.org/10.1002/tal.150 0 [20] S.B Halesh(2013) “Finite Element method”Sapna book house publishers,First edition [21] Wen, Y.-K.( 1976) “Method for random vibration of hysteretic systems.”J. Eng. Mech. Div. 102 (2): 249–263. [22] Yadav,K. K., and V. K. Gupta.(2017) “Near-fault fling- step ground motions: Characteristics and simulation.” Soil Dyn. Earthquake Eng.101 (Oct): 90–104. [23]IS: 875(Part 1)-1987, Indian standard code of practice for design loads(other than earthquake) for building and structures. [24]IS: 875(Part 2)-1987, Indian standard code of practice for design loads(other than earthquake) for building and structures. [25]IS: 1893(Part 1)-2002, Indian standard criteria for earthquake resistant design of structures. [26] IS: 800-2007 Indian standard code for practice for general Construction in steel. Bureau of Indian Standards New Delhi. AUTHOR PROFILE Ramu Peeraswami Lamani Post Graduate student M.Tech., Program in structural Engineering Centre for PG studies V.T.U.,Mysuru Mr.Sreenivasa M B Assistant Professor M.Tech., Program in structural Engineering Centre for PG studies V.T.U.,Mysuru