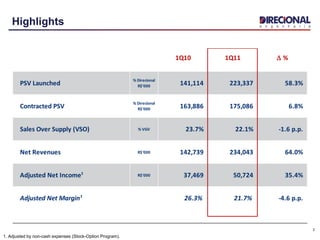
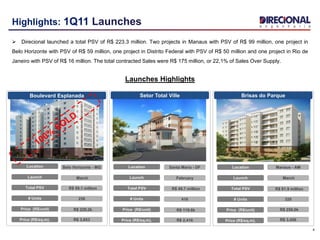
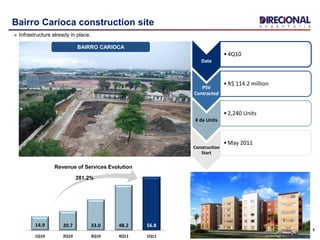
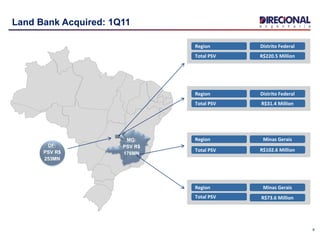
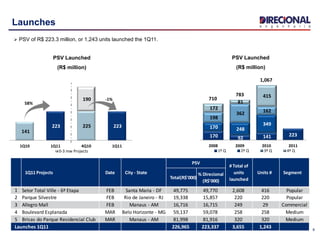
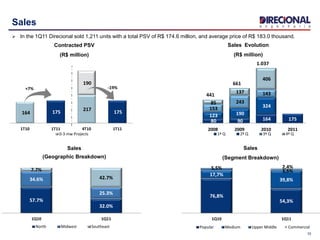
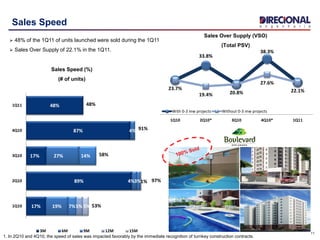
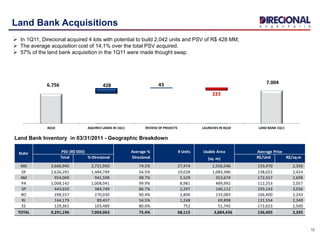
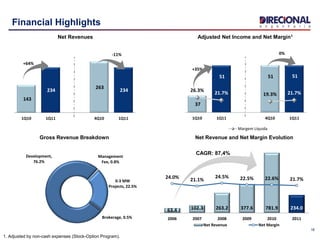
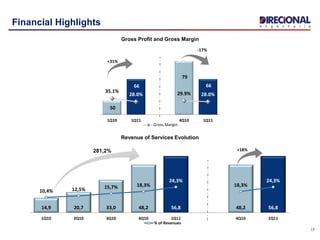
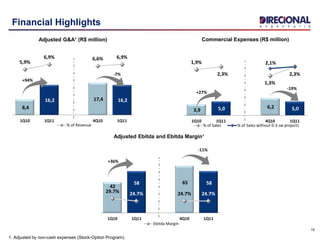
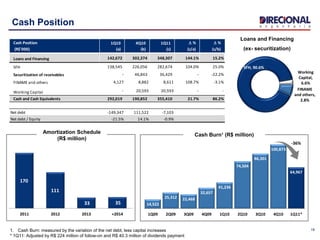
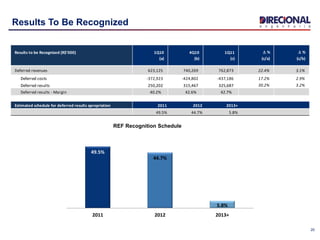
1
Earnings Release | Conference Call – 1Q11
2
Agenda
Ricardo Ribeiro Gontijo
COO
Roberto Senna
CEO
Carlos Wollenweber
CFO | IR
1Q11 Highlights
Operating Highlights
Financial Highlights
1Q10 1Q11 D %
PSV Launched
% Direcional
R$'000 141,114 223,337 58.3%
Contracted PSV
% Direcional
R$'000 163,886 175,086 6.8%
Sales Over Supply (VSO) % PSV 23.7% 22.1% -1.6 p.p.
Net Revenues R$'000 142,739 234,043 64.0%
Adjusted Net Income¹ R$'000 37,469 50,724 35.4%
Adjusted Net Margin¹ 26.3% 21.7% -4.6 p.p.
1Q10 1Q11 D %
PSV Launched
% Direcional
R$'000 141,114 223,337 58.3%
Contracted PSV
% Direcional
R$'000 163,886 175,086 6.8%
Sales Over Supply (VSO) % VGV 23.7% 22.1% -1.6 p.p.
Net Revenues R$'000 142,739 234,043 64.0%
Adjusted Net Income¹ R$'000 37,469 50,724 35.4%
Adjusted Net Margin¹ 26.3% 21.7% -4.6 p.p.
Highlights
3
1. Adjusted by non-cash expenses (Stock-Option Program).
4
March
R$ 59.1 million
R$ 229.2k
R$ 3,653
258
Launch
Total PSV
Price (R$/unit)
Price (R$/sq.m).
# Units
Belo Horizonte - MGLocation
February
R$ 49.7 million
R$ 119.6k
R$ 2,416
416
Santa Maria - DF
March
R$ 81.9 million
R$ 256.0k
R$ 3,456
320
Manaus - AM
Brisas do ParqueBoulevard Esplanada Setor Total Ville
Highlights: 1Q11 Launches
 Direcional launched a total PSV of R$ 223.3 million. Two projects in Manaus with PSV of R$ 99 million, one project in
Belo Horizonte with PSV of R$ 59 million, one project in Distrito Federal with PSV of R$ 50 million and one project in Rio de
Janeiro with PSV of R$ 16 million. The total contracted Sales were R$ 175 million, or 22,1% of Sales Over Supply.
Launches Highlights
Launch
Total PSV
Price (R$/unit)
Price (R$/sq.m).
# Units
Location
Launch
Total PSV
Price (R$/unit)
Price (R$/sq.m).
# Units
Location
14.9 20.7 33.0 48.2 56.8
1Q10 2Q10 3Q10 4Q11 1Q11
5
Bairro Carioca construction site
 Infrastructure already in place.
281.2%
Revenue of Services Evolution
Date
•4Q10
PSV
Contracted
•R$ 114.2 million
# de Units
•2,240 Units
Construction
Start
•May 2011
BAIRRO CARIOCA
DF:
PSV R$
253MN
6
Region Distrito Federal
Total PSV R$220.5 Million
Region Distrito Federal
Total PSV R$31.4 Million
Region Minas Gerais
Total PSV R$73.6 Million
Region Minas Gerais
Total PSV R$102.6 Million
Land Bank Acquired: 1Q11
MG:
PSV R$
176MN
7
Operating Highlights
Ricardo Ribeiro Gontijo Operating Highlights
 Launches
 Sales
 Land bank
 Inventory
141
223 225 223
190
1Q10 1Q11 4Q10 1Q11
0-3 mw Projects
Total(R$'000)
% Direcional
(R$'000)
1 Setor Total Ville - 6ª Etapa FEB Santa Maria - DF 49,775 49,770 2,608 416 Popular
2 Parque Silvestre FEB Rio de Janeiro - RJ 19,338 15,857 220 220 Popular
3 Allegro Mall FEB Manaus - AM 16,716 16,715 249 29 Commercial
4 Boulevard Esplanada MAR Belo Horizonte - MG 59,137 59,078 258 258 Medium
5 Brisas do Parque Residencial Club MAR Manaus - AM 81,998 81,916 320 320 Medium
Launches 1Q11 226,965 223,337 3,655 1,243
SegmentUnits #
PSV
# Total of
units
launched
1Q11 Projects Date City - State
170 92 141 223
170 248
349
198
362 162
172
81
415
2008 2009 2010 2011
1º Q 2º Q 3º Q 4º Q
8
Launches
 PSV of R$ 223.3 million, or 1,243 units launched the 1Q11.
PSV Launched
(R$ million)
PSV Launched
(R$ million)
710
783
1,067
58%
-1%
97.8%
51.2%
46.5%
2.2% 2.3%
1Q10 1Q11
Popular Medium Upper Middle Commercial
73.3%
28.1%
24.5%
33.5%
2.2%
38.5%
1Q10 1Q11
North Midwest Southeast
9
Launches Breakdown
Launches
(Segment Breakdown - Units)
Launches
(Geographic Breakdown - Units)
Boulevard EsplanadaSetor Total Ville
Parque Silvestre
Brisas do Parque
Allegro Mall
76,8%
54,3%
17,7%
39,8%
5,5%
3,5%
2,4%
1Q10 1Q11
Popular Medium Upper Middle Commercial
164 175
217
175
190
1T10 1T11 4T10 1T11
0-3 mw Projects
57.7%
32.0%
34.6%
25.3%
7.7%
42.7%
1Q10 1Q11
North Midwest Southeast
80 90 164 175
123 190
324153
243
143
85
137
406
2008 2009 2010 2011
1º Q 2º Q 3º Q 4º Q
Contracted PSV
(R$ million)
Sales Evolution
(R$ million)
Sales
(Geographic Breakdown)
Sales
(Segment Breakdown)
10
Sales
 In the 1Q11 Direcional sold 1,211 units with a total PSV of R$ 174.6 million, and average price of R$ 183.0 thousand.
441
661
1.037
+7% -19%
17%
89%
17%
87%
48%
19%
4%
27%
4%
7%
3%
14%
5%
1%
5%1Q10
2Q10
3Q10
4Q10
1Q11
3M 6M 9M 12M 15M
91%
58%
97%
53%
48%
33.8%
38.3%
23.7%
19.4% 20.8%
27.6%
22.1%
1Q10 2Q10* 3Q10 4Q10* 1Q11
With 0-3 mw projects Without 0-3 mw projects
11
Sales Speed
 48% of the 1Q11 of units launched were sold during the 1Q11
 Sales Over Supply of 22.1% in the 1Q11.
Sales Over Supply (VSO)
(Total PSV)
Sales Speed (%)
(# of units)
1. In 2Q10 and 4Q10, the speed of sales was impacted favorably by the immediate recognition of turnkey construction contracts.
6.756 7.004
428 43
223
4Q10 AQUIRED LANDS IN 1Q11 REVIEW OF PROJECTS LAUNCHES IN 4Q10 LAND BANK 1Q11
Average % # Units Usable Area
Total % Direcional Direcional (sq. m) R$/Unit R$/sq.m
MG 3,666,945 2,721,950 74.2% 27,474 1,556,546 133,470 2,356
DF 2,626,291 1,484,749 56.5% 19,028 1,083,386 138,022 2,424
AM 954,069 941,598 98.7% 5,529 353,674 172,557 2,698
PA 1,008,142 1,008,041 99.9% 8,981 489,992 112,253 2,057
SP 443,650 384,749 86.7% 2,297 146,112 193,143 3,036
RO 298,557 270,030 90.4% 2,806 133,083 106,400 2,243
RJ 164,179 89,457 54.5% 1,248 69,898 131,554 2,349
ES 129,361 103,489 80.0% 752 51,745 172,023 2,500
TOTAL 9,291,196 7,004,063 75.4% 68,115 3,884,436 136,405 2,392
PSV (R$'000) Average PriceState
12
Land Bank Acquisitions
 In 1Q11, Direcional acquired 4 lots with potential to build 2,042 units and PSV of R$ 428 MM;
 The average acquisition cost of 14,1% over the total PSV acquired.
 57% of the land bank acquisition in the 1Q11 were made thought swap.
Land Bank Inventory in 03/31/2011 - Geographic Breakdown
Manaus Total Ville AM under construction 3,640 2,136
Total Ville Bella Cittá PA under construction 4,714 3,732
Total Ville Marabá PA under construction 5,604 4,664
Allegro Residencial Club AM under construction 1,648 704
Setor Total Ville DF under construction 4,672 2,064
Total Ville Porto Velho RO under construction 2,852 1,868
Dream Park ES under construction 1,034 752
Eliza Miranda AM under construction 2,112 128
Cachoeiras do Madeira RO under construction 1,278 426
TotalVille Macaé RJ under construction 1,125 719
Águas Claras DF to be launched 1,148 1,148
Granjas Werneck MG to be launched 15,000 15,000
Floramar MG to be launched 1,172 1,172
Samambaia DF to be launched 14,614 14,614
Sítio São João MG to be launched 2,500 2,500
Ferroeste MG to be launched 2,388 2,388
Total 65,501 54,015
Project Status
Total of
units
Units to be
launched
Popular,
79.3%
Upper
Middle,
1.6%
Medium,
17.6%
Commercial,
1.4%
13
1
ES
1,1%
AM
8,2%
MG
40,3%
RO
4,1%
SP
3,4%
PA
13,2%
DF
27,9%
RJ
1,8%
Land Bank Breakdown
 Land Bank of R$ 7,0 billion with potential of 68,115 units;
 The average cost of acquisition over PSV of 9.1%
Geographic Distribution (# of units)
Segment Breakdown
(units)
Pipeline of Projects
78.2% of units to be launched comprised a large scale projects
“MINHA CASA, MINHA VIDA”
50.6k units elegible for the program
74.2% of total Land bank
Total % Direcional
Launches 1Q11 126,941 124,519 698 592 52.1%
Launches 4Q10 132,977 77,695 458 442 8.5%
Launches 3Q10 76,919 74,865 773 704 41.0%
Launches 2Q10 62,036 61,974 152 121 3.0%
Launches 1Q10 79,202 71,239 607 560 45.9%
Launches 4Q09 2,071 2,070 18 18 2.1%
Launches 3Q09 86,266 76,129 697 474 11.1%
Launches 2Q09 23,028 19,043 231 116 3.9%
Launches 1Q09 29,733 26,138 214 198 20.8%
Launches 4Q08 61,862 45,576 319 240 19.8%
Launches 3Q08 25,931 20,744 201 89 6.5%
Launches 2Q08 7,820 6,586 67 25 3.4%
Launches 1Q08 6,657 5,858 31 13 3.1%
Previous launches 6,151 3,058 39 13 2.8%
Under Construction 727,595 615,494 4,505 3,605 13.6%
Completed Units 42,467 20,096 224 199 3.8%
Total Inventory 770,062 635,590 4,729 3,804 11.9%
Inventory
PSV in Inventory (R$'000)
Units in
Inventory
Units in
Inventory
(without swap)
% Units in
Inventory
14
Inventory
 PSV of R$ 636 million, or 3,804 units;
 Inventory of completed units of R$ 20.1 million, or 199 units;
 Projects under construction have an average of 86,4% units already sold.
Only 3.8% of our inventory are from
finished units
15
Financial Highlights
 Financial Performance
 Liquidity Indicators
 Results to be Recognized
 Performance Shares
Carlos Wollenweber Financial Highlights
Development,
76.2%
Management
Fee, 0.8%
0-3 MW
Projects, 22.5%
Brokerage, 0.5%
37
51 51 51
26.3% 21.7% 19.3% 21.7%
0.0%
10.0%
20.0%
30.0%
40.0%
50.0%
60.0%
70.0%
80.0%
90.0%
100.0%
30
35
40
45
50
55
1Q10 1Q11 4Q10 1Q11
Margem Líquida
143
234
263
234
1Q10 1Q11 4Q10 1Q11
63.4 102.3 263.2 377.6 781.9 234.0
24.0% 21.1%
24.5% 22.5% 22.6% 21.7%
2006 2007 2008 2009 2010 2011
Net Revenue Net Margin
+64%
-11%
16
Financial Highlights
Adjusted Net Income and Net Margin1
1. Adjusted by non-cash expenses (Stock-Option Program).
Gross Revenue Breakdown
Net Revenues
+35%
0%
CAGR: 87,4%
Net Revenue and Net Margin Evolution
14,9 20,7 33,0 48,2 56,8 48,2 56,8
10,4% 12,5% 15,7% 18,3%
24,3%
18,3%
24,3%
1Q10 2Q10 3Q10 4Q10 1Q11 4Q10 1Q11
% of Revenues
Revenue of Services Evolution
17
Financial Highlights
Gross Profit and Gross Margin
+31%
-17%
281,2% +18%
50
66
79
66
35.1%
28.0% 29.9% 28.0%
0.0%
20.0%
40.0%
60.0%
80.0%
100.0%
120.0%
40
45
50
55
60
65
70
75
80
1Q10 1Q11 4Q10 1Q11
Gross Margin
3,9 5,0 6,2 5,0
1,9%
2,3%
1,3%
2,3%
2,1%
-3,0%
-2,0%
-1,0%
0,0%
1,0%
2,0%
3,0%
-
2,0
4,0
6,0
8,0
10,0
12,0
14,0
16,0
18,0
20,0
1Q10 1Q11 4Q10 1Q11
% of Sales % of Sales without 0-3 sw projects
8,4
16,2 17,4 16,2
5,9%
6,9% 6,6% 6,9%
-4,0%
-2,0%
0,0%
2,0%
4,0%
6,0%
8,0%
-
5,0
10,0
15,0
20,0
25,0
30,0
1Q10 1Q11 4Q10 1Q11
% of Revenue
42
58 65 58
29.7% 24.7% 24.7% 24.7%
0.0%
20.0%
40.0%
60.0%
80.0%
100.0%
120.0%
-
10
20
30
40
50
60
70
80
1Q10 1Q11 4Q10 1Q11
Ebitda Margin
18
Financial Highlights
Adjusted Ebitda and Ebitda Margin¹
Adjusted G&A¹ (R$ million) Commercial Expenses (R$ million)
+94%
-7%
+27%
-19%
+36%
-11%
1. Adjusted by non-cash expenses (Stock-Option Program).
Cash Position 1Q10 4Q10 1Q11 D % D %
(R$'000) (a) (b) (c) (c/a) (c/b)
Loans and Financing 142,672 302,374 348,307 144.1% 15.2%
SFH 138,545 226,056 282,674 104.0% 25.0%
Securitization of receivables - 46,843 36,429 - -22.2%
FINAME and others 4,127 8,882 8,611 108.7% -3.1%
Working Capital - 20,593 20,593 - -
Cash and Cash Equivalents 292,019 190,852 355,410 21.7% 86.2%
Net debt -149,347 111,522 -7,103
Net debt / Equity -21.5% 14.1% -0.9%
SFH, 90.6%
FINAME
and others,
2.8%
Working
Capital,
6.6%
14,522
25,312 22,468
32,657
41,236
74,504
86,301
100,873
64,967
1Q09 2Q09 3Q09 4Q09 1Q10 2Q10 3Q10 4Q10 1Q11*
170
111
33 35
2011 2012 2013 +2014
1. Cash Burn: measured by the variation of the net debt, less capital increases
* 1Q11: Adjusted by R$ 224 million of follow-on and R$ 40.3 million of dividends payment
19
Cash Position
Amortization Schedule
(R$ million)
Cash Burn¹ (R$ million)
Loans and Financing
(ex- securitization)
-36%
49.5%
44.7%
5.8%
2011 2012 2013+
Results to be Recognized (R$'000) 1Q10 4Q10 1Q11 D % D %
(a) (b) (c) (c/a) (c/b)
Deferred revenues 623,125 740,269 762,873 22.4% 3.1%
Deferred costs -372,923 -424,802 -437,186 17.2% 2.9%
Deferred results 250,202 315,467 325,687 30.2% 3.2%
Deferred results - Margin 40.2% 42.6% 42.7%
Estimated schedule for deferred results apropriation 2011 2012 2013+
49.5% 44.7% 5.8%
20
Results To Be Recognized
REF Recognition Schedule
0
20
40
60
80
100
120
140
160
-
1,000
2,000
3,000
4,000
5,000
6,000
7,000
8,000
9,000
10,000
18-Nov-09
1-Dec-09
11-Dec-09
23-Dec-09
8-Jan-10
20-Jan-10
2-Feb-10
12-Feb-10
26-Feb-10
10-Mar-10
22-Mar-10
1-Apr-10
14-Apr-10
27-Apr-10
7-May-10
19-May-10
1-Jun-10
15-Jun-10
25-Jun-10
7-Jul-10
21-Jul-10
3-Aug-10
16-Aug-10
30-Aug-10
15-Sep-10
1-Oct-10
14-Oct-10
26-Oct-10
8-Nov-10
23-Nov-10
3-Dec-10
17-Dec-10
30-Dec-10
12-Jan-11
24-Jan-11
4-Feb-11
16-Feb-11
28-Feb-11
14-Mar-11
24-Mar-11
5-Apr-11
15-Apr-11
29-Apr-11
PreçodaAção
Volume(R$mil)
Volume (R$ '000)
0
20
40
60
80
100
120
140
160
-
1,000
2,000
3,000
4,000
5,000
6,000
7,000
8,000
9,000
10,000
18-Nov-09
1-Dec-09
11-Dec-09
23-Dec-09
8-Jan-10
20-Jan-10
2-Feb-10
12-Feb-10
26-Feb-10
10-Mar-10
22-Mar-10
1-Apr-10
14-Apr-10
27-Apr-10
7-May-10
19-May-10
1-Jun-10
15-Jun-10
25-Jun-10
7-Jul-10
21-Jul-10
3-Aug-10
16-Aug-10
30-Aug-10
15-Sep-10
1-Oct-10
14-Oct-10
26-Oct-10
8-Nov-10
23-Nov-10
3-Dec-10
17-Dec-10
30-Dec-10
12-Jan-11
24-Jan-11
4-Feb-11
16-Feb-11
28-Feb-11
14-Mar-11
24-Mar-11
5-Apr-11
15-Apr-11
29-Apr-11
StockPrice
Volume(R$'000)
Average Volume (21 days) Direcional Ibovespa IMOB
21
Shares Performance Since IPO
22
Disclosure
This presentation contains certain forward-looking statements concerning the business prospects,
projections of operating and financial results and growth potential of the Company, which are based on
management’s current expectations and estimates of the future performance of the Company. Although the
Company believes such forward-looking statements are based on reasonable assumptions, it can give no
assurance that its expectations will be achieved. Expectations and estimates that are based on the future
prospects of the Company are highly dependent upon market behavior, Brazil’s political and economic
situation, existing and future regulations of the industry and international markets and, therefore, are
subject to changes outside the Company’s and management’s control. The Company undertakes no
obligation to update any information contained herein or to revise any forward-looking statement as a result
of new information, future events or other information.
23
Contacts
Carlos Wollenweber
CFO | IR Officer
Lucas Bousas
IR Analyst
Paulo Sousa
IR Assistant
www.direcional.com.br
ri@direcional.com.br
(55 31) 3214-6200
(55 31) 3214-6450

1Q11 Disclosure and Results

  • 1.
    1 Earnings Release |Conference Call – 1Q11
  • 2.
    2 Agenda Ricardo Ribeiro Gontijo COO RobertoSenna CEO Carlos Wollenweber CFO | IR 1Q11 Highlights Operating Highlights Financial Highlights
  • 3.
    1Q10 1Q11 D% PSV Launched % Direcional R$'000 141,114 223,337 58.3% Contracted PSV % Direcional R$'000 163,886 175,086 6.8% Sales Over Supply (VSO) % PSV 23.7% 22.1% -1.6 p.p. Net Revenues R$'000 142,739 234,043 64.0% Adjusted Net Income¹ R$'000 37,469 50,724 35.4% Adjusted Net Margin¹ 26.3% 21.7% -4.6 p.p. 1Q10 1Q11 D % PSV Launched % Direcional R$'000 141,114 223,337 58.3% Contracted PSV % Direcional R$'000 163,886 175,086 6.8% Sales Over Supply (VSO) % VGV 23.7% 22.1% -1.6 p.p. Net Revenues R$'000 142,739 234,043 64.0% Adjusted Net Income¹ R$'000 37,469 50,724 35.4% Adjusted Net Margin¹ 26.3% 21.7% -4.6 p.p. Highlights 3 1. Adjusted by non-cash expenses (Stock-Option Program).
  • 4.
    4 March R$ 59.1 million R$229.2k R$ 3,653 258 Launch Total PSV Price (R$/unit) Price (R$/sq.m). # Units Belo Horizonte - MGLocation February R$ 49.7 million R$ 119.6k R$ 2,416 416 Santa Maria - DF March R$ 81.9 million R$ 256.0k R$ 3,456 320 Manaus - AM Brisas do ParqueBoulevard Esplanada Setor Total Ville Highlights: 1Q11 Launches  Direcional launched a total PSV of R$ 223.3 million. Two projects in Manaus with PSV of R$ 99 million, one project in Belo Horizonte with PSV of R$ 59 million, one project in Distrito Federal with PSV of R$ 50 million and one project in Rio de Janeiro with PSV of R$ 16 million. The total contracted Sales were R$ 175 million, or 22,1% of Sales Over Supply. Launches Highlights Launch Total PSV Price (R$/unit) Price (R$/sq.m). # Units Location Launch Total PSV Price (R$/unit) Price (R$/sq.m). # Units Location
  • 5.
    14.9 20.7 33.048.2 56.8 1Q10 2Q10 3Q10 4Q11 1Q11 5 Bairro Carioca construction site  Infrastructure already in place. 281.2% Revenue of Services Evolution Date •4Q10 PSV Contracted •R$ 114.2 million # de Units •2,240 Units Construction Start •May 2011 BAIRRO CARIOCA
  • 6.
    DF: PSV R$ 253MN 6 Region DistritoFederal Total PSV R$220.5 Million Region Distrito Federal Total PSV R$31.4 Million Region Minas Gerais Total PSV R$73.6 Million Region Minas Gerais Total PSV R$102.6 Million Land Bank Acquired: 1Q11 MG: PSV R$ 176MN
  • 7.
    7 Operating Highlights Ricardo RibeiroGontijo Operating Highlights  Launches  Sales  Land bank  Inventory
  • 8.
    141 223 225 223 190 1Q101Q11 4Q10 1Q11 0-3 mw Projects Total(R$'000) % Direcional (R$'000) 1 Setor Total Ville - 6ª Etapa FEB Santa Maria - DF 49,775 49,770 2,608 416 Popular 2 Parque Silvestre FEB Rio de Janeiro - RJ 19,338 15,857 220 220 Popular 3 Allegro Mall FEB Manaus - AM 16,716 16,715 249 29 Commercial 4 Boulevard Esplanada MAR Belo Horizonte - MG 59,137 59,078 258 258 Medium 5 Brisas do Parque Residencial Club MAR Manaus - AM 81,998 81,916 320 320 Medium Launches 1Q11 226,965 223,337 3,655 1,243 SegmentUnits # PSV # Total of units launched 1Q11 Projects Date City - State 170 92 141 223 170 248 349 198 362 162 172 81 415 2008 2009 2010 2011 1º Q 2º Q 3º Q 4º Q 8 Launches  PSV of R$ 223.3 million, or 1,243 units launched the 1Q11. PSV Launched (R$ million) PSV Launched (R$ million) 710 783 1,067 58% -1%
  • 9.
    97.8% 51.2% 46.5% 2.2% 2.3% 1Q10 1Q11 PopularMedium Upper Middle Commercial 73.3% 28.1% 24.5% 33.5% 2.2% 38.5% 1Q10 1Q11 North Midwest Southeast 9 Launches Breakdown Launches (Segment Breakdown - Units) Launches (Geographic Breakdown - Units) Boulevard EsplanadaSetor Total Ville Parque Silvestre Brisas do Parque Allegro Mall
  • 10.
    76,8% 54,3% 17,7% 39,8% 5,5% 3,5% 2,4% 1Q10 1Q11 Popular MediumUpper Middle Commercial 164 175 217 175 190 1T10 1T11 4T10 1T11 0-3 mw Projects 57.7% 32.0% 34.6% 25.3% 7.7% 42.7% 1Q10 1Q11 North Midwest Southeast 80 90 164 175 123 190 324153 243 143 85 137 406 2008 2009 2010 2011 1º Q 2º Q 3º Q 4º Q Contracted PSV (R$ million) Sales Evolution (R$ million) Sales (Geographic Breakdown) Sales (Segment Breakdown) 10 Sales  In the 1Q11 Direcional sold 1,211 units with a total PSV of R$ 174.6 million, and average price of R$ 183.0 thousand. 441 661 1.037 +7% -19%
  • 11.
    17% 89% 17% 87% 48% 19% 4% 27% 4% 7% 3% 14% 5% 1% 5%1Q10 2Q10 3Q10 4Q10 1Q11 3M 6M 9M12M 15M 91% 58% 97% 53% 48% 33.8% 38.3% 23.7% 19.4% 20.8% 27.6% 22.1% 1Q10 2Q10* 3Q10 4Q10* 1Q11 With 0-3 mw projects Without 0-3 mw projects 11 Sales Speed  48% of the 1Q11 of units launched were sold during the 1Q11  Sales Over Supply of 22.1% in the 1Q11. Sales Over Supply (VSO) (Total PSV) Sales Speed (%) (# of units) 1. In 2Q10 and 4Q10, the speed of sales was impacted favorably by the immediate recognition of turnkey construction contracts.
  • 12.
    6.756 7.004 428 43 223 4Q10AQUIRED LANDS IN 1Q11 REVIEW OF PROJECTS LAUNCHES IN 4Q10 LAND BANK 1Q11 Average % # Units Usable Area Total % Direcional Direcional (sq. m) R$/Unit R$/sq.m MG 3,666,945 2,721,950 74.2% 27,474 1,556,546 133,470 2,356 DF 2,626,291 1,484,749 56.5% 19,028 1,083,386 138,022 2,424 AM 954,069 941,598 98.7% 5,529 353,674 172,557 2,698 PA 1,008,142 1,008,041 99.9% 8,981 489,992 112,253 2,057 SP 443,650 384,749 86.7% 2,297 146,112 193,143 3,036 RO 298,557 270,030 90.4% 2,806 133,083 106,400 2,243 RJ 164,179 89,457 54.5% 1,248 69,898 131,554 2,349 ES 129,361 103,489 80.0% 752 51,745 172,023 2,500 TOTAL 9,291,196 7,004,063 75.4% 68,115 3,884,436 136,405 2,392 PSV (R$'000) Average PriceState 12 Land Bank Acquisitions  In 1Q11, Direcional acquired 4 lots with potential to build 2,042 units and PSV of R$ 428 MM;  The average acquisition cost of 14,1% over the total PSV acquired.  57% of the land bank acquisition in the 1Q11 were made thought swap. Land Bank Inventory in 03/31/2011 - Geographic Breakdown
  • 13.
    Manaus Total VilleAM under construction 3,640 2,136 Total Ville Bella Cittá PA under construction 4,714 3,732 Total Ville Marabá PA under construction 5,604 4,664 Allegro Residencial Club AM under construction 1,648 704 Setor Total Ville DF under construction 4,672 2,064 Total Ville Porto Velho RO under construction 2,852 1,868 Dream Park ES under construction 1,034 752 Eliza Miranda AM under construction 2,112 128 Cachoeiras do Madeira RO under construction 1,278 426 TotalVille Macaé RJ under construction 1,125 719 Águas Claras DF to be launched 1,148 1,148 Granjas Werneck MG to be launched 15,000 15,000 Floramar MG to be launched 1,172 1,172 Samambaia DF to be launched 14,614 14,614 Sítio São João MG to be launched 2,500 2,500 Ferroeste MG to be launched 2,388 2,388 Total 65,501 54,015 Project Status Total of units Units to be launched Popular, 79.3% Upper Middle, 1.6% Medium, 17.6% Commercial, 1.4% 13 1 ES 1,1% AM 8,2% MG 40,3% RO 4,1% SP 3,4% PA 13,2% DF 27,9% RJ 1,8% Land Bank Breakdown  Land Bank of R$ 7,0 billion with potential of 68,115 units;  The average cost of acquisition over PSV of 9.1% Geographic Distribution (# of units) Segment Breakdown (units) Pipeline of Projects 78.2% of units to be launched comprised a large scale projects “MINHA CASA, MINHA VIDA” 50.6k units elegible for the program 74.2% of total Land bank
  • 14.
    Total % Direcional Launches1Q11 126,941 124,519 698 592 52.1% Launches 4Q10 132,977 77,695 458 442 8.5% Launches 3Q10 76,919 74,865 773 704 41.0% Launches 2Q10 62,036 61,974 152 121 3.0% Launches 1Q10 79,202 71,239 607 560 45.9% Launches 4Q09 2,071 2,070 18 18 2.1% Launches 3Q09 86,266 76,129 697 474 11.1% Launches 2Q09 23,028 19,043 231 116 3.9% Launches 1Q09 29,733 26,138 214 198 20.8% Launches 4Q08 61,862 45,576 319 240 19.8% Launches 3Q08 25,931 20,744 201 89 6.5% Launches 2Q08 7,820 6,586 67 25 3.4% Launches 1Q08 6,657 5,858 31 13 3.1% Previous launches 6,151 3,058 39 13 2.8% Under Construction 727,595 615,494 4,505 3,605 13.6% Completed Units 42,467 20,096 224 199 3.8% Total Inventory 770,062 635,590 4,729 3,804 11.9% Inventory PSV in Inventory (R$'000) Units in Inventory Units in Inventory (without swap) % Units in Inventory 14 Inventory  PSV of R$ 636 million, or 3,804 units;  Inventory of completed units of R$ 20.1 million, or 199 units;  Projects under construction have an average of 86,4% units already sold. Only 3.8% of our inventory are from finished units
  • 15.
    15 Financial Highlights  FinancialPerformance  Liquidity Indicators  Results to be Recognized  Performance Shares Carlos Wollenweber Financial Highlights
  • 16.
    Development, 76.2% Management Fee, 0.8% 0-3 MW Projects,22.5% Brokerage, 0.5% 37 51 51 51 26.3% 21.7% 19.3% 21.7% 0.0% 10.0% 20.0% 30.0% 40.0% 50.0% 60.0% 70.0% 80.0% 90.0% 100.0% 30 35 40 45 50 55 1Q10 1Q11 4Q10 1Q11 Margem Líquida 143 234 263 234 1Q10 1Q11 4Q10 1Q11 63.4 102.3 263.2 377.6 781.9 234.0 24.0% 21.1% 24.5% 22.5% 22.6% 21.7% 2006 2007 2008 2009 2010 2011 Net Revenue Net Margin +64% -11% 16 Financial Highlights Adjusted Net Income and Net Margin1 1. Adjusted by non-cash expenses (Stock-Option Program). Gross Revenue Breakdown Net Revenues +35% 0% CAGR: 87,4% Net Revenue and Net Margin Evolution
  • 17.
    14,9 20,7 33,048,2 56,8 48,2 56,8 10,4% 12,5% 15,7% 18,3% 24,3% 18,3% 24,3% 1Q10 2Q10 3Q10 4Q10 1Q11 4Q10 1Q11 % of Revenues Revenue of Services Evolution 17 Financial Highlights Gross Profit and Gross Margin +31% -17% 281,2% +18% 50 66 79 66 35.1% 28.0% 29.9% 28.0% 0.0% 20.0% 40.0% 60.0% 80.0% 100.0% 120.0% 40 45 50 55 60 65 70 75 80 1Q10 1Q11 4Q10 1Q11 Gross Margin
  • 18.
    3,9 5,0 6,25,0 1,9% 2,3% 1,3% 2,3% 2,1% -3,0% -2,0% -1,0% 0,0% 1,0% 2,0% 3,0% - 2,0 4,0 6,0 8,0 10,0 12,0 14,0 16,0 18,0 20,0 1Q10 1Q11 4Q10 1Q11 % of Sales % of Sales without 0-3 sw projects 8,4 16,2 17,4 16,2 5,9% 6,9% 6,6% 6,9% -4,0% -2,0% 0,0% 2,0% 4,0% 6,0% 8,0% - 5,0 10,0 15,0 20,0 25,0 30,0 1Q10 1Q11 4Q10 1Q11 % of Revenue 42 58 65 58 29.7% 24.7% 24.7% 24.7% 0.0% 20.0% 40.0% 60.0% 80.0% 100.0% 120.0% - 10 20 30 40 50 60 70 80 1Q10 1Q11 4Q10 1Q11 Ebitda Margin 18 Financial Highlights Adjusted Ebitda and Ebitda Margin¹ Adjusted G&A¹ (R$ million) Commercial Expenses (R$ million) +94% -7% +27% -19% +36% -11% 1. Adjusted by non-cash expenses (Stock-Option Program).
  • 19.
    Cash Position 1Q104Q10 1Q11 D % D % (R$'000) (a) (b) (c) (c/a) (c/b) Loans and Financing 142,672 302,374 348,307 144.1% 15.2% SFH 138,545 226,056 282,674 104.0% 25.0% Securitization of receivables - 46,843 36,429 - -22.2% FINAME and others 4,127 8,882 8,611 108.7% -3.1% Working Capital - 20,593 20,593 - - Cash and Cash Equivalents 292,019 190,852 355,410 21.7% 86.2% Net debt -149,347 111,522 -7,103 Net debt / Equity -21.5% 14.1% -0.9% SFH, 90.6% FINAME and others, 2.8% Working Capital, 6.6% 14,522 25,312 22,468 32,657 41,236 74,504 86,301 100,873 64,967 1Q09 2Q09 3Q09 4Q09 1Q10 2Q10 3Q10 4Q10 1Q11* 170 111 33 35 2011 2012 2013 +2014 1. Cash Burn: measured by the variation of the net debt, less capital increases * 1Q11: Adjusted by R$ 224 million of follow-on and R$ 40.3 million of dividends payment 19 Cash Position Amortization Schedule (R$ million) Cash Burn¹ (R$ million) Loans and Financing (ex- securitization) -36%
  • 20.
    49.5% 44.7% 5.8% 2011 2012 2013+ Resultsto be Recognized (R$'000) 1Q10 4Q10 1Q11 D % D % (a) (b) (c) (c/a) (c/b) Deferred revenues 623,125 740,269 762,873 22.4% 3.1% Deferred costs -372,923 -424,802 -437,186 17.2% 2.9% Deferred results 250,202 315,467 325,687 30.2% 3.2% Deferred results - Margin 40.2% 42.6% 42.7% Estimated schedule for deferred results apropriation 2011 2012 2013+ 49.5% 44.7% 5.8% Results to be Recognized (R$'000) 1Q10 4Q10 1Q11 D % D % (a) (b) (c) (c/a) (c/b) Deferred revenues 623,125 740,269 762,873 22.4% 3.1% Deferred costs -372,923 -424,802 -437,186 17.2% 2.9% Deferred results 250,202 315,467 325,687 30.2% 3.2% Deferred results - Margin 40.2% 42.6% 42.7% Estimated schedule for deferred results apropriation 2011 2012 2013+ 49.5% 44.7% 5.8% 20 Results To Be Recognized REF Recognition Schedule
  • 21.
    0 20 40 60 80 100 120 140 160 - 1,000 2,000 3,000 4,000 5,000 6,000 7,000 8,000 9,000 10,000 18-Nov-09 1-Dec-09 11-Dec-09 23-Dec-09 8-Jan-10 20-Jan-10 2-Feb-10 12-Feb-10 26-Feb-10 10-Mar-10 22-Mar-10 1-Apr-10 14-Apr-10 27-Apr-10 7-May-10 19-May-10 1-Jun-10 15-Jun-10 25-Jun-10 7-Jul-10 21-Jul-10 3-Aug-10 16-Aug-10 30-Aug-10 15-Sep-10 1-Oct-10 14-Oct-10 26-Oct-10 8-Nov-10 23-Nov-10 3-Dec-10 17-Dec-10 30-Dec-10 12-Jan-11 24-Jan-11 4-Feb-11 16-Feb-11 28-Feb-11 14-Mar-11 24-Mar-11 5-Apr-11 15-Apr-11 29-Apr-11 PreçodaAção Volume(R$mil) Volume (R$ '000) 0 20 40 60 80 100 120 140 160 - 1,000 2,000 3,000 4,000 5,000 6,000 7,000 8,000 9,000 10,000 18-Nov-09 1-Dec-09 11-Dec-09 23-Dec-09 8-Jan-10 20-Jan-10 2-Feb-10 12-Feb-10 26-Feb-10 10-Mar-10 22-Mar-10 1-Apr-10 14-Apr-10 27-Apr-10 7-May-10 19-May-10 1-Jun-10 15-Jun-10 25-Jun-10 7-Jul-10 21-Jul-10 3-Aug-10 16-Aug-10 30-Aug-10 15-Sep-10 1-Oct-10 14-Oct-10 26-Oct-10 8-Nov-10 23-Nov-10 3-Dec-10 17-Dec-10 30-Dec-10 12-Jan-11 24-Jan-11 4-Feb-11 16-Feb-11 28-Feb-11 14-Mar-11 24-Mar-11 5-Apr-11 15-Apr-11 29-Apr-11 StockPrice Volume(R$'000) AverageVolume (21 days) Direcional Ibovespa IMOB 21 Shares Performance Since IPO
  • 22.
    22 Disclosure This presentation containscertain forward-looking statements concerning the business prospects, projections of operating and financial results and growth potential of the Company, which are based on management’s current expectations and estimates of the future performance of the Company. Although the Company believes such forward-looking statements are based on reasonable assumptions, it can give no assurance that its expectations will be achieved. Expectations and estimates that are based on the future prospects of the Company are highly dependent upon market behavior, Brazil’s political and economic situation, existing and future regulations of the industry and international markets and, therefore, are subject to changes outside the Company’s and management’s control. The Company undertakes no obligation to update any information contained herein or to revise any forward-looking statement as a result of new information, future events or other information.
  • 23.
    23 Contacts Carlos Wollenweber CFO |IR Officer Lucas Bousas IR Analyst Paulo Sousa IR Assistant www.direcional.com.br ri@direcional.com.br (55 31) 3214-6200 (55 31) 3214-6450