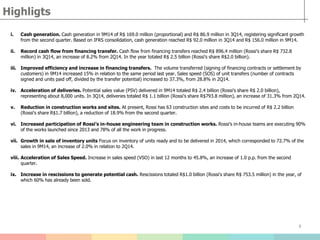
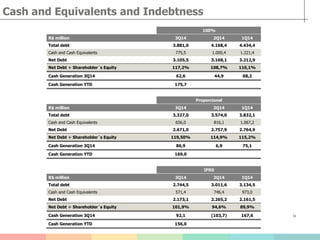
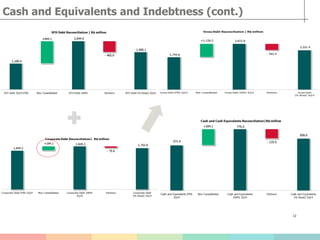
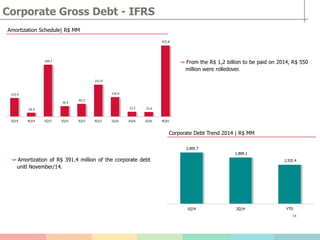
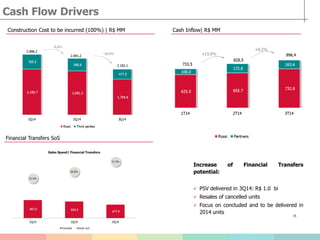
- Cash generation was strong in the third quarter and first nine months of 2014, both for Rossi Residencial on a proportional basis and on an IFRS consolidated basis.
- Record cash flow from financing transfers was achieved in the third quarter, with continued growth in the volume of financing contracts signed.
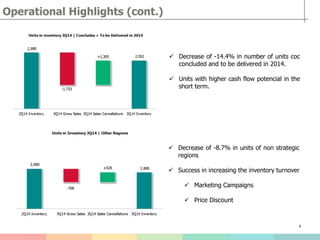
- Potential sales value delivered increased significantly in the first nine months, with an acceleration of deliveries in the third quarter alone.
- Construction sites and costs to be incurred decreased, while Rossi's in-house engineering team now executes a large majority of construction work.