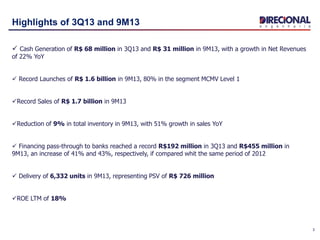
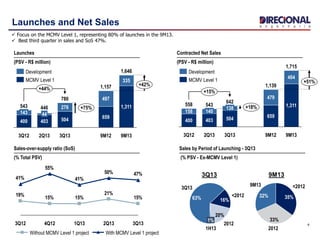
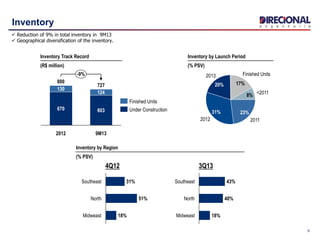
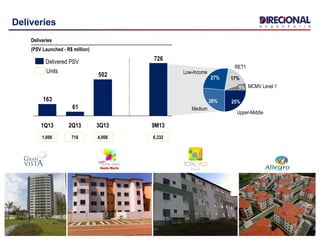
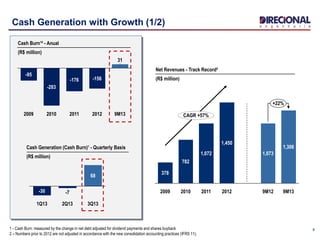
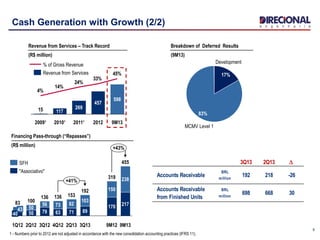
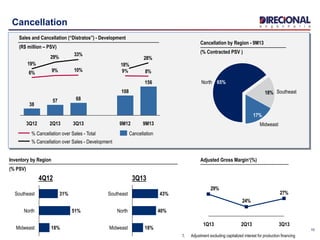
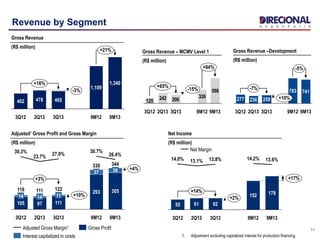
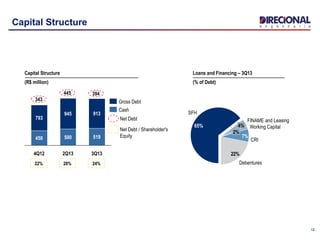
1
Earnings Release | Conference Call – 3Q13
November 12th, 2013
2
Agenda
Ricardo Ribeiro
Vice President
Carlos Wollenweber
CFO | IR Officer
Operational Highlights
Financial Highlights
3
Highlights of 3Q13 and 9M13
 Cash Generation of R$ 68 million in 3Q13 and R$ 31 million in 9M13, with a growth in Net Revenues
of 22% YoY
 Record Launches of R$ 1.6 billion in 9M13, 80% in the segment MCMV Level 1
Record Sales of R$ 1.7 billion in 9M13
Reduction of 9% in total inventory in 9M13, with 51% growth in sales YoY
 Financing pass-through to banks reached a record R$192 million in 3Q13 and R$455 million in
9M13, an increase of 41% and 43%, respectively, if compared whit the same period of 2012
 Delivery of 6,332 units in 9M13, representing PSV of R$ 726 million
ROE LTM of 18%
4
Launches and Net Sales
 Focus on the MCMV Level 1, representing 80% of launches in the 9M13.
 Best third quarter in sales and SoS 47%.
659
479
3Q13
642
504
138
2Q13
543
403
1,715
+51%
+15%
+18%
9M13
1,311
404
9M12
1,139
140
3Q12
558
400
158
Contracted Net Sales
(PSV - R$ million)
15%
21%
15%15%
19%
47%50%
41%
55%
41%
3Q12 4Q12 3Q132Q131Q13
With MCMV Level 1 projectWithout MCMV Level 1 project
Sales by Period of Launching - 3Q13
(% PSV - Ex-MCMV Level 1)
3Q13
63%
1H13
1%
2012
20%
<2012
16%
Sales-over-supply ratio (SoS)
(% Total PSV)
33%
<2012
35%32%
9M13
2012
3Q13 9M13
+44%
1,311
9M13
+75%
+42%
1,646
400
143
335
9M12
1,157
659
497
3Q13
780
504
276
2Q13
446
403
44
3Q12
543
Launches
(PSV - R$ million)
Development
MCMV Level 1
Development
MCMV Level 1
5
Inventory
8%
31%
2012
23%
2011
<2011
17%
Finished Units2013
20%
Midweast 18%
North 51%
Southeast 31%
9M13
727
603
124
2012
800
670
130
-9%
Finished Units
Under Construction
Inventory by Region
(% PSV)
Inventory by Launch Period
(% PSV)
Inventory Track Record
(R$ million)
43%
18%Midweast
North 40%
Southeast
4Q12 3Q13
 Reduction of 9% in total inventory in 9M13
 Geographical diversification of the inventory.
6
Deliveries
Deliveries
(PSV Launched - R$ million)
Units
1,606
726
502
61
163
9M133Q132Q131Q13
Delivered PSV
718 4,008 6,332
MCMV Level 15%
RET1
17%
Low-Income
27%
Medium
26%
Upper-Middle
25%
7
Carlos Wollenweber
CFO | IR Officer
Financial Highlights
8
Cash Generation with Growth (1/2)
1 - Cash Burn: measured by the change in net debt adjusted for dividend payments and shares buyback
2 – Numbers prior to 2012 are not adjusted in accordance with the new consolidation accounting practices (IFRS 11).
9M13
31
2012
-156
2011
-176
2010
-283
2009
-95
Cash Burn¹² - Anual
(R$ million)
Net Revenues - Track Record²
(R$ million)
+22%
CAGR +57%
9M13
1,306
9M12
1,073
2012
1,450
2011
1,072
2010
782
2009
378
3Q13
68
2Q13
-7
1Q13
-30
Cash Generation (Cash Burn)¹ - Quarterly Basis
(R$ million)
9
Cash Generation with Growth (2/2)
1 - Numbers prior to 2012 are not adjusted in accordance with the new consolidation accounting practices (IFRS 11).
15
45%
33%
24%
14%
4%
9M13
598
2012
457
2011¹
269
2010¹
117
2009¹
Revenue from Services
% of Gross Revenue
Revenue from Services – Track Record
(R$ million)
MCMV Level 1
83%
Development
17%
Breakdown of Deferred Results
(9M13)
Financing Pass-through (“Repasses”)
(R$ million)
+41%
+43%
9M13
455
217
238
9M12
319
170
150
3Q13
192
89
103
153
71
82
4Q12
136
63
73
3Q12
136
79
56
2Q12
100
50
50
1Q12
83
40
43
2Q13
"Associativo"
SFH 3Q13 2Q13 D
Accounts Receivable
BRL
million
192 218 -26
Accounts Receivable
from Finished Units
BRL
million
698 668 30
10
Cancellation
18% Southeast
North 65%
Midweast
17%
Cancellation by Region - 9M13
(% Contracted PSV )
Sales and Cancellation (“Distratos”) - Development
(R$ million – PSV)
8%10%9%6%
28%
18%
33%
29%
19%
9M12
108
9%
3Q13
68
2Q13
57
3Q12
38
9M13
156
Cancellation
% Cancellation over Sales - Development
% Cancellation over Sales - Total
Adjusted Gross Margin¹(%)
1. Adjustment excluding capitalized interest for production financing
27%
24%
29%
3Q132Q131Q13
North
31%Southeast
51%
18%Midweast
Inventory by Region
(% PSV)
Midweast
Southeast
40%North
18%
43%
4Q12 3Q13
11
Revenue by Segment
+21%
+16%
-3%
9M13
1,340
9M12
1,109
3Q13
465
2Q13
478
3Q12
402
Gross Revenue
(R$ million)
Adjusted¹ Gross Profit and Gross Margin
(R$ million)
37
30.7%
3Q13
122
111
11
27.0%
2Q13
344
97
14
23.7%
3Q12
118
105
14
30.3%
+4%
+10%
+3%
9M13
305
39
26.4%
9M12
330
293111
Gross Profit
Interest capitalized in costs
Adjusted Gross Margin¹
Net Income
(R$ million)
2Q13
61
13.1%
3Q12
55
14.0%
+17%
+2%
+14%
9M13
178
13.6%
9M12
152
14.2%
3Q13
62
13.8%
Net Margin
242 326
598
206125
+84%
+65%
-15%
9M139M123Q132Q133Q12
Gross Revenue – MCMV Level 1
(R$ million)
-5%
-7%
+10%
9M13
741
9M12
783
3Q13
259
2Q13
236
3Q12
277
Gross Revenue –Development
(R$ million)
1. Adjustment excluding capitalized interest for production financing
12
Capital Structure
(R$ million)
22%
Debentures
CRI
7%
Working Capital
2%
FINAME and Leasing
4%
SFH
65%
Loans and Financing – 3Q13
(% of Debt)
945
4Q12
450
793
3Q13
519
913
2Q13
500
Cash
Gross Debt343
Net Debt
22% 28% 24%
Net Debt / Shareholder's
Equity
12
445 394
Capital Structure
13
Disclosure
This presentation contains certain forward-looking statements concerning the business prospects,
projections of operating and financial results and growth potential of the Company, which are based on
management’s current expectations and estimates of the future performance of the Company. Although the
Company believes such forward-looking statements are based on reasonable assumptions, it can give no
assurance that its expectations will be achieved. Expectations and estimates that are based on the future
prospects of the Company are highly dependent upon market behavior, Brazil’s political and economic
situation, existing and future regulations of the industry and international markets and, therefore, are
subject to changes outside the Company’s and management’s control. The Company undertakes no
obligation to update any information contained herein or to revise any forward-looking statement as a result
of new information, future events or other information.
14
Contatos
Carlos Wollenweber
CFO | IR Officer
Paulo Sousa
IR Coordinator
Luiz Felipe Almeida
IR Analyst
www.direcional.com.b/ir
ir@direcional.com.br
(55 31) 3214-6200
(55 31) 3214-6450

3Q13 Disclosure and Results

  • 1.
    1 Earnings Release |Conference Call – 3Q13 November 12th, 2013
  • 2.
    2 Agenda Ricardo Ribeiro Vice President CarlosWollenweber CFO | IR Officer Operational Highlights Financial Highlights
  • 3.
    3 Highlights of 3Q13and 9M13  Cash Generation of R$ 68 million in 3Q13 and R$ 31 million in 9M13, with a growth in Net Revenues of 22% YoY  Record Launches of R$ 1.6 billion in 9M13, 80% in the segment MCMV Level 1 Record Sales of R$ 1.7 billion in 9M13 Reduction of 9% in total inventory in 9M13, with 51% growth in sales YoY  Financing pass-through to banks reached a record R$192 million in 3Q13 and R$455 million in 9M13, an increase of 41% and 43%, respectively, if compared whit the same period of 2012  Delivery of 6,332 units in 9M13, representing PSV of R$ 726 million ROE LTM of 18%
  • 4.
    4 Launches and NetSales  Focus on the MCMV Level 1, representing 80% of launches in the 9M13.  Best third quarter in sales and SoS 47%. 659 479 3Q13 642 504 138 2Q13 543 403 1,715 +51% +15% +18% 9M13 1,311 404 9M12 1,139 140 3Q12 558 400 158 Contracted Net Sales (PSV - R$ million) 15% 21% 15%15% 19% 47%50% 41% 55% 41% 3Q12 4Q12 3Q132Q131Q13 With MCMV Level 1 projectWithout MCMV Level 1 project Sales by Period of Launching - 3Q13 (% PSV - Ex-MCMV Level 1) 3Q13 63% 1H13 1% 2012 20% <2012 16% Sales-over-supply ratio (SoS) (% Total PSV) 33% <2012 35%32% 9M13 2012 3Q13 9M13 +44% 1,311 9M13 +75% +42% 1,646 400 143 335 9M12 1,157 659 497 3Q13 780 504 276 2Q13 446 403 44 3Q12 543 Launches (PSV - R$ million) Development MCMV Level 1 Development MCMV Level 1
  • 5.
    5 Inventory 8% 31% 2012 23% 2011 <2011 17% Finished Units2013 20% Midweast 18% North51% Southeast 31% 9M13 727 603 124 2012 800 670 130 -9% Finished Units Under Construction Inventory by Region (% PSV) Inventory by Launch Period (% PSV) Inventory Track Record (R$ million) 43% 18%Midweast North 40% Southeast 4Q12 3Q13  Reduction of 9% in total inventory in 9M13  Geographical diversification of the inventory.
  • 6.
    6 Deliveries Deliveries (PSV Launched -R$ million) Units 1,606 726 502 61 163 9M133Q132Q131Q13 Delivered PSV 718 4,008 6,332 MCMV Level 15% RET1 17% Low-Income 27% Medium 26% Upper-Middle 25%
  • 7.
    7 Carlos Wollenweber CFO |IR Officer Financial Highlights
  • 8.
    8 Cash Generation withGrowth (1/2) 1 - Cash Burn: measured by the change in net debt adjusted for dividend payments and shares buyback 2 – Numbers prior to 2012 are not adjusted in accordance with the new consolidation accounting practices (IFRS 11). 9M13 31 2012 -156 2011 -176 2010 -283 2009 -95 Cash Burn¹² - Anual (R$ million) Net Revenues - Track Record² (R$ million) +22% CAGR +57% 9M13 1,306 9M12 1,073 2012 1,450 2011 1,072 2010 782 2009 378 3Q13 68 2Q13 -7 1Q13 -30 Cash Generation (Cash Burn)¹ - Quarterly Basis (R$ million)
  • 9.
    9 Cash Generation withGrowth (2/2) 1 - Numbers prior to 2012 are not adjusted in accordance with the new consolidation accounting practices (IFRS 11). 15 45% 33% 24% 14% 4% 9M13 598 2012 457 2011¹ 269 2010¹ 117 2009¹ Revenue from Services % of Gross Revenue Revenue from Services – Track Record (R$ million) MCMV Level 1 83% Development 17% Breakdown of Deferred Results (9M13) Financing Pass-through (“Repasses”) (R$ million) +41% +43% 9M13 455 217 238 9M12 319 170 150 3Q13 192 89 103 153 71 82 4Q12 136 63 73 3Q12 136 79 56 2Q12 100 50 50 1Q12 83 40 43 2Q13 "Associativo" SFH 3Q13 2Q13 D Accounts Receivable BRL million 192 218 -26 Accounts Receivable from Finished Units BRL million 698 668 30
  • 10.
    10 Cancellation 18% Southeast North 65% Midweast 17% Cancellationby Region - 9M13 (% Contracted PSV ) Sales and Cancellation (“Distratos”) - Development (R$ million – PSV) 8%10%9%6% 28% 18% 33% 29% 19% 9M12 108 9% 3Q13 68 2Q13 57 3Q12 38 9M13 156 Cancellation % Cancellation over Sales - Development % Cancellation over Sales - Total Adjusted Gross Margin¹(%) 1. Adjustment excluding capitalized interest for production financing 27% 24% 29% 3Q132Q131Q13 North 31%Southeast 51% 18%Midweast Inventory by Region (% PSV) Midweast Southeast 40%North 18% 43% 4Q12 3Q13
  • 11.
    11 Revenue by Segment +21% +16% -3% 9M13 1,340 9M12 1,109 3Q13 465 2Q13 478 3Q12 402 GrossRevenue (R$ million) Adjusted¹ Gross Profit and Gross Margin (R$ million) 37 30.7% 3Q13 122 111 11 27.0% 2Q13 344 97 14 23.7% 3Q12 118 105 14 30.3% +4% +10% +3% 9M13 305 39 26.4% 9M12 330 293111 Gross Profit Interest capitalized in costs Adjusted Gross Margin¹ Net Income (R$ million) 2Q13 61 13.1% 3Q12 55 14.0% +17% +2% +14% 9M13 178 13.6% 9M12 152 14.2% 3Q13 62 13.8% Net Margin 242 326 598 206125 +84% +65% -15% 9M139M123Q132Q133Q12 Gross Revenue – MCMV Level 1 (R$ million) -5% -7% +10% 9M13 741 9M12 783 3Q13 259 2Q13 236 3Q12 277 Gross Revenue –Development (R$ million) 1. Adjustment excluding capitalized interest for production financing
  • 12.
    12 Capital Structure (R$ million) 22% Debentures CRI 7% WorkingCapital 2% FINAME and Leasing 4% SFH 65% Loans and Financing – 3Q13 (% of Debt) 945 4Q12 450 793 3Q13 519 913 2Q13 500 Cash Gross Debt343 Net Debt 22% 28% 24% Net Debt / Shareholder's Equity 12 445 394 Capital Structure
  • 13.
    13 Disclosure This presentation containscertain forward-looking statements concerning the business prospects, projections of operating and financial results and growth potential of the Company, which are based on management’s current expectations and estimates of the future performance of the Company. Although the Company believes such forward-looking statements are based on reasonable assumptions, it can give no assurance that its expectations will be achieved. Expectations and estimates that are based on the future prospects of the Company are highly dependent upon market behavior, Brazil’s political and economic situation, existing and future regulations of the industry and international markets and, therefore, are subject to changes outside the Company’s and management’s control. The Company undertakes no obligation to update any information contained herein or to revise any forward-looking statement as a result of new information, future events or other information.
  • 14.
    14 Contatos Carlos Wollenweber CFO |IR Officer Paulo Sousa IR Coordinator Luiz Felipe Almeida IR Analyst www.direcional.com.b/ir ir@direcional.com.br (55 31) 3214-6200 (55 31) 3214-6450