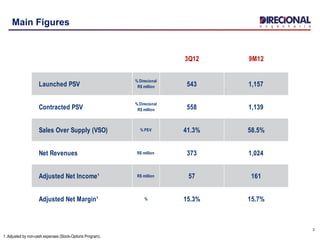
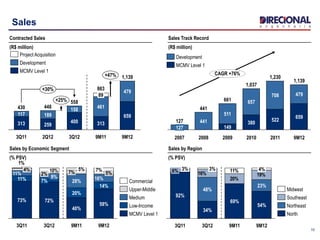
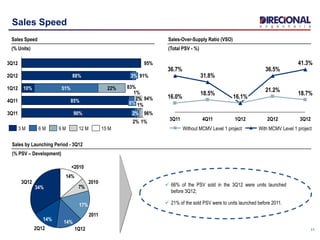
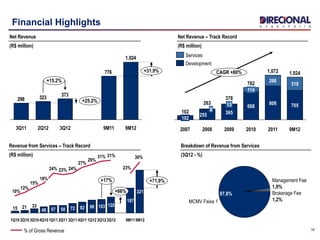
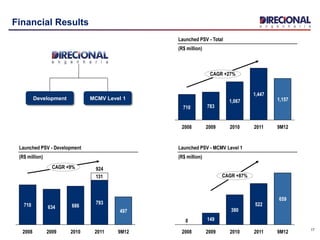
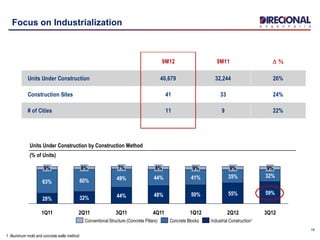
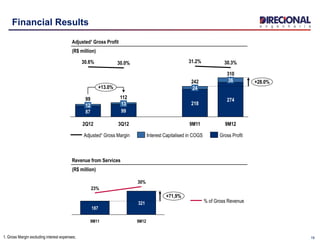
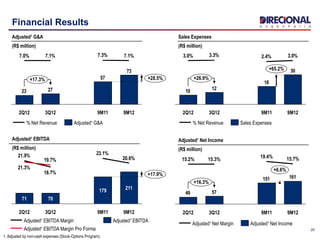
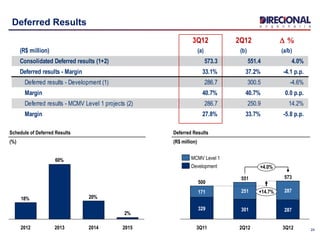
1
Earnings Release | Conference Call – 3Q12
November 6th, 2012
2
Agenda
Ricardo Ribeiro
Vice President
Carlos Wollenweber
CFO | IR Officer
3Q12 Main Figures and
Operating Highlights
Financial Highlights
3Q12 9M12
Launched PSV
% Direcional
R$ million 543 1,157
Contracted PSV
% Direcional
R$ million 558 1,139
Sales Over Supply (VSO) % PSV 41.3% 58.5%
Net Revenues R$ million 373 1,024
Adjusted Net Income¹ R$ million 57 161
Adjusted Net Margin¹ % 15.3% 15.7%
Main Figures
3
1. Adjusted by non-cash expenses (Stock-Options Program).
Contracted MCMV Level 1
4
3Q12
2012
MCMV
Level 1
• 6,398 Units Contracted
• PSV of R$ 400 MN
• 10,398 Units Contracted
• PSV of R$ 659 MN
• 26,661 Units Contracted
• PSV of R$ 1,562 MN
Signed Projects in 3Q12
Track Record – Contracted MCMV Level 1
(R$ million)
0
CAGR +87%
20102008
522
380
9M122011
659
149
2009
Increase in Price Cap versus INCC¹
(R$)
53,835 62,230
Current Price Cap
(National average)
Previous Price Cap
(National average)
+16%
INCC in the same
period
8,03%
City PSV
(R$ million)
Units
Macapá (AP) 135 2,218
Sobral (CE) 129 2,084
Maracanaú (CE) 136 2,096
1. Inflation index for the construction sector 2. A government program to the very low income segment, previous than MCMV
Deliveries During the 9M12
5
8,338
5,612
1,619
223
609
9M12
112
1,107
2Q12
832
210
1Q12 3Q12
510
223
287
Delivered PSV - Total
(R$ million)
MCMV Level 1
Development
# of Units
Launches versus Deliveries on Development Segment
6
Development – Launches versus Delivery
(9M12 - # units)
4,187
2,768
+51%
DeliveriesLaunches
PSV
R$ (million)
497 609+23%
7
Operating Highlights
 Launches
 Sales
 Deliveries
 Land Bank
 Inventory
Operating HighlightsRicardo Ribeiro
Vice President
Total
(R$'000)
% Direcional
(R$'000)
# of Units
Launched
Total Units
(All Phases)
1 Verano Residencial - 3rd
Phase July Belém - PA 21,147 21,125 92 539 Medium
2 Residencial Bella Toscana August Belo Horizonte - MG 42,481 21,241 78 78 Upper-Midle
3 Residencial Bella Verona August Belo Horizonte - MG 41,282 20,641 105 105 Upper-Midle
4 Del Rey - Comercial September Belo Horizonte - MG 99,614 79,691 342 671 Commercial
5 Residencial Macapaba - 2nd
Phase September Macapá - AP 134,958 134,958 2,218 4,366 MCMV Level 1
6 Orgulho Tropical September Sobral - CE 129,228 129,228 2,084 2,084 MCMV Level 1
7 Orgulho do Ceará 2 September Maracanaú - CE 136,240 136,240 2,096 2,096 MCMV Level 1
Total 3Q12 604,950 543,124 7,015 9,939
Segment3Q12 Projects Date City - State
PSV Units Launched
8
Launches
Launched PSV
(R$ million)
Launched PSV – Track Record
(R$ million)
131+44%
543+16%
1,157+30%
9M12
659
497
9M11
1,019
313
575
3Q12
400
143
2Q12
470
259
211
3Q11
377
313
63
1,447
522
CAGR +69%
9M12
1,157
659
497
2011
924
2010
1,067
380
686
2009
783
149
634
2008
710
710
2007
176
176
MCMV Level 1
Development
Project Acquisition
MCMV Level 1
Development
Launches Breakdown
9
PA
MG
15% 14%
11%
11%
9M12
57%
9%
9%
9M11
35%
22%
25%
5%
3Q12
74%
4%
8%
3Q11
83%
4%
13%
Launches by Segment
(% PSV)
MCMV Level 1
Low-Income
Medium
Upper Middle
Commercial
1
2 3 4
AP
CE
5
7
6
Launches by Region - Development
(% PSV)
100%
85%
41%
59%
12%
9M12
29%
9M11
50%
9%
3Q12
15%
3Q11
North
Northeast
Southeast
Midwest
Launches by Region - MCMV Level 1
(% PSV)
9M12
60%
40%
9M11
100%
3Q12
34%
66%
3Q11
100%
North
Northeast
Southeast
Midwest
Sales
Contracted Sales
(R$ million)
+30%
558+25%
1,139+47%
9M12
659
479
9M11
863
313
461
89
3Q12
400
158
2Q12
448
259
189
3Q11
430
313
117
MCMV Level 1
Development
Project Acquisition
10
10%
1%
9M12
58%
14%
16%
5%
7%
9M11
40%
20%
28%
7%
5%
3Q12
72%
7%
9%
2%
3Q11
73%
11%
11%
4%
MCMV Level 1
Low-Income
Medium
Upper-Middle
Commercial
Sales by Economic Segment
(% PSV)
Sales by Region
(% PSV)
20%
19%16% 11%
9M12
54%
23%
4%
9M11
69%
3Q12
34%
48%
3%
3Q11
92%
6% 3%
Northeast
Southeast
Midwest
North
CAGR +76%
9M12
1,139
659
479
2011
1,230
522
708
2010
1,037
380
657
2009
661
149
511
2008
441
441
2007
127
127
Sales Track Record
(R$ million)
MCMV Level 1
Development
11
Sales Speed
3Q12
41.3%
18.7%
2Q12
36.5%
21.2%
1Q12
16.1%16.1%
4Q11
31.8%
18.5%
3Q11
36.7%
16.0%
With MCMV Level 1 projectWithout MCMV Level 1 project
Sales-Over-Supply Ratio (VSO)
(Total PSV - %)
90%3Q11 96%2%
2%
1%
1%
4Q11 94%85% 6%
1%
2%
1Q12 83%10% 51% 22%
2Q12 91%88% 3%
3Q12 95%
3 M 6 M 9 M 12 M 15 M
7%
14%
3Q12
34%
2Q12
14%
1Q12
14%
2011
17%
2010
<2010
Sales by Launching Period - 3Q12
(% PSV – Development)
Sales Speed
(% Units)
 66% of the PSV sold in the 3Q12 were units launched
before 3Q12;
 21% of the sold PSV were to units launched before 2011.
TotalVile Marabá2nd Phase
AP(PSV R$ 30.4MM)
ParqueVerde
AM(PSV R$ 31.3MM)
Weekend Club
AM(PSV R$ 54.9MM)
Brisasdo Madeira
RO (PSV R$62.9MM)
VitaBella ResidencialClub
RO (PSV R$59.7MM)
Gran Ventura
MG (PSV R$ 47.5MM)
Total
(R$'000)
% Direcional
(R$'000)
1 Gran Ventura July Belo Horizonte - MG 48,446 47,526 199 Medium
2 Vita Bella Residencial Club July Porto Velho - RO 59,733 59,733 352 Low-Income
3 Brisas do Madeira - Towers: 1, 2, 4 and 6 July Porto Velho - RO 62,940 62,940 284 Medium
4 Weekend Club - Towers: A and E August Manaus - AM 68,570 54,856 178 Medium
5 Parque Verde August Manaus - AM 31,373 31,342 192 Low-Income
6 Total Ville Marabá - 2nd
Phase August Marabá - PA 30,445 30,442 256 Low-Income
7 Residencial Meu Orgulho - 1st
Phase August Manaus - AM 190,598 190,598 3,511 MCMV Level 1
8 Bairro Carioca - Plots: 1, 2 e 3 August Rio de Janeiro - RJ 32,640 32,640 640 MCMV Level 1
Total 3Q12 524,745 510,077 5,612
# Units SegmentDelivered Projects - 3Q12 Date City - State
PSV
12
Delivered Projects - 3Q12
13
Land Bank
 59.3% are large scale projects (over 1,000 units)
 74.9% are eligible for the MCMV Program
 75.1% were acquired by physical or financial Swap
 Average acquisition price of 9.1% over PSV
R$ 6.8 Billion
66,559 units
Land Bank by Segment
(% PSV)
100269
6,820 -128
9M12Launches
497
Review of
Assumptions
Acquired
Land Bank
2011
6,948
Land Bank by Region
(% PSV)
Type of Payment
(9M12 – % PSV)
ES
1.5%
AM
13.6%
MG
38.2%
RO
4.6%
SP
5.6%
PA
13.2%
DF
20.6%GO
1.6%
Swap
83.6% Cash16.4%
55%
Low-Income
Medium
7%
Upper-Midle
35%
Commercial3%
RJ
1.1%
Land Bank Track Record in 9M12
(R$ million in PSV)
14
Inventory
 63% of the inventory was launched after 2011
 94% of the units under construction have already been sold
11%
3Q12
2Q12
15%
1Q12 4%
2011
33%
2010
14%
<20109%
Finished Units
14%
12%Midwest
Southeast 27%
North 61%
Inventory by Region
( % PSV)
Aging
(% PSV)
Total % Direcional
Under Construction 748,430 638,974 86.0% 2,595 84.2%
Finished Units 115,089 103,699 14.0% 488 15.8%
Total 863,519 742,673 100.0% 3,083 100.0%
Inventory
PSV in Inventory (BRL'000)
% # of Units %
15
Financial Highlights
 Financial Highlights
 Cash Burn and Financing Transfers (“Repasse”)
 Capital Structure
 Deferred Results
 Stock Performance
Financial HighlightsCarlos Wollenweber
CFO | IR Officer
16
Financial Highlights
1,024
776
373
323298
+31.9%
+25.2%
+15.2%
9M129M113Q122Q123Q11
Net Revenue
(R$ million)
332115 103
31%
1Q12
98
29%
4Q11
82
27%
3Q11
72
24%
2Q11
58
23%
1Q11
57
24%
4Q10
48
18%
3Q10
15%
+17%
+66%
+71,9%
9M12
321
30%
9M11
187
23%
3Q12
120
31%
2Q122Q10
12%
1Q10
10%
MCMV Faixa 1
97,8% Brokerage Fee
1,2%
Management Fee
1,0%
Breakdown of Revenue from Services
(3Q12 - %)
% of Gross Revenue
2011
1,072
806
266
2010
782
668
114
2009
378
365
13
2008
263
255
8
2007
102
102
CAGR +80%
9M12
1,024
705
318
Net Revenue – Track Record
(R$ million)
Development
Services
Revenue from Services – Track Record
(R$ million)
17
Launched PSV - Total
(R$ million)
CAGR +27%
9M12
1,157
2011
1,447
2010
1,067
2009
783
2008
710
Launched PSV - MCMV Level 1
(R$ million)
131
CAGR +9%
9M12
497
2011
924
793
2010
686
2009
634
2008
710
Launched PSV - Development
(R$ million)
0
CAGR +87%
9M12
659
2011
522
2010
380
2009
149
2008
Development MCMV Level 1
Financial Results
9M12 9M11 D %
Units Under Construction 40,679 32,244 26%
Construction Sites 41 33 24%
# of Cities 11 9 22%
18
3Q12
59%
32%
9%
2Q12
55%
35%
9%
1Q12
50%
41%
9%
4Q11
48%
44%
8%
3Q11
44%
49%
7%
2Q11
32%
60%
8%
1Q11
28%
63%
9%
Focus on Industrialization
Units Under Construction by Construction Method
(% of Units)
1 Aluminum mold and concrete walls method
Industrial Construction¹Concrete BlocksConventional Structure (Concrete Pillars)
191. Gross Margin excluding interest expenses;
310
+28.0%
9M12
274
36
30.3%
9M11
242
218
24
31.2%
3Q12
112
99
13
30.0%
2Q12
99
87
12
30.6%
+13.0%
Gross ProfitInterest Capitalised in COGSAdjusted¹ Gross Margin
Financial Results
Adjusted¹ Gross Profit
(R$ million)
Revenue from Services
(R$ million)
+71,9%
9M12
321
30%
9M11
187
23%
% of Gross Revenue
20
Financial Results
1. Adjusted by non-cash expenses (Stock-Options Program).
Adjusted¹ G&A
(R$ million)
Sales Expenses
(R$ million)
73
57
2723
7.1%7.3%7.1%7.0%
9M113Q122Q12
+17.3% +28.5%
9M12
30
18
1210
3.0%2.4%3.3%3.0%
3Q122Q12
+26.9%
+65.2%
9M129M11
Sales Expenses% Net RevenueAdjusted¹ G&A% Net Revenue
Adjusted¹ EBITDA
(R$ million)
161151
5749
+6.6%
9M12
15.7%
9M11
19.4%
3Q12
15.3%
2Q12
+16.3%
15.2%
Adjusted¹ Net Income
(R$ million)
Adjusted¹ Net IncomeAdjusted¹ Net Margin
20.6%
23.1%
18.7%
21.9%
19.7%
21.3%
179
9M11
+17.9%
9M12
211
3Q12
70
2Q12
71
Adjusted¹ EBITDA Margin Pro Forma
Adjusted¹ EBITDA Margin Adjusted¹ EBITDA
Cash Burn and Financing Transfer (“Repasse”)
21
Cash Burn Track Record
(R$ million)
9M12
-39
163
3Q12
-24
43
2Q12
18
50
1Q12
-33
70
Net of Accounts Receivable from Delivered Units Variation
Cash Burn
Financing Transfers (“Repasses”) Track Record
(R$ million)
319
+48%
+36%
+21%
9M12
170
149216
78
138
3Q12
136
79
56
2Q12
100
50
50
1Q12
83
40
43
9M11
"Crédito Associativo"¹
SFH
1. The financing transfer happens during the construction period
Net Debt Adjusted By Receivables From Delivered Projects
22
Net Debt
(R$ million – 3Q12)
Net Debt Adjusted By
Receivables from
Delivered Unitsits
Total Debt
787
Net Debt
443
Receivables from
Delivered Units
117
460
Cash and Equivalents
326
3Q12 2Q12 D %
(R$ million) (a) (b) (a/b)
Debt 786.5 626.2 25.6%
SFH 606.2 516.9 17.3%
CRI 101.2 - n/a
Securitization 6.1 25.6 -76.3%
Receivables Assigned 36.8 49.3 -25.4%
Working Capital 20.0 20.5 -2.4%
FINAME and others 16.2 13.8 16.7%
Cash 460.0 342.3 34.4%
Net debt 326.5 283.9 15.0%
Net debt / Equity 23.4% 21.3% 2 p.p.
23
Capital Structure
Debt Breakdown
5.4%
Other
Receivables Assigned4.7%
CRI
12.9%SFH
77.1%
3Q12 2Q12 D %
(R$ million) (a) (b) (a/b)
Consolidated Deferred results (1+2) 573.3 551.4 4.0%
Deferred results - Margin 33.1% 37.2% -4.1 p.p.
Deferred results - Development (1) 286.7 300.5 -4.6%
Margin 40.7% 40.7% 0.0 p.p.
Deferred results - MCMV Level 1 projects (2) 286.7 250.9 14.2%
Margin 27.8% 33.7% -5.8 p.p.
24
Deferred Results
Schedule of Deferred Results
(%)
2%
20%
60%
18%
2015201420132012
+14.7%
+4.0%
3Q12
573
287
287
2Q12
551
301
251
3Q11
500
329
171
Development
MCMV Level 1
Deferred Results
(R$ million)
25
Improvement on DIRR3 Float
Number of Investors
(#)
652+22%
09.30.2012
283
369
06.30.2012
531
214
317
03.31.2012
533
217
316
Investment Funds
Personal Investors
2,799
1Q12
+97%
3Q12
1,193
2Q12
1,419
+135%
Average Trading Volume
(R$ 000)
272
143
122
+89%
+123%
3Q122Q121Q12
Average Trading Volume
(# of Transactions)
7
8
9
10
11
12
13
2-Jan-12
6-Jan-12
12-Jan-12
18-Jan-12
24-Jan-12
31-Jan-12
6-Feb-12
10-Feb-12
16-Feb-12
24-Feb-12
1-Mar-12
7-Mar-12
13-Mar-12
19-Mar-12
23-Mar-12
29-Mar-12
4-Apr-12
11-Apr-12
17-Apr-12
23-Apr-12
27-Apr-12
4-May-12
10-May-12
16-May-12
22-May-12
28-May-12
1-Jun-12
8-Jun-12
14-Jun-12
20-Jun-12
26-Jun-12
2-Jul-12
6-Jul-12
13-Jul-12
19-Jul-12
25-Jul-12
31-Jul-12
6-Aug-12
10-Aug-12
16-Aug-12
22-Aug-12
28-Aug-12
3-Sep-12
10-Sep-12
14-Sep-12
20-Sep-12
26-Sep-12
2-Oct-12
8-Oct-12
15-Oct-12
19-Oct-12
25-Oct-12
StockPrice
Volume (R$) Direcional
R$ 12,25
26
Shares Performance
27
Disclosure
This presentation contains certain forward-looking statements concerning the business prospects,
projections of operating and financial results and growth potential of the Company, which are based on
management’s current expectations and estimates of the future performance of the Company. Although the
Company believes such forward-looking statements are based on reasonable assumptions, it can give no
assurance that its expectations will be achieved. Expectations and estimates that are based on the future
prospects of the Company are highly dependent upon market behavior, Brazil’s political and economic
situation, existing and future regulations of the industry and international markets and, therefore, are
subject to changes outside the Company’s and management’s control. The Company undertakes no
obligation to update any information contained herein or to revise any forward-looking statement as a result
of new information, future events or other information.
28
Contacts
Carlos Wollenweber
CFO | IR Officer
Paulo Sousa
IR Analyst
Cristiano Faria
IR Analyst
www.direcional.com.b/ir
ri@direcional.com.br
(55 31) 3214-6200
(55 31) 3214-6450

3Q12 Disclosure and Results

  • 1.
    1 Earnings Release |Conference Call – 3Q12 November 6th, 2012
  • 2.
    2 Agenda Ricardo Ribeiro Vice President CarlosWollenweber CFO | IR Officer 3Q12 Main Figures and Operating Highlights Financial Highlights
  • 3.
    3Q12 9M12 Launched PSV %Direcional R$ million 543 1,157 Contracted PSV % Direcional R$ million 558 1,139 Sales Over Supply (VSO) % PSV 41.3% 58.5% Net Revenues R$ million 373 1,024 Adjusted Net Income¹ R$ million 57 161 Adjusted Net Margin¹ % 15.3% 15.7% Main Figures 3 1. Adjusted by non-cash expenses (Stock-Options Program).
  • 4.
    Contracted MCMV Level1 4 3Q12 2012 MCMV Level 1 • 6,398 Units Contracted • PSV of R$ 400 MN • 10,398 Units Contracted • PSV of R$ 659 MN • 26,661 Units Contracted • PSV of R$ 1,562 MN Signed Projects in 3Q12 Track Record – Contracted MCMV Level 1 (R$ million) 0 CAGR +87% 20102008 522 380 9M122011 659 149 2009 Increase in Price Cap versus INCC¹ (R$) 53,835 62,230 Current Price Cap (National average) Previous Price Cap (National average) +16% INCC in the same period 8,03% City PSV (R$ million) Units Macapá (AP) 135 2,218 Sobral (CE) 129 2,084 Maracanaú (CE) 136 2,096 1. Inflation index for the construction sector 2. A government program to the very low income segment, previous than MCMV
  • 5.
    Deliveries During the9M12 5 8,338 5,612 1,619 223 609 9M12 112 1,107 2Q12 832 210 1Q12 3Q12 510 223 287 Delivered PSV - Total (R$ million) MCMV Level 1 Development # of Units
  • 6.
    Launches versus Deliverieson Development Segment 6 Development – Launches versus Delivery (9M12 - # units) 4,187 2,768 +51% DeliveriesLaunches PSV R$ (million) 497 609+23%
  • 7.
    7 Operating Highlights  Launches Sales  Deliveries  Land Bank  Inventory Operating HighlightsRicardo Ribeiro Vice President
  • 8.
    Total (R$'000) % Direcional (R$'000) # ofUnits Launched Total Units (All Phases) 1 Verano Residencial - 3rd Phase July Belém - PA 21,147 21,125 92 539 Medium 2 Residencial Bella Toscana August Belo Horizonte - MG 42,481 21,241 78 78 Upper-Midle 3 Residencial Bella Verona August Belo Horizonte - MG 41,282 20,641 105 105 Upper-Midle 4 Del Rey - Comercial September Belo Horizonte - MG 99,614 79,691 342 671 Commercial 5 Residencial Macapaba - 2nd Phase September Macapá - AP 134,958 134,958 2,218 4,366 MCMV Level 1 6 Orgulho Tropical September Sobral - CE 129,228 129,228 2,084 2,084 MCMV Level 1 7 Orgulho do Ceará 2 September Maracanaú - CE 136,240 136,240 2,096 2,096 MCMV Level 1 Total 3Q12 604,950 543,124 7,015 9,939 Segment3Q12 Projects Date City - State PSV Units Launched 8 Launches Launched PSV (R$ million) Launched PSV – Track Record (R$ million) 131+44% 543+16% 1,157+30% 9M12 659 497 9M11 1,019 313 575 3Q12 400 143 2Q12 470 259 211 3Q11 377 313 63 1,447 522 CAGR +69% 9M12 1,157 659 497 2011 924 2010 1,067 380 686 2009 783 149 634 2008 710 710 2007 176 176 MCMV Level 1 Development Project Acquisition MCMV Level 1 Development
  • 9.
    Launches Breakdown 9 PA MG 15% 14% 11% 11% 9M12 57% 9% 9% 9M11 35% 22% 25% 5% 3Q12 74% 4% 8% 3Q11 83% 4% 13% Launchesby Segment (% PSV) MCMV Level 1 Low-Income Medium Upper Middle Commercial 1 2 3 4 AP CE 5 7 6 Launches by Region - Development (% PSV) 100% 85% 41% 59% 12% 9M12 29% 9M11 50% 9% 3Q12 15% 3Q11 North Northeast Southeast Midwest Launches by Region - MCMV Level 1 (% PSV) 9M12 60% 40% 9M11 100% 3Q12 34% 66% 3Q11 100% North Northeast Southeast Midwest
  • 10.
    Sales Contracted Sales (R$ million) +30% 558+25% 1,139+47% 9M12 659 479 9M11 863 313 461 89 3Q12 400 158 2Q12 448 259 189 3Q11 430 313 117 MCMVLevel 1 Development Project Acquisition 10 10% 1% 9M12 58% 14% 16% 5% 7% 9M11 40% 20% 28% 7% 5% 3Q12 72% 7% 9% 2% 3Q11 73% 11% 11% 4% MCMV Level 1 Low-Income Medium Upper-Middle Commercial Sales by Economic Segment (% PSV) Sales by Region (% PSV) 20% 19%16% 11% 9M12 54% 23% 4% 9M11 69% 3Q12 34% 48% 3% 3Q11 92% 6% 3% Northeast Southeast Midwest North CAGR +76% 9M12 1,139 659 479 2011 1,230 522 708 2010 1,037 380 657 2009 661 149 511 2008 441 441 2007 127 127 Sales Track Record (R$ million) MCMV Level 1 Development
  • 11.
    11 Sales Speed 3Q12 41.3% 18.7% 2Q12 36.5% 21.2% 1Q12 16.1%16.1% 4Q11 31.8% 18.5% 3Q11 36.7% 16.0% With MCMVLevel 1 projectWithout MCMV Level 1 project Sales-Over-Supply Ratio (VSO) (Total PSV - %) 90%3Q11 96%2% 2% 1% 1% 4Q11 94%85% 6% 1% 2% 1Q12 83%10% 51% 22% 2Q12 91%88% 3% 3Q12 95% 3 M 6 M 9 M 12 M 15 M 7% 14% 3Q12 34% 2Q12 14% 1Q12 14% 2011 17% 2010 <2010 Sales by Launching Period - 3Q12 (% PSV – Development) Sales Speed (% Units)  66% of the PSV sold in the 3Q12 were units launched before 3Q12;  21% of the sold PSV were to units launched before 2011.
  • 12.
    TotalVile Marabá2nd Phase AP(PSVR$ 30.4MM) ParqueVerde AM(PSV R$ 31.3MM) Weekend Club AM(PSV R$ 54.9MM) Brisasdo Madeira RO (PSV R$62.9MM) VitaBella ResidencialClub RO (PSV R$59.7MM) Gran Ventura MG (PSV R$ 47.5MM) Total (R$'000) % Direcional (R$'000) 1 Gran Ventura July Belo Horizonte - MG 48,446 47,526 199 Medium 2 Vita Bella Residencial Club July Porto Velho - RO 59,733 59,733 352 Low-Income 3 Brisas do Madeira - Towers: 1, 2, 4 and 6 July Porto Velho - RO 62,940 62,940 284 Medium 4 Weekend Club - Towers: A and E August Manaus - AM 68,570 54,856 178 Medium 5 Parque Verde August Manaus - AM 31,373 31,342 192 Low-Income 6 Total Ville Marabá - 2nd Phase August Marabá - PA 30,445 30,442 256 Low-Income 7 Residencial Meu Orgulho - 1st Phase August Manaus - AM 190,598 190,598 3,511 MCMV Level 1 8 Bairro Carioca - Plots: 1, 2 e 3 August Rio de Janeiro - RJ 32,640 32,640 640 MCMV Level 1 Total 3Q12 524,745 510,077 5,612 # Units SegmentDelivered Projects - 3Q12 Date City - State PSV 12 Delivered Projects - 3Q12
  • 13.
    13 Land Bank  59.3%are large scale projects (over 1,000 units)  74.9% are eligible for the MCMV Program  75.1% were acquired by physical or financial Swap  Average acquisition price of 9.1% over PSV R$ 6.8 Billion 66,559 units Land Bank by Segment (% PSV) 100269 6,820 -128 9M12Launches 497 Review of Assumptions Acquired Land Bank 2011 6,948 Land Bank by Region (% PSV) Type of Payment (9M12 – % PSV) ES 1.5% AM 13.6% MG 38.2% RO 4.6% SP 5.6% PA 13.2% DF 20.6%GO 1.6% Swap 83.6% Cash16.4% 55% Low-Income Medium 7% Upper-Midle 35% Commercial3% RJ 1.1% Land Bank Track Record in 9M12 (R$ million in PSV)
  • 14.
    14 Inventory  63% ofthe inventory was launched after 2011  94% of the units under construction have already been sold 11% 3Q12 2Q12 15% 1Q12 4% 2011 33% 2010 14% <20109% Finished Units 14% 12%Midwest Southeast 27% North 61% Inventory by Region ( % PSV) Aging (% PSV) Total % Direcional Under Construction 748,430 638,974 86.0% 2,595 84.2% Finished Units 115,089 103,699 14.0% 488 15.8% Total 863,519 742,673 100.0% 3,083 100.0% Inventory PSV in Inventory (BRL'000) % # of Units %
  • 15.
    15 Financial Highlights  FinancialHighlights  Cash Burn and Financing Transfers (“Repasse”)  Capital Structure  Deferred Results  Stock Performance Financial HighlightsCarlos Wollenweber CFO | IR Officer
  • 16.
    16 Financial Highlights 1,024 776 373 323298 +31.9% +25.2% +15.2% 9M129M113Q122Q123Q11 Net Revenue (R$million) 332115 103 31% 1Q12 98 29% 4Q11 82 27% 3Q11 72 24% 2Q11 58 23% 1Q11 57 24% 4Q10 48 18% 3Q10 15% +17% +66% +71,9% 9M12 321 30% 9M11 187 23% 3Q12 120 31% 2Q122Q10 12% 1Q10 10% MCMV Faixa 1 97,8% Brokerage Fee 1,2% Management Fee 1,0% Breakdown of Revenue from Services (3Q12 - %) % of Gross Revenue 2011 1,072 806 266 2010 782 668 114 2009 378 365 13 2008 263 255 8 2007 102 102 CAGR +80% 9M12 1,024 705 318 Net Revenue – Track Record (R$ million) Development Services Revenue from Services – Track Record (R$ million)
  • 17.
    17 Launched PSV -Total (R$ million) CAGR +27% 9M12 1,157 2011 1,447 2010 1,067 2009 783 2008 710 Launched PSV - MCMV Level 1 (R$ million) 131 CAGR +9% 9M12 497 2011 924 793 2010 686 2009 634 2008 710 Launched PSV - Development (R$ million) 0 CAGR +87% 9M12 659 2011 522 2010 380 2009 149 2008 Development MCMV Level 1 Financial Results
  • 18.
    9M12 9M11 D% Units Under Construction 40,679 32,244 26% Construction Sites 41 33 24% # of Cities 11 9 22% 18 3Q12 59% 32% 9% 2Q12 55% 35% 9% 1Q12 50% 41% 9% 4Q11 48% 44% 8% 3Q11 44% 49% 7% 2Q11 32% 60% 8% 1Q11 28% 63% 9% Focus on Industrialization Units Under Construction by Construction Method (% of Units) 1 Aluminum mold and concrete walls method Industrial Construction¹Concrete BlocksConventional Structure (Concrete Pillars)
  • 19.
    191. Gross Marginexcluding interest expenses; 310 +28.0% 9M12 274 36 30.3% 9M11 242 218 24 31.2% 3Q12 112 99 13 30.0% 2Q12 99 87 12 30.6% +13.0% Gross ProfitInterest Capitalised in COGSAdjusted¹ Gross Margin Financial Results Adjusted¹ Gross Profit (R$ million) Revenue from Services (R$ million) +71,9% 9M12 321 30% 9M11 187 23% % of Gross Revenue
  • 20.
    20 Financial Results 1. Adjustedby non-cash expenses (Stock-Options Program). Adjusted¹ G&A (R$ million) Sales Expenses (R$ million) 73 57 2723 7.1%7.3%7.1%7.0% 9M113Q122Q12 +17.3% +28.5% 9M12 30 18 1210 3.0%2.4%3.3%3.0% 3Q122Q12 +26.9% +65.2% 9M129M11 Sales Expenses% Net RevenueAdjusted¹ G&A% Net Revenue Adjusted¹ EBITDA (R$ million) 161151 5749 +6.6% 9M12 15.7% 9M11 19.4% 3Q12 15.3% 2Q12 +16.3% 15.2% Adjusted¹ Net Income (R$ million) Adjusted¹ Net IncomeAdjusted¹ Net Margin 20.6% 23.1% 18.7% 21.9% 19.7% 21.3% 179 9M11 +17.9% 9M12 211 3Q12 70 2Q12 71 Adjusted¹ EBITDA Margin Pro Forma Adjusted¹ EBITDA Margin Adjusted¹ EBITDA
  • 21.
    Cash Burn andFinancing Transfer (“Repasse”) 21 Cash Burn Track Record (R$ million) 9M12 -39 163 3Q12 -24 43 2Q12 18 50 1Q12 -33 70 Net of Accounts Receivable from Delivered Units Variation Cash Burn Financing Transfers (“Repasses”) Track Record (R$ million) 319 +48% +36% +21% 9M12 170 149216 78 138 3Q12 136 79 56 2Q12 100 50 50 1Q12 83 40 43 9M11 "Crédito Associativo"¹ SFH 1. The financing transfer happens during the construction period
  • 22.
    Net Debt AdjustedBy Receivables From Delivered Projects 22 Net Debt (R$ million – 3Q12) Net Debt Adjusted By Receivables from Delivered Unitsits Total Debt 787 Net Debt 443 Receivables from Delivered Units 117 460 Cash and Equivalents 326
  • 23.
    3Q12 2Q12 D% (R$ million) (a) (b) (a/b) Debt 786.5 626.2 25.6% SFH 606.2 516.9 17.3% CRI 101.2 - n/a Securitization 6.1 25.6 -76.3% Receivables Assigned 36.8 49.3 -25.4% Working Capital 20.0 20.5 -2.4% FINAME and others 16.2 13.8 16.7% Cash 460.0 342.3 34.4% Net debt 326.5 283.9 15.0% Net debt / Equity 23.4% 21.3% 2 p.p. 23 Capital Structure Debt Breakdown 5.4% Other Receivables Assigned4.7% CRI 12.9%SFH 77.1%
  • 24.
    3Q12 2Q12 D% (R$ million) (a) (b) (a/b) Consolidated Deferred results (1+2) 573.3 551.4 4.0% Deferred results - Margin 33.1% 37.2% -4.1 p.p. Deferred results - Development (1) 286.7 300.5 -4.6% Margin 40.7% 40.7% 0.0 p.p. Deferred results - MCMV Level 1 projects (2) 286.7 250.9 14.2% Margin 27.8% 33.7% -5.8 p.p. 24 Deferred Results Schedule of Deferred Results (%) 2% 20% 60% 18% 2015201420132012 +14.7% +4.0% 3Q12 573 287 287 2Q12 551 301 251 3Q11 500 329 171 Development MCMV Level 1 Deferred Results (R$ million)
  • 25.
    25 Improvement on DIRR3Float Number of Investors (#) 652+22% 09.30.2012 283 369 06.30.2012 531 214 317 03.31.2012 533 217 316 Investment Funds Personal Investors 2,799 1Q12 +97% 3Q12 1,193 2Q12 1,419 +135% Average Trading Volume (R$ 000) 272 143 122 +89% +123% 3Q122Q121Q12 Average Trading Volume (# of Transactions)
  • 26.
  • 27.
    27 Disclosure This presentation containscertain forward-looking statements concerning the business prospects, projections of operating and financial results and growth potential of the Company, which are based on management’s current expectations and estimates of the future performance of the Company. Although the Company believes such forward-looking statements are based on reasonable assumptions, it can give no assurance that its expectations will be achieved. Expectations and estimates that are based on the future prospects of the Company are highly dependent upon market behavior, Brazil’s political and economic situation, existing and future regulations of the industry and international markets and, therefore, are subject to changes outside the Company’s and management’s control. The Company undertakes no obligation to update any information contained herein or to revise any forward-looking statement as a result of new information, future events or other information.
  • 28.
    28 Contacts Carlos Wollenweber CFO |IR Officer Paulo Sousa IR Analyst Cristiano Faria IR Analyst www.direcional.com.b/ir ri@direcional.com.br (55 31) 3214-6200 (55 31) 3214-6450