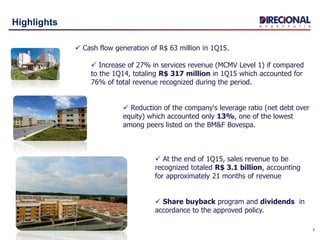
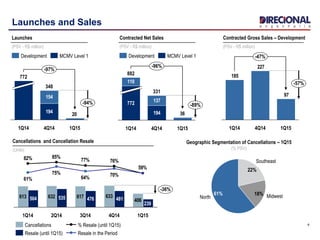
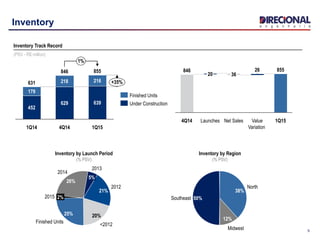
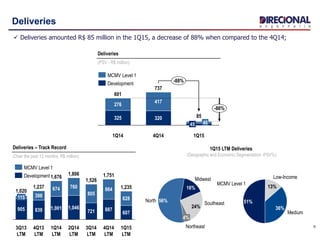
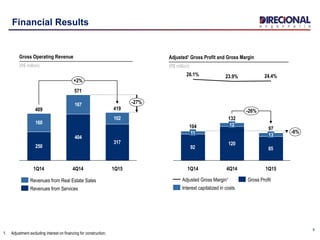
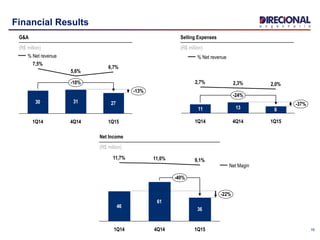
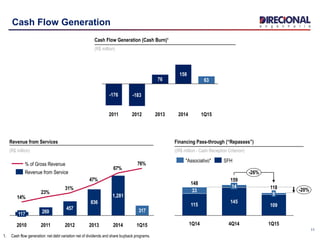
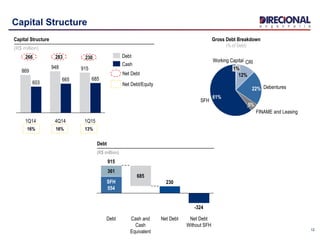
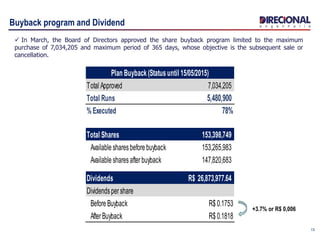
1
Earnings Release | Conference Call – 1Q15
May 18th, 2015
2
Agenda
Ricardo Ribeiro
Vice President
Fernando Ramos
CFO and IR Officer
Operational Highlights
Financial Highlights
3
Highlights
 Cash flow generation of R$ 63 million in 1Q15.
 Increase of 27% in services revenue (MCMV Level 1) if compared
to the 1Q14, totaling R$ 317 million in 1Q15 which accounted for
76% of total revenue recognized during the period.
 Reduction of the company's leverage ratio (net debt over
equity) which accounted only 13%, one of the lowest
among peers listed on the BM&F Bovespa.
 At the end of 1Q15, sales revenue to be
recognized totaled R$ 3.1 billion, accounting
for approximately 21 months of revenue
 Share buyback program and dividends in
accordance to the approved policy.
4
Launches and Sales
Contracted Net Sales
(PSV - R$ million)
110
137
194 36
331
4Q141Q14
772
1Q15
-89%
-96%
882
Development MCMV Level 1
61% Midwest
22%
North
18%
Southeast
Geographic Segmentation of Cancellations – 1Q15
(% PSV)
Cancellations and Cancellation Resale
(Units)
613 632 617 633
406504 535 476 481
239
59%
76%77%
85%82%
70%64%
75%
61%
59%
4Q141Q14 2Q14 3Q14 1Q15
-36%
Resale (until 1Q15) Resale in the Period
% Resale (until 1Q15)Cancellations
Contracted Gross Sales – Development
(PSV - R$ million)
97
227
185
4Q14 1Q15
-47%
1Q14
-57%
Launches
(PSV - R$ million)
194
154
20
4Q14
772
1Q14
-94%
348
-97%
1Q15
Development MCMV Level 1
5
Inventory
Inventory Track Record
(PSV - R$ million)
20%
2012
<2012
Finished Units
25%
2%2015
2014
26%
5%
21%
2013
Inventory by Launch Period
(% PSV)
855
1%
+35%
1Q14
631
452
179
218
629
846
4Q14
639
216
1Q15
Finished Units
Under Construction
38%
North
12%
Southeast 50%
Midwest
Inventory by Region
(% PSV)
846
20
Launches
36
26
Net Sales 1Q15
855
Value
Variation
4Q14
6
Deliveries
MCMV Level 1
51%
Medium
36%
Low-Income
13%
1Q15 LTM Deliveries
(Geographic and Economic Segmentation -PSV%)
Northeast
4%
Southeast
24%
Midwest
16%
North 56%
1Q15
LTM
1,046
2Q14
LTM
1,806
805
1Q14
LTM
721
4Q13
LTM
1,676
1,001
3Q13
LTM
839
398
1,020
1,237
905
674 760
1,526
3Q14
LTM
864
4Q14
LTM
607
1,751
628
1,235
887
115
Deliveries – Track Record
(Over the past 12 months: R$ million)
MCMV Level 1
Development
Deliveries
(PSV - R$ million)
-86%
85320
-88%
737
1Q15
45
4Q14
601
325
417
276
1Q14
40
MCMV Level 1
Development
 Deliveries amounted R$ 85 million in the 1Q15, a decrease of 88% when compared to the 4Q14;
Low-Income Segment
7
Consistent track record in the Low-Income segment(2007-14):
 # of projects/phases : 43
# Units : 16,584
Total PSV : R$ 1,370.3 million
Average PSV : R$ 31.9 million
Average Units : 386
+16.3%
1Q14
2,565
1Q15
2,983
1Q15
20
2014
119
2013
11
2012
108
2011
210
2010
303
2009
358
2008
184
2007
58
Low-Income Segment
20082007 1Q152014
1,198
2013
2,041
2012
1,647
2011
522
2010
380
2009
154
MCMV Level 1
Launches
(PSV - R$ million)
 The VSO of Low-Income projects launched
in 2014 was 80%, greatly superior to the
Company's consolidated ratio, which, excluding
Level 1 projects, was 45%.
 Industrial construction method, with
aluminum structures and concrete walls, thus
the development may be delivered in an
estimated period from 15 to 18 months.
 “Associativo” financing model, according
to which customers are transferred to banks
when the sale is carried out, which significantly
reduces the risk of a sale being canceled.
Landbank - Low-Income
(PSV - R$ million)
8
Fernando Ramos
CFO and IR Officer
Financial Highlights
9
Financial Results
1. Adjustment excluding interest on financing for construction;
250
404
317
160
167
102
4Q14
571
1Q14
409 419
-27%
+2%
1Q15
Gross Operating Revenue
(R$ million)
Revenues from Services
Revenues from Real Estate Sales
Adjusted¹ Gross Profit and Gross Margin
(R$ million)
92
120
85
12
23.9%
1Q14
104
11
26.1%
13
1Q15
-6%
132
4Q14
24.4%
-26%
97
Gross ProfitAdjusted Gross Margin¹
Interest capitalized in costs
1010
G&A
(R$ million)
30 31 27
-13%
-10%
1Q15
6,7%
4Q14
5,6%
1Q14
7,5%
% Net revenue
Selling Expenses
(R$ million)
13 811
-24%
1Q15
2,0%
4Q14
2,3%
1Q14
2,7%
-37%
% Net revenue
Net Income
(R$ million)
46
61
36
-22%
11,0%
1Q14
11,7%
-40%
1Q15
9,1%
4Q14
Net Magin
Financial Results
11
Cash Flow Generation
1. Cash flow generation: net debt variation net of dividends and share buyback programs.
457
836
317269
76%
67%
47%
31%
23%
14%
1Q152014
1,281
2013201220112010
117
Revenue from Service
% of Gross Revenue
Revenue from Services
(R$ million)
Financing Pass-through (“Repasses”)
((R$ million - Cash Reception Criterion)
118 -20%
-26%
1Q15
109
9
4Q14
159
145
14
1Q14
148
115
33
SFH"Associativo"
Cash Flow Generation (Cash Burn)¹
(R$ million)
158
20142013
76
2012
-183
2011
-176
1Q15
63
12
Capital Structure
Capital Structure
(R$ million)
266
Net Debt
16% 16% 13%
Net Debt/Equity
283 230
CRI
12%
Working Capital
1%
SFH
61%
FINAME and Leasing
5%
Debentures22%
1Q15
685
915
4Q14
665
948
1Q14
603
869
Cash
Debt
Gross Debt Breakdown
(% of Debt)
Net Debt
Without SFH
-324
Net Debt
230
Cash and
Cash
Equivalent
685
Debt
915
SFH
554
361
Debt
(R$ million)
Buyback program and Dividend
13
 In March, the Board of Directors approved the share buyback program limited to the maximum
purchase of 7,034,205 and maximum period of 365 days, whose objective is the subsequent sale or
cancellation.
+3.7% or R$ 0,006
Total Approved 7,034,205
Total Runs 5,480,900
% Executed 78%
Total Shares 153,398,749
Available sharesbefore buyback 153,265,983
Available sharesafterbuyback 147,820,683
Dividends 26,873,977.64R$
Dividendspershare
Before Buyback R$ 0.1753
AfterBuyback R$ 0.1818
Plan Buyback (Status until 15/05/2015)
14
Disclosure and Contacts
This presentation contains certain forward-looking statements concerning the business prospects, projections of
operating and financial results and growth potential of the Company, which are based on management’s current
expectations and estimates of the future performance of the Company. Although the Company believes such
forward-looking statements are based on reasonable assumptions, it can give no assurance that its expectations
will be achieved. Expectations and estimates that are based on the future prospects of the Company are highly
dependent upon market behavior, Brazil’s political and economic situation, existing and future regulations of the
industry and international markets and, therefore, are subject to changes outside the Company’s and
management’s control. The Company undertakes no obligation to update any information contained herein or to
revise any forward-looking statement as a result of new information, future events or other information.
www.direcional.com.b/ir
ir@direcional.com.br
(55 31) 3431-5509
(55 31) 3431-5510
Fernando José Mancio Ramos
CFO | IR Officer

1Q15 Earnings Presentation

  • 1.
    1 Earnings Release |Conference Call – 1Q15 May 18th, 2015
  • 2.
    2 Agenda Ricardo Ribeiro Vice President FernandoRamos CFO and IR Officer Operational Highlights Financial Highlights
  • 3.
    3 Highlights  Cash flowgeneration of R$ 63 million in 1Q15.  Increase of 27% in services revenue (MCMV Level 1) if compared to the 1Q14, totaling R$ 317 million in 1Q15 which accounted for 76% of total revenue recognized during the period.  Reduction of the company's leverage ratio (net debt over equity) which accounted only 13%, one of the lowest among peers listed on the BM&F Bovespa.  At the end of 1Q15, sales revenue to be recognized totaled R$ 3.1 billion, accounting for approximately 21 months of revenue  Share buyback program and dividends in accordance to the approved policy.
  • 4.
    4 Launches and Sales ContractedNet Sales (PSV - R$ million) 110 137 194 36 331 4Q141Q14 772 1Q15 -89% -96% 882 Development MCMV Level 1 61% Midwest 22% North 18% Southeast Geographic Segmentation of Cancellations – 1Q15 (% PSV) Cancellations and Cancellation Resale (Units) 613 632 617 633 406504 535 476 481 239 59% 76%77% 85%82% 70%64% 75% 61% 59% 4Q141Q14 2Q14 3Q14 1Q15 -36% Resale (until 1Q15) Resale in the Period % Resale (until 1Q15)Cancellations Contracted Gross Sales – Development (PSV - R$ million) 97 227 185 4Q14 1Q15 -47% 1Q14 -57% Launches (PSV - R$ million) 194 154 20 4Q14 772 1Q14 -94% 348 -97% 1Q15 Development MCMV Level 1
  • 5.
    5 Inventory Inventory Track Record (PSV- R$ million) 20% 2012 <2012 Finished Units 25% 2%2015 2014 26% 5% 21% 2013 Inventory by Launch Period (% PSV) 855 1% +35% 1Q14 631 452 179 218 629 846 4Q14 639 216 1Q15 Finished Units Under Construction 38% North 12% Southeast 50% Midwest Inventory by Region (% PSV) 846 20 Launches 36 26 Net Sales 1Q15 855 Value Variation 4Q14
  • 6.
    6 Deliveries MCMV Level 1 51% Medium 36% Low-Income 13% 1Q15LTM Deliveries (Geographic and Economic Segmentation -PSV%) Northeast 4% Southeast 24% Midwest 16% North 56% 1Q15 LTM 1,046 2Q14 LTM 1,806 805 1Q14 LTM 721 4Q13 LTM 1,676 1,001 3Q13 LTM 839 398 1,020 1,237 905 674 760 1,526 3Q14 LTM 864 4Q14 LTM 607 1,751 628 1,235 887 115 Deliveries – Track Record (Over the past 12 months: R$ million) MCMV Level 1 Development Deliveries (PSV - R$ million) -86% 85320 -88% 737 1Q15 45 4Q14 601 325 417 276 1Q14 40 MCMV Level 1 Development  Deliveries amounted R$ 85 million in the 1Q15, a decrease of 88% when compared to the 4Q14;
  • 7.
    Low-Income Segment 7 Consistent trackrecord in the Low-Income segment(2007-14):  # of projects/phases : 43 # Units : 16,584 Total PSV : R$ 1,370.3 million Average PSV : R$ 31.9 million Average Units : 386 +16.3% 1Q14 2,565 1Q15 2,983 1Q15 20 2014 119 2013 11 2012 108 2011 210 2010 303 2009 358 2008 184 2007 58 Low-Income Segment 20082007 1Q152014 1,198 2013 2,041 2012 1,647 2011 522 2010 380 2009 154 MCMV Level 1 Launches (PSV - R$ million)  The VSO of Low-Income projects launched in 2014 was 80%, greatly superior to the Company's consolidated ratio, which, excluding Level 1 projects, was 45%.  Industrial construction method, with aluminum structures and concrete walls, thus the development may be delivered in an estimated period from 15 to 18 months.  “Associativo” financing model, according to which customers are transferred to banks when the sale is carried out, which significantly reduces the risk of a sale being canceled. Landbank - Low-Income (PSV - R$ million)
  • 8.
    8 Fernando Ramos CFO andIR Officer Financial Highlights
  • 9.
    9 Financial Results 1. Adjustmentexcluding interest on financing for construction; 250 404 317 160 167 102 4Q14 571 1Q14 409 419 -27% +2% 1Q15 Gross Operating Revenue (R$ million) Revenues from Services Revenues from Real Estate Sales Adjusted¹ Gross Profit and Gross Margin (R$ million) 92 120 85 12 23.9% 1Q14 104 11 26.1% 13 1Q15 -6% 132 4Q14 24.4% -26% 97 Gross ProfitAdjusted Gross Margin¹ Interest capitalized in costs
  • 10.
    1010 G&A (R$ million) 30 3127 -13% -10% 1Q15 6,7% 4Q14 5,6% 1Q14 7,5% % Net revenue Selling Expenses (R$ million) 13 811 -24% 1Q15 2,0% 4Q14 2,3% 1Q14 2,7% -37% % Net revenue Net Income (R$ million) 46 61 36 -22% 11,0% 1Q14 11,7% -40% 1Q15 9,1% 4Q14 Net Magin Financial Results
  • 11.
    11 Cash Flow Generation 1.Cash flow generation: net debt variation net of dividends and share buyback programs. 457 836 317269 76% 67% 47% 31% 23% 14% 1Q152014 1,281 2013201220112010 117 Revenue from Service % of Gross Revenue Revenue from Services (R$ million) Financing Pass-through (“Repasses”) ((R$ million - Cash Reception Criterion) 118 -20% -26% 1Q15 109 9 4Q14 159 145 14 1Q14 148 115 33 SFH"Associativo" Cash Flow Generation (Cash Burn)¹ (R$ million) 158 20142013 76 2012 -183 2011 -176 1Q15 63
  • 12.
    12 Capital Structure Capital Structure (R$million) 266 Net Debt 16% 16% 13% Net Debt/Equity 283 230 CRI 12% Working Capital 1% SFH 61% FINAME and Leasing 5% Debentures22% 1Q15 685 915 4Q14 665 948 1Q14 603 869 Cash Debt Gross Debt Breakdown (% of Debt) Net Debt Without SFH -324 Net Debt 230 Cash and Cash Equivalent 685 Debt 915 SFH 554 361 Debt (R$ million)
  • 13.
    Buyback program andDividend 13  In March, the Board of Directors approved the share buyback program limited to the maximum purchase of 7,034,205 and maximum period of 365 days, whose objective is the subsequent sale or cancellation. +3.7% or R$ 0,006 Total Approved 7,034,205 Total Runs 5,480,900 % Executed 78% Total Shares 153,398,749 Available sharesbefore buyback 153,265,983 Available sharesafterbuyback 147,820,683 Dividends 26,873,977.64R$ Dividendspershare Before Buyback R$ 0.1753 AfterBuyback R$ 0.1818 Plan Buyback (Status until 15/05/2015)
  • 14.
    14 Disclosure and Contacts Thispresentation contains certain forward-looking statements concerning the business prospects, projections of operating and financial results and growth potential of the Company, which are based on management’s current expectations and estimates of the future performance of the Company. Although the Company believes such forward-looking statements are based on reasonable assumptions, it can give no assurance that its expectations will be achieved. Expectations and estimates that are based on the future prospects of the Company are highly dependent upon market behavior, Brazil’s political and economic situation, existing and future regulations of the industry and international markets and, therefore, are subject to changes outside the Company’s and management’s control. The Company undertakes no obligation to update any information contained herein or to revise any forward-looking statement as a result of new information, future events or other information. www.direcional.com.b/ir ir@direcional.com.br (55 31) 3431-5509 (55 31) 3431-5510 Fernando José Mancio Ramos CFO | IR Officer