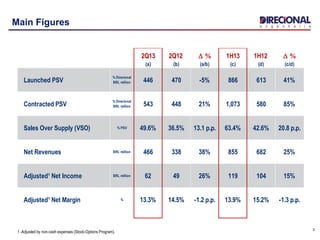
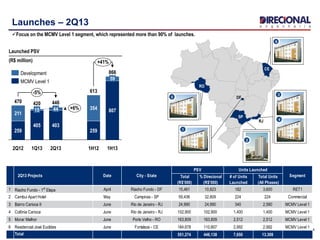
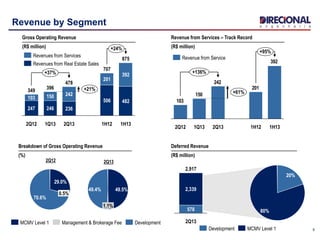
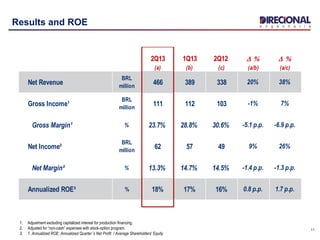
1) Directional Engenharia reported financial results for the second quarter of 2013, with net revenues increasing 38% compared to the second quarter of 2012.
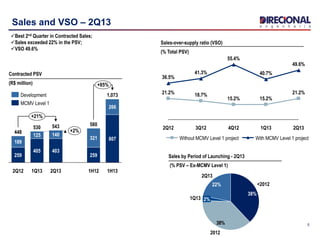
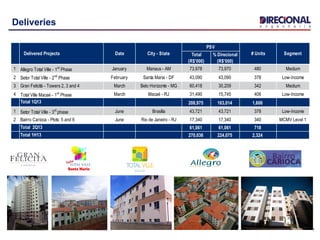
2) Contracted PSV sales increased 21% compared to the second quarter of 2012, with a sales over supply ratio of 49.6%.
3) Adjusted net income increased 26% compared to the second quarter of 2012, with an annualized return on equity of 18%.
Imagine, "What If?" with the E-Tainer LineKLW Plastics
What if, you could do more with less when it comes to your packaging? More savings. Less waste. More efficient. Less environmental impact. With the E-Tainer line of products, doing more with less is possible.
3. 2Q13 2Q12 D % 1H13 1H12 D %
(a) (b) (a/b) (c) (d) (c/d)
Launched PSV
% Direcional
BRL million 446 470 -5% 866 613 41%
Contracted PSV
% Direcional
BRL million 543 448 21% 1,073 580 85%
Sales Over Supply (VSO) % PSV 49.6% 36.5% 13.1 p.p. 63.4% 42.6% 20.8 p.p.
Net Revenues BRL million 466 338 38% 855 682 25%
Adjusted¹ Net Income BRL million 62 49 26% 119 104 15%
Adjusted¹ Net Margin % 13.3% 14.5% -1.2 p.p. 13.9% 15.2% -1.3 p.p.
Main Figures
3
1 -Adjusted by non-cash expenses (Stock-Options Program).
4. Total
(R$'000)
% Direcional
(R$'000)
# of Units
Launched
Total Units
(All Phases)
1 Riacho Fundo - 1st
Etapa April Riacho Fundo - DF 15,461 10,823 182 3,600 RET1
2 Cambui Apart Hotel May Campinas - SP 59,436 32,809 224 224 Commercial
3 Bairro Carioca II June Rio de Janeiro - RJ 24,990 24,990 340 2,580 MCMV Level 1
4 Colônia Carioca June Rio de Janeiro - RJ 102,900 102,900 1,400 1,400 MCMV Level 1
5 Morar Melhor June Porto Velho - RO 163,809 163,809 2,512 2,512 MCMV Level 1
6 Residencial José Euclides June Fortaleza - CE 184,678 110,807 2,992 2,992 MCMV Level 1
Total 551,274 446,138 7,650 13,308
Segment2Q13 Projects Date City - State
PSV Units Launched
4
Launches – 2Q13
Focus on the MCMV Level 1 segment, which represented more than 90% of launches.
RO
RJ
SP
4
DF
CE
3
5
6
1
2
2Q12
470
259
211
44
1Q13
420
405
15
259
354
2Q13
446
403
866
807
59
1H12
613
+41%
-5%
+6%
1H13
Launched PSV
(R$ million)
MCMV Level 1
Development
5. 5
Sales and VSO – 2Q13
Best 2nd Quarter in Contracted Sales;
Sales exceeded 22% in the PSV;
VSO 49.6%
+85%
+21%
+2%
1H13
1,073
807
266
1H12
580
259
321
2Q13
543
403
140
1Q13
530
405
125
2Q12
448
259
189
Contracted PSV
(R$ million)
MCMV Level 1
Development
2Q13
49.6%
21.2%
1Q13
40.7%
15.2%
4Q12
55.4%
15.2%
3Q12
41.3%
18.7%
2Q12
36.5%
21.2%
With MCMV Level 1 projectWithout MCMV Level 1 project
Sales-over-supply ratio (VSO)
(% Total PSV)
Sales by Period of Launching - 2Q13
(% PSV – Ex-MCMV Level 1)
38%
2Q13
22%
1Q13 2%
2012
<2012
38%
6. 6
Inventory
Reduction of 9% in total inventory in the 1Q13 and 25% in the 1H13;
Reduction of 16 % in inventory of completed units in the 1Q13 and 32% in the 1H13.
2013
2%
2012
38%
2011
29%
201015%
<2010
2%
Finished Units
15%
Midweast 17%
Southeast 33%
North 50%
603
-9%
-25%
2Q13
515
88
1Q13
667
561
106
2012
800
670
130
Under ConstructionConcluded Units
Inventory Market Value by Region
(% PSV)
Inventory by Launch Period
(% PSV)
Inventory Track Record
(R$ million)
Total % Direcional
Under Construction 600,236 514,981 85.3% 1,620 79.9%
Finished Units 104,277 88,443 14.7% 408 20.1%
Total 704,513 603,424 100.0% 2,028 100.0%
Inventory
PSV in Inventory (BRL'000)
% Units in Inventory %
7. Total
(R$'000)
% Direcional
(R$'000)
1 Allegro Total Ville - 1st
Phase January Manaus - AM 73,978 73,970 480 Medium
2 Setor Total Ville - 2nd
Phase February Santa Maria - DF 43,090 43,090 378 Low-Income
3 Gran Felicità - Towers 2, 3 and 4 March Belo Horizonte - MG 60,418 30,209 342 Medium
4 Total Ville Macaé - 1st
Phase March Macaé - RJ 31,490 15,745 406 Low-Income
Total 1Q13 208,975 163,014 1,606
1 Setor Total Ville - 3rd
phase June Brasília 43,721 43,721 378 Low-Income
2 Bairro Carioca - Plots: 5 and 6 June Rio de Janeiro - RJ 17,340 17,340 340 MCMV Level 1
Total 2Q13 61,061 61,061 718
Total 1H13 270,036 224,075 2,324
# Units SegmentDelivered Projects Date City - State
PSV
7
Deliveries
10. 10
“Repasse” and Cash Burn
Financing Transfer (“Repasses”)
(R$ million)
57
53
4Q12
136
63
73
3Q12
136
79
56
2Q12
100
50
93
1Q12
83
40
43
2Q13
153
71
82
1Q13
110
+12%
+44%
1H13
263
128
135
1H12
183
90
50
"Associativo"
SFH
-7
2Q13*1Q13
-30
4Q12
-5
3Q12
-43
2Q12*
-50
Cash Burn
(R$ Million)
* Adjusted by dividends and share repurchases
2Q13 1Q13 D
Accounts Receivable from
Service
BRL million 218 131 87
Accounts Receivable from
Development ( Finished Units )
BRL million 668 577 92
11. 11
Results and ROE
1. Adjustment excluding capitalized interest for production financing.
2. Adjusted for “non-cash” expenses with stock-option program.
3. 1. Annualized ROE: Annualized Quarter´s Net Profit / Average Shareholders' Equity
2Q13 1Q13 2Q12 D % D %
(a) (b) (c) (a/b) (a/c)
Net Revenue
BRL
million
466 389 338 20% 38%
Gross Income¹
BRL
million
111 112 103 -1% 7%
Gross Margin¹ % 23.7% 28.8% 30.6% -5.1 p.p. -6.9 p.p.
Net Income²
BRL
million
62 57 49 9% 26%
Net Margin² % 13.3% 14.7% 14.5% -1.4 p.p. -1.3 p.p.
Annualized ROE³ % 18% 17% 16% 0.8 p.p. 1.7 p.p.
12. 12
Cancellations
Distratos
(R$ milhões - %VGV Vendido)
26%
20%
26%
19%19%
16%
9%
6%
4%
6%
9%
16%
757
+37%
Total
1,035
2Q13
4444
1Q13
163
15
4Q12
219201
3Q12
287
143
2Q12
112
211
1Q12
210
143
% Cancellations Over Sales Total
% Cancellations Over Sales - Development
Deliveries - Development
Launches - Development
Southeast
15%
North
77%
Midwest9%
Cancellations by Region – 2Q13
(R$ million - % Contracted PSV)
Southeast
21%
North
72% Midwest7%
Cancellations by Region – 1H13
(R$ million - % Contracted PSV)
Southeast
13%
North
75%
Midwest
12%
Development Deliveries by Region
(% - 2012 and 1H13)
13. 13
Benefits from the Industrialization
Adjusted¹ G&A
(R$ million)
4747
232323
5,5%
6,8%
5,0%
6,0%6,7%
+1%
-1%
+3%
1S131S122T131T132T12
G&AAjustado% Receita Líquida
6%
2Q13
78%
16%
1Q13
75%
18%
7%
4Q12
70%
23%
7%
3Q12
60%
31%
9%
2Q12
56%
36%
9%
1Q12
50%
41%
8%
4Q11
49%
43%
7%
3Q11
45%
49%
7%
2Q11
33%
59%
8%
1Q11
29%
63%
8%
Units Under Construction by Construction Method
(% of Units)
Net Income and Annualized ROE ¹³
(R$ million)
104
6257
49
119
17,2%17,1%17,6%16,8%
15,9%
+15%
+9%
+26%
1H131H122Q131Q132Q12
Adjusted Net Income ¹
Annualized ROE¹³
1 -Adjusted by non-cash expenses (Stock-Options Program).
2 - Aluminum mold and concrete walls method.
3- Annualized ROE: Annualized Adjusted Net Income for the quarter / Average Shareholders’ Equity for the period (net of non-controlling interest in secret partnerships and special-
purpose entities)
Industrial Construction²Concrete BlocksConventional Structure
14. 14
Disclosure
This presentation contains certain forward-looking statements concerning the business prospects,
projections of operating and financial results and growth potential of the Company, which are based on
management’s current expectations and estimates of the future performance of the Company. Although the
Company believes such forward-looking statements are based on reasonable assumptions, it can give no
assurance that its expectations will be achieved. Expectations and estimates that are based on the future
prospects of the Company are highly dependent upon market behavior, Brazil’s political and economic
situation, existing and future regulations of the industry and international markets and, therefore, are
subject to changes outside the Company’s and management’s control. The Company undertakes no
obligation to update any information contained herein or to revise any forward-looking statement as a result
of new information, future events or other information.
15. 15
Contacts
Carlos Wollenweber
CFO | IR Officer
Paulo Sousa
IR Analyst
Luiz Felipe Almeida
IR Analyst
www.direcional.com.b/ir
ir@direcional.com.br
(55 31) 3214-6200
(55 31) 3214-6450