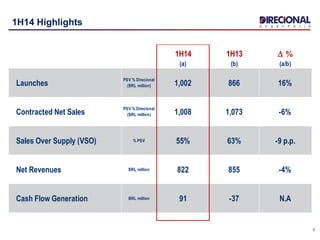
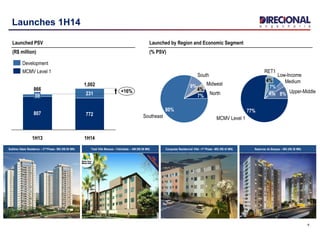
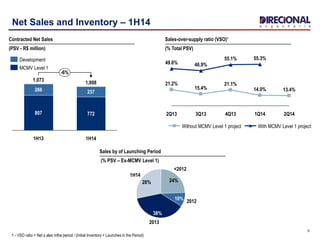
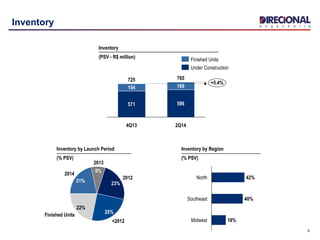
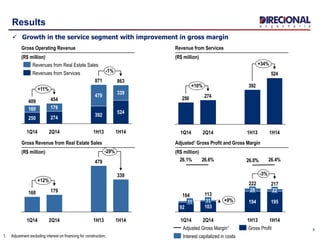
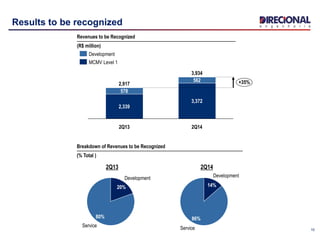
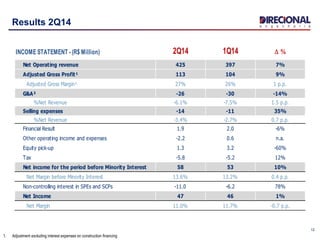
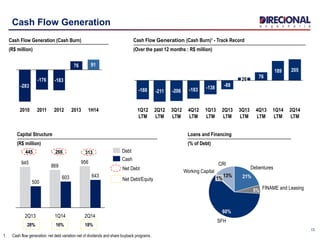
1
Earnings Release | Conference Call – 2Q14
August 15th, 2014
2
Agenda
Ricardo Ribeiro
Vice President
Carlos Wollenweber
CFO | IR Officer
Operational Highlights
Financial Highlights
3
1H14 Highlights
1H14 1H13 D %
(a) (b) (a/b)
Launches
PSV % Direcional
(BRL million) 1,002 866 16%
Contracted Net Sales
PSV % Direcional
(BRL million) 1,008 1,073 -6%
Sales Over Supply (VSO) % PSV 55% 63% -9 p.p.
Net Revenues BRL million 822 855 -4%
Cash Flow Generation BRL million 91 -37 N.A
4
Launches 1H14
1,002
+16%
1H14
772
231
1H13
866
807
59
Launched PSV
(R$ million)
MCMV Level 1
Development
Conquista Residencial Ville –1st Phase –MG (R$ 43 MN)Total Ville Manaus – Felicidade – AM (R$ 66 MN)Sublime Oásis Residence – 2ª Etapa – MG (R$ 45,9 MM) Reservas do Bosque – MG (R$ 36 MN)
South
9%
Southeast
80%
North7%
Midwest
4% Upper-Middle8%
Medium
4%
Low-Income
7%
RET1
4%
MCMV Level 1
77%
Sublime Oásis Residence – 2nd Phase– MG (R$ 85 MN)
Launched by Region and Economic Segment
(% PSV)
5
Net Sales and Inventory – 1H14
Contracted Net Sales
(PSV - R$ million)
2Q14
13.4%
1Q14
55.3%
14.0%
4Q13
55.1%
21.1%
3Q13
46.9%
15.4%
2Q13
49.6%
21.2%
With MCMV Level 1 projectWithout MCMV Level 1 project
Sales-over-supply ratio (VSO)¹
(% Total PSV)
1 - VSO ratio = Net s ales inthe period / (Initial Inventory + Launches in the Period)
-6%
1H14
1,008
772
237
1H13
1,073
807
266
MCMV Level 1
Development
1H14
28%
2013
38%
201210%
<2012
24%
Sales by of Launching Period
(% PSV – Ex-MCMV Level 1)
6
Inventory
Inventory
(PSV - R$ million)
765
+5.4%
2Q14
596
169
4Q13
725
571
154
Finished Units
Under Construction
Finished Units
2013
9%
2014
21%
22%
<2012
25%
2012
23%
Midwest 18%
Southeast 40%
North 42%
Inventory by Region
(% PSV)
Inventory by Launch Period
(% PSV)
7
Deliveries
2Q14
LTM
1,806
1Q14
LTM
4Q13
LTM
1,676
3Q13
LTM
1,237
2Q13
LTM
1,0201,029
Deliveries – Track Record
(Over the past 12 months: R$ million)
Residencial
Macapaba
Parque Carioca
Deliveries by Region and Economic Segment
(Over the past 12 months: % PSV)
Northeast4%
Midwest
19%
North
44%
Southeast
32% 17%
Low-Income
14%
Medium
11% Commercial
42%
MCMV Level 1
Upper-Middle
11%
6%
RET 1
8
Carlos Wollenweber
CFO | IR Officer
Financial Highlights
9
Results
1. Adjustment excluding interest on financing for construction;
+11%
-1%
1H14
863
524
339
1H13
871
392
479
2Q14
454
274
179
1Q14
409
250
160
Gross Operating Revenue
(R$ million)
Revenues from Services
Revenues from Real Estate Sales
524
392
274250
+10%
+34%
1H141H132Q141Q14
Revenue from Services
(R$ million)
+12%
-29%
1H14
339
1H13
479
2Q14
179
1Q14
160
Gross Revenue from Real Estate Sales
(R$ million)
Adjusted¹ Gross Profit and Gross Margin
(R$ million)
26.4%26.0%26.6%26.1%
-3%
+9%
1H14
217
195
22
1H13
222
194
28
2Q14
113
103
11
1Q14
104
92
11
Gross Profit
Interest capitalized in costs
Adjusted Gross Margin¹
 Growth in the service segment with improvement in gross margin
10
Results to be recognized
Service
86%
Development
14%
Service
80%
Development
20%
Breakdown of Revenues to be Recognized
(% Total )
2Q142Q13
3,934
+35%
2Q14
3,372
562
2Q13
2,917
2,339
578
MCMV Level 1
Development
Revenues to be Recognized
(R$ million)
11
Selling Expenses vs. Cancellations Resale
Cancellations and Cancellation Resale
(Units)
632613
490479461
203
475444
384
430426
182
47%
75%
52%
73% 71%
61%
72%
1Q14
75%
2Q14
90%
78%
3Q13 4Q132Q13
92%90%
1Q13
Resale (until 2Q14)
Cancellations % Resale (until 2Q14)
Resale in the Period
Selling Expenses
(R$ million)
25
16
14
11
1H13 1H14
+51%
3.0%
+35%
1.9%2.7%
1Q14
3.4%
2Q14
Selling Expenses % Net revenue
12
1. Adjustment excluding interest expenses on construction financing
Results 2Q14
INCOME STATEMENT - (R$ Million) 2Q14 1Q14 D %
Net Operating revenue 425 397 7%
Adjusted Gross Profit¹ 113 104 9%
Adjusted Gross Margin¹ 27% 26% 1 p.p.
G&A² -26 -30 -14%
%Net Revenue -6.1% -7.5% 1.5 p.p.
Selling expenses -14 -11 35%
%Net Revenue -3.4% -2.7% 0.7 p.p.
Financial Result 1.9 2.0 -6%
Other operating income and expenses -2.2 0.6 n.a.
Equity pick-up 1.3 3.2 -60%
Tax -5.8 -5.2 12%
Net income for the period before Minority Interest 58 53 10%
Net Margin before Minority Interest 13.6% 13.2% 0.4 p.p.
Non-controlling interest in SPEs and SCPs -11.0 -6.2 78%
Net Income 47 46 1%
Net Margin 11.0% 11.7% -0.7 p.p.
13
Cash Flow Generation
Cash Flow Generation (Cash Burn)
(R$ million)
Capital Structure
(R$ million)
445
Net Debt
28% 16% 18%
Net Debt/Equity
266 313
CRI
13%
Working Capital
1%
SFH
60%
FINAME and Leasing5%
Debentures
21%
Loans and Financing
(% of Debt)
2013
76
2012
-183
2011
-176
2010
-283
1H14
91
2Q14
643
956
1Q14
603
869
2Q13
500
945
Cash
Debt
2Q14
LTM
205
1Q14
LTM
189
4Q13
LTM
76
3Q13
LTM
26
2Q13
LTM
-88
1Q13
LTM
-138
4Q12
LTM
-183
3Q12
LTM
-206
2Q12
LTM
-211
1Q12
LTM
-188
Cash Flow Generation (Cash Burn)¹ - Track Record
(Over the past 12 months : R$ million)
1. Cash flow generation: net debt variation net of dividends and share buyback programs .
14
Disclosure and Contacts
This presentation contains certain forward-looking statements concerning the business prospects, projections of
operating and financial results and growth potential of the Company, which are based on management’s current
expectations and estimates of the future performance of the Company. Although the Company believes such
forward-looking statements are based on reasonable assumptions, it can give no assurance that its expectations
will be achieved. Expectations and estimates that are based on the future prospects of the Company are highly
dependent upon market behavior, Brazil’s political and economic situation, existing and future regulations of the
industry and international markets and, therefore, are subject to changes outside the Company’s and
management’s control. The Company undertakes no obligation to update any information contained herein or to
revise any forward-looking statement as a result of new information, future events or other information.
www.direcional.com.b/ir
ir@direcional.com.br
(55 31) 3214-6200
(55 31) 3214-6450
Carlos Wollenweber
CFO | IR Officer
Paulo Sousa
IR Coordinator
Luiz Felipe Almeida
IR Analist

2Q14 Disclosure and Results

  • 1.
    1 Earnings Release |Conference Call – 2Q14 August 15th, 2014
  • 2.
    2 Agenda Ricardo Ribeiro Vice President CarlosWollenweber CFO | IR Officer Operational Highlights Financial Highlights
  • 3.
    3 1H14 Highlights 1H14 1H13D % (a) (b) (a/b) Launches PSV % Direcional (BRL million) 1,002 866 16% Contracted Net Sales PSV % Direcional (BRL million) 1,008 1,073 -6% Sales Over Supply (VSO) % PSV 55% 63% -9 p.p. Net Revenues BRL million 822 855 -4% Cash Flow Generation BRL million 91 -37 N.A
  • 4.
    4 Launches 1H14 1,002 +16% 1H14 772 231 1H13 866 807 59 Launched PSV (R$million) MCMV Level 1 Development Conquista Residencial Ville –1st Phase –MG (R$ 43 MN)Total Ville Manaus – Felicidade – AM (R$ 66 MN)Sublime Oásis Residence – 2ª Etapa – MG (R$ 45,9 MM) Reservas do Bosque – MG (R$ 36 MN) South 9% Southeast 80% North7% Midwest 4% Upper-Middle8% Medium 4% Low-Income 7% RET1 4% MCMV Level 1 77% Sublime Oásis Residence – 2nd Phase– MG (R$ 85 MN) Launched by Region and Economic Segment (% PSV)
  • 5.
    5 Net Sales andInventory – 1H14 Contracted Net Sales (PSV - R$ million) 2Q14 13.4% 1Q14 55.3% 14.0% 4Q13 55.1% 21.1% 3Q13 46.9% 15.4% 2Q13 49.6% 21.2% With MCMV Level 1 projectWithout MCMV Level 1 project Sales-over-supply ratio (VSO)¹ (% Total PSV) 1 - VSO ratio = Net s ales inthe period / (Initial Inventory + Launches in the Period) -6% 1H14 1,008 772 237 1H13 1,073 807 266 MCMV Level 1 Development 1H14 28% 2013 38% 201210% <2012 24% Sales by of Launching Period (% PSV – Ex-MCMV Level 1)
  • 6.
    6 Inventory Inventory (PSV - R$million) 765 +5.4% 2Q14 596 169 4Q13 725 571 154 Finished Units Under Construction Finished Units 2013 9% 2014 21% 22% <2012 25% 2012 23% Midwest 18% Southeast 40% North 42% Inventory by Region (% PSV) Inventory by Launch Period (% PSV)
  • 7.
    7 Deliveries 2Q14 LTM 1,806 1Q14 LTM 4Q13 LTM 1,676 3Q13 LTM 1,237 2Q13 LTM 1,0201,029 Deliveries – TrackRecord (Over the past 12 months: R$ million) Residencial Macapaba Parque Carioca Deliveries by Region and Economic Segment (Over the past 12 months: % PSV) Northeast4% Midwest 19% North 44% Southeast 32% 17% Low-Income 14% Medium 11% Commercial 42% MCMV Level 1 Upper-Middle 11% 6% RET 1
  • 8.
    8 Carlos Wollenweber CFO |IR Officer Financial Highlights
  • 9.
    9 Results 1. Adjustment excludinginterest on financing for construction; +11% -1% 1H14 863 524 339 1H13 871 392 479 2Q14 454 274 179 1Q14 409 250 160 Gross Operating Revenue (R$ million) Revenues from Services Revenues from Real Estate Sales 524 392 274250 +10% +34% 1H141H132Q141Q14 Revenue from Services (R$ million) +12% -29% 1H14 339 1H13 479 2Q14 179 1Q14 160 Gross Revenue from Real Estate Sales (R$ million) Adjusted¹ Gross Profit and Gross Margin (R$ million) 26.4%26.0%26.6%26.1% -3% +9% 1H14 217 195 22 1H13 222 194 28 2Q14 113 103 11 1Q14 104 92 11 Gross Profit Interest capitalized in costs Adjusted Gross Margin¹  Growth in the service segment with improvement in gross margin
  • 10.
    10 Results to berecognized Service 86% Development 14% Service 80% Development 20% Breakdown of Revenues to be Recognized (% Total ) 2Q142Q13 3,934 +35% 2Q14 3,372 562 2Q13 2,917 2,339 578 MCMV Level 1 Development Revenues to be Recognized (R$ million)
  • 11.
    11 Selling Expenses vs.Cancellations Resale Cancellations and Cancellation Resale (Units) 632613 490479461 203 475444 384 430426 182 47% 75% 52% 73% 71% 61% 72% 1Q14 75% 2Q14 90% 78% 3Q13 4Q132Q13 92%90% 1Q13 Resale (until 2Q14) Cancellations % Resale (until 2Q14) Resale in the Period Selling Expenses (R$ million) 25 16 14 11 1H13 1H14 +51% 3.0% +35% 1.9%2.7% 1Q14 3.4% 2Q14 Selling Expenses % Net revenue
  • 12.
    12 1. Adjustment excludinginterest expenses on construction financing Results 2Q14 INCOME STATEMENT - (R$ Million) 2Q14 1Q14 D % Net Operating revenue 425 397 7% Adjusted Gross Profit¹ 113 104 9% Adjusted Gross Margin¹ 27% 26% 1 p.p. G&A² -26 -30 -14% %Net Revenue -6.1% -7.5% 1.5 p.p. Selling expenses -14 -11 35% %Net Revenue -3.4% -2.7% 0.7 p.p. Financial Result 1.9 2.0 -6% Other operating income and expenses -2.2 0.6 n.a. Equity pick-up 1.3 3.2 -60% Tax -5.8 -5.2 12% Net income for the period before Minority Interest 58 53 10% Net Margin before Minority Interest 13.6% 13.2% 0.4 p.p. Non-controlling interest in SPEs and SCPs -11.0 -6.2 78% Net Income 47 46 1% Net Margin 11.0% 11.7% -0.7 p.p.
  • 13.
    13 Cash Flow Generation CashFlow Generation (Cash Burn) (R$ million) Capital Structure (R$ million) 445 Net Debt 28% 16% 18% Net Debt/Equity 266 313 CRI 13% Working Capital 1% SFH 60% FINAME and Leasing5% Debentures 21% Loans and Financing (% of Debt) 2013 76 2012 -183 2011 -176 2010 -283 1H14 91 2Q14 643 956 1Q14 603 869 2Q13 500 945 Cash Debt 2Q14 LTM 205 1Q14 LTM 189 4Q13 LTM 76 3Q13 LTM 26 2Q13 LTM -88 1Q13 LTM -138 4Q12 LTM -183 3Q12 LTM -206 2Q12 LTM -211 1Q12 LTM -188 Cash Flow Generation (Cash Burn)¹ - Track Record (Over the past 12 months : R$ million) 1. Cash flow generation: net debt variation net of dividends and share buyback programs .
  • 14.
    14 Disclosure and Contacts Thispresentation contains certain forward-looking statements concerning the business prospects, projections of operating and financial results and growth potential of the Company, which are based on management’s current expectations and estimates of the future performance of the Company. Although the Company believes such forward-looking statements are based on reasonable assumptions, it can give no assurance that its expectations will be achieved. Expectations and estimates that are based on the future prospects of the Company are highly dependent upon market behavior, Brazil’s political and economic situation, existing and future regulations of the industry and international markets and, therefore, are subject to changes outside the Company’s and management’s control. The Company undertakes no obligation to update any information contained herein or to revise any forward-looking statement as a result of new information, future events or other information. www.direcional.com.b/ir ir@direcional.com.br (55 31) 3214-6200 (55 31) 3214-6450 Carlos Wollenweber CFO | IR Officer Paulo Sousa IR Coordinator Luiz Felipe Almeida IR Analist