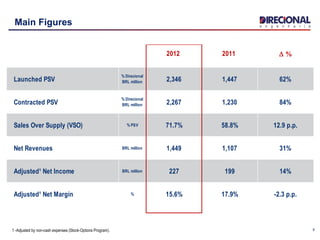
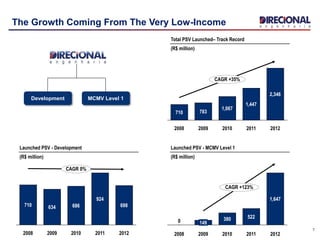
This corporate presentation summarizes the history, business model, and key operating metrics of a real estate development company. Some key points:
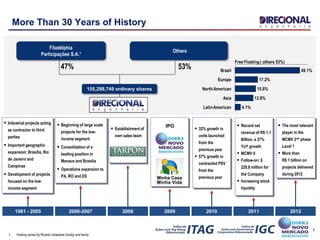
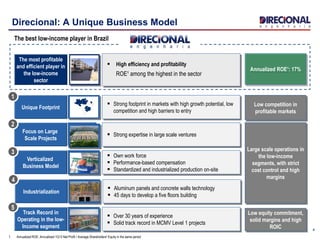
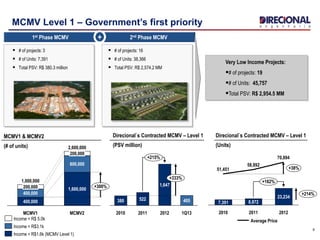
- The company has over 30 years of experience developing large-scale, low-income housing projects in Brazil.
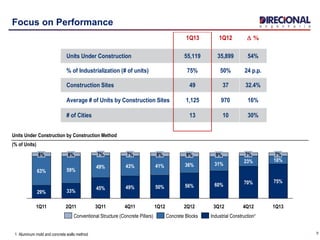
- It has a vertically integrated business model focused on industrialized construction techniques to efficiently develop projects at scale.
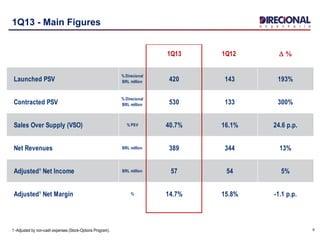
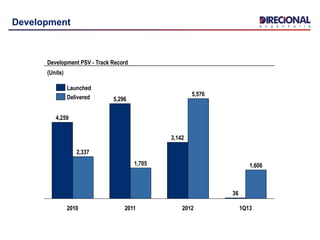
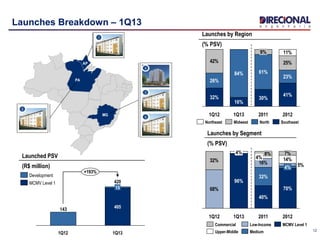
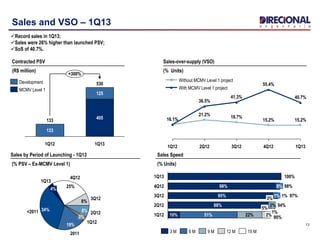
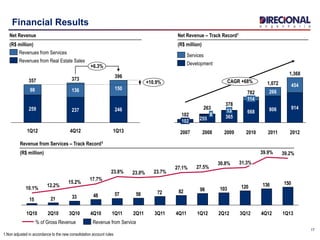
- In 1Q13, the company saw strong growth with launched PSV up 193% year-over-year and contracted PSV up 300% year-over-year. Sales were also up significantly.
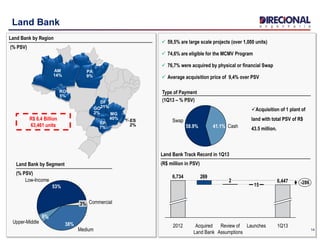
- The land bank as of 1Q13 had a PSV of $6.4 billion and was mostly comprised of large-scale
Sales Increase 13% in Original Currency
Operating Income Rises 3% Compared to 2014 First Quarter
Reaffirms 2015 Guidance; Sales Expected to Reach $1,065 Million-$1,085 Million and
Full-Year EPS Expected to Reach $1.88-2.00
Sales Increase 13% in Original Currency
Operating Income Rises 3% Compared to 2014 First Quarter
Reaffirms 2015 Guidance; Sales Expected to Reach $1,065 Million-$1,085 Million and
Full-Year EPS Expected to Reach $1.88-2.00
Get the financial highlights and an overview of our performance per business.
You can view our financial reports here: www.sgs.com/en/Our-Company/Investor-Relations/Financial-Reports
Afrox 2017 Annual Results Presentation on 22 February 2018Simon Miller
During the year under review, Afrox increased revenue by 2.8% from improved volumes in the segments Atmospheric Gases and LPG and effective price cost recovery across all four segments.
Get the financial highlights and an overview of our performance per business. You can access all our Financial Reports here: http://www.sgs.com/en/Our-Company/Investor-Relations/Financial-Reports.aspx
Get the financial highlights and an overview of our performance per business.
You can view our financial reports here: www.sgs.com/en/Our-Company/Investor-Relations/Financial-Reports
SGS 2021 Full Year Results Alternative Performance MeasuresSGS
We've delivered a strong financial performance in 2021, making significant progress on our new strategic plan.
#SGS #SGSGroup #WeAreSGS #FinancialResults
Get the financial highlights and an overview of our performance per business.
You can view our financial reports here: www.sgs.com/en/Our-Company/Investor-Relations/Financial-Reports
Afrox 2017 Annual Results Presentation on 22 February 2018Simon Miller
During the year under review, Afrox increased revenue by 2.8% from improved volumes in the segments Atmospheric Gases and LPG and effective price cost recovery across all four segments.
Get the financial highlights and an overview of our performance per business. You can access all our Financial Reports here: http://www.sgs.com/en/Our-Company/Investor-Relations/Financial-Reports.aspx
Get the financial highlights and an overview of our performance per business.
You can view our financial reports here: www.sgs.com/en/Our-Company/Investor-Relations/Financial-Reports
SGS 2021 Full Year Results Alternative Performance MeasuresSGS
We've delivered a strong financial performance in 2021, making significant progress on our new strategic plan.
#SGS #SGSGroup #WeAreSGS #FinancialResults
3. 3
More Than 30 Years of History
47%
Filadélphia
Participações S.A.1 Others
53%
155,298,749 ordinary shares
1. Holding owned by Ricardo Valadares Gontijo and family
Industrial projects acting
as contractor to third
parties
Important geographic
expansion: Brasília, Rio
de Janeiro and
Campinas
Development of projects
focused on the low-
income segment
Beginning of large scale
projects for the low-
income segment
Consolidation of a
leading position in
Manaus and Brasilia
Operations expansion to
PA, RO and ES
IPO
32% growth in
units launched
from the
previous year
57% growth in
contracted PSV
from the
previous year
Establishment of
own sales team
1981 - 2005 2006-2007 2008 2009 2010 2011
Record net
revenue of R$ 1.1
Billion, a 37%
YoY growth
MCMV II
Follow-on: $
228.8 million for
the Company
Increasing stock
liquidity
The most relevant
player in the
MCMV 2nd phase
Level 1
More than
R$ 1 billion on
projects delivered
during 2012
2012
LatinAmerican
Asia 13.8%
NorthAmerican
4.1%
Europe
15.8%
Brazil
17.2%
49.1%
Free Floating ( others 53%)
4. Unique Footprint
Strong footprint in markets with high growth potential, low
competition and high barriers to entry
Low competition in
profitable markets
Track Record in
Operating in the low-
Income segment
Over 30 years of experience
Solid track record in MCMV Level 1 projects
Low equity commitment,
solid margins and high
ROIC
Focus on Large
Scale Projects
Verticalized
Business Model
Strong expertise in large scale ventures
Own work force
Performance-based compensation
Standardized and industrialized production on-site
Large scale operations in
the low-income
segments, with strict
cost control and high
margins
4
Direcional: A Unique Business Model
The most profitable
and efficient player in
the low-income
sector
‘’’’
High efficiency and profitability
ROE¹ among the highest in the sector
1
2
3
5
Annualized ROE¹: 17%
1. Annualized ROE: Annualized 1Q13 Net Profit / Average Shareholders' Equity in the same period
The best low-income player in Brazil
Industrialization
Aluminum panels and concrete walls technology
45 days to develop a five floors building
4
5. 2012- 2011- D %
Launched PSV
% Direcional
BRL million 2,346 1,447 62%
Contracted PSV
% Direcional
BRL million 2,267 1,230 84%
Sales Over Supply (VSO) % PSV 71.7% 58.8% 12.9 p.p.
Net Revenues BRL million 1,449 1,107 31%
Adjusted¹ Net Income BRL million 227 199 14%
Adjusted¹ Net Margin % 15.6% 17.9% -2.3 p.p.
Main Figures
51 -Adjusted by non-cash expenses (Stock-Options Program).
6. 1Q13 1Q12 D %
Launched PSV
% Direcional
BRL million 420 143 193%
Contracted PSV
% Direcional
BRL million 530 133 300%
Sales Over Supply (VSO) % PSV 40.7% 16.1% 24.6 p.p.
Net Revenues BRL million 389 344 13%
Adjusted¹ Net Income BRL million 57 54 5%
Adjusted¹ Net Margin % 14.7% 15.8% -1.1 p.p.
1Q13 - Main Figures
61 -Adjusted by non-cash expenses (Stock-Options Program).
7. 7
The Growth Coming From The Very Low-Income
Total PSV Launched– Track Record
(R$ million)
783710
2008 2012
CAGR +35%
1,067
2009
2,346
2010
1,447
2011
Development MCMV Level 1
Launched PSV - MCMV Level 1
(R$ million)
924
634
2010
686
20092008
710
2012
698
2011
CAGR 0%
Launched PSV - Development
(R$ million)
0
CAGR +123%
522
2012
380
20112010
1,647
2009
149
2008
8. Very Low Income Projects:
# of projects: 19
# of Units: 45,757
Total PSV: R$ 2,954.5 MM
8
MCMV Level 1 – Government’s first priority
2,600,000
+300%
MCMV2
1,600,000
800,000
200,000
MCMV1
1,000,000
400,000
400,000
200,000
Income < R$1.6k (MCMV Level 1)
Income < R$3.1k
Income < R$ 5.0k
MCMV1 & MCMV2
(# of units)
1st Phase MCMV 2nd Phase MCMV
# of projects: 3
# of Units: 7,391
Total PSV: R$ 380.3 million
# of projects: 16
# of Units: 38,366
Total PSV: R$ 2,574.2 MM
+
Direcional`s Contracted MCMV – Level 1
(PSV million)
Direcional`s Contracted MCMV – Level 1
(Units)
+215%
+333%
1Q13
405
2012
1,647
2011
522
2010
380
+38%
+214%
+162%
8,872
2012
23,234
70,894
2011
58,892
2010
7,391
51,451
Average Price
9. 9
Focus on Performance
33%
49%
3Q11
45%
59%
7%
43%
8%
1Q11
29%
63%
8%
49%
7%
2Q11
7%
31%
60%
75%
18%
4Q12
70%
23%
7%
1Q133Q124Q11
8%
41% 36%
56%
2Q12
9%9%
1Q12
50%
Units Under Construction by Construction Method
(% of Units)
1 Aluminum mold and concrete walls method
Conventional Structure (Concrete Pillars) Concrete Blocks Industrial Construction¹
1Q13 1Q12 D %
Units Under Construction 55,119 35,899 54%
% of Industrialization (# of units) 75% 50% 24 p.p.
Construction Sites 49 37 32.4%
Average # of Units by Construction Sites 1,125 970 16%
# of Cities 13 10 30%
10. Development
Development PSV - Track Record
(Units)
36
1,606
2012
5,576
3,142
2011
1,705
5,296
2010
2,337
1Q13
4,259
Delivered
Launched
13. 13
Sales and VSO – 1Q13
1Q13
40.7%
15.2%
4Q12
55.4%
15.2%
3Q12
41.3%
18.7%
2Q12
36.5%
21.2%
1Q12
16.1%16.1%
With MCMV Level 1 project
Without MCMV Level 1 project
1Q12 90%10% 51% 22%
5%
2%
2Q12 94%88%
3%
2%
1%
3Q12 97%95% 1% 1%
4Q12 98%98% 0%
1Q13 100%
3 M 6 M 9 M 12 M 15 M
+300%
1Q13
530
405
125
1Q12
133
133
Sales by Period of Launching - 1Q13
(% PSV – Ex-MCMV Level 1)
8%
2011
19%
<2011 34%
1Q12
3%
2Q128%
3Q12
4Q12
25%
1Q13
4%
Contracted PSV
(R$ million)
Sales-over-supply (VSO)
(% Units)
Sales Speed
(% Units)
Record sales in 1Q13;
Sales were 26% higher than launched PSV;
SoS of 40.7%.
MCMV Level 1
Development
14. 14
Land Bank
59,5% are large scale projects (over 1,000 units)
74,6% are eligible for the MCMV Program
76,7% were acquired by physical or financial Swap
Average acquisition price of 9,4% over PSV
R$ 6.4 Billion
63,461 units
Land Bank by Segment
(% PSV)
Land Bank Track Record in 1Q13
(R$ million in PSV)
2
269
6,447 -286
1Q13Launches
15
Review of
Assumptions
Acquired
Land Bank
2012
6,734
Land Bank by Region
(% PSV)
Type of Payment
(1Q13 – % PSV)
Swap
58.9% Cash41.1%
53%
Low-Income
Upper-Middle
6%
Medium
38%
Commercial3%
Acquisition of 1 plant of
land with total PSV of R$
43.5 million.
ES
2%
AM
14%
MG
40%
RO
5%
SP
7%
PA
9%
DF
21%GO
2%
15. 15
Inventory
1Q13
1%
2012 40%
2011
29%
201012%
<2010
2%
Concluded Units
16%
Midweast 17.8%
Southeast 33.0%
North 49.1%
Inventory Track Record
(R$ million)
Inventory by Launch Period
(% PSV)
Inventory Market Value by Region
(% PSV)
1Q13: Reduction of 17% in total inventory;
1Q13: Reduction of 19 % in inventory of completed units.
667 -7.5%
-16.7%
1Q13
561
106
2012
800
670
130
2011
721
668
53
Under Construction
Concluded Units
Under Construction 560.870 84,1% 1.848 78,6%
Finished Units 105.714 15,9% 502 21,4%
Total 666.584 100,0% 2.350 100,0%
Inventory % Units in Inventory %
PSV in Inventory (BRL'000)
% Direcional
20. 20
“Repasse” and Cash Burn
-30
1Q134Q121Q12
-75
-43
3Q12
-5
-50
2Q12
Cash Burn
(R$ Million)
+33%
110.3
-19%
72.8
136.2
1Q12
63.4
4Q12
39.8
82.9
43.1
1Q13
52.9
57.4
Financing Transfer (“Repasses”)
(R$ million)
"Associativo"
SFH
Cash Burn – Adjusted by Accounts Receivable
(R$ milhões)
Net Cash Burn from
the increase on
Accounts Receivable
of Finished Units
40.2
70.5
Cash Burn Variation on
Accounts Receivable
of Finished Units
-30.3
Seasonal reduction in the number of financing installments passed on to the banks impacted cash flow in 1Q13;
Net of accounts receivable from completed units, it represents cash flow of R$ 40 million;
The increase in accounts receivable from completed units is due to the PSV of R$154 million delivered in the quarter.
BRL (Million) 1Q13 4Q12 D %
Accounts Receivable (BRL'000) -Development 1,450 1,375 5%
Concluded Units 577 506 14%
Under Construction 874 869 1%
21. 21
Capital Structure
Receivables Assignment
2.1% CRI
11.7%
Working Capital
3.2% FINAME and Leasing2.5%
SFH
80.5%
Net Debt Adjusted by Receivables from Delivered Units
(R$ million – 1Q13)
203
Net Debt
Adjusted By
Receivables
from Delivered
Units
Receivables
from Delivered
Units
577
Net Debt
374
Cash and
Equivalents
434
Total Debt
807
1Q13 4Q12 D %
(BRL million) (a) (b) (a/b)
Debt 807.3 793.2 1.8%
SFH 649.7 622.6 4.4%
CRI 94.8 99.8 -5.0%
Securitization - 3.6 -100.0%
Receivables Assigned 16.7 28.9 -42.2%
Working Capital 20.2 18.2 10.6%
FINAME and others 25.9 20.1 29.1%
Cash 433.7 449.9 -3.6%
Net debt 373.6 343.3 8.8%
Net debt / Equity 24.6% 22.7% 2 p.p.
Debt Breakdown
(% Total Debt)
23. 23
Improvement on DIRR3 Float
Number of Investors
(#)
+69%
1,573
+195%
Mar.13
675
898
Dec.12
933
480
453
Sep.12
652
283
369
Jun.12
531
214
317
Mar.12
533
217
316
Investment Funds
Personal Investors
+51%
11,789
+827%
1Q134Q12
7,795
3Q12
2,539
2Q12
1,039
1Q12
1,272
Average Trading Volume
(# of Transactions)
Average Trading Volume
(R$ 000)
616
245
108115
+121%
1,359
+1,083%
1Q134Q123Q122Q121Q12
24. BISA3; -16,1%
CYRE3; 14,3%
EVEN3; 14,4%
EZTC3; 24,5%GFSA3; -5,8%
HBOR3; 26,1%
MRVE3; 12,9%
DIRR3 17,2%
RDNI3; 10,3%
RSID3; -12,7%
TCSA3; -8,4%
SETOR; -4,0%
TRIS3; 6,7%
25%
30%
35%
40%
45%
50%
55%
60%
-50% -30% -10% 10% 30% 50%
NetRevenueLTM/TotalAssets
Net Margin¹
Slow turnover and margin above averageSlow turnover and margin below average
Fast turnover and margin below average Fast turnover and margin above average
Company; ROE LTM
Size: Leverage (Assets/Equity)
Color: Average Prince - Launched Units Last 24 months
Low - up to R$ 200k per unit
Medium - between R$ 200k and R$ 400k per unit
High - above R$ 400k per unit
Setor
1. Direcional: Adjusted for non-cash expenses (Stock-Options Program)
24
Outstanding Results
17.2%
Source: Company Earning Release 1Q13 Annualized
(As of 1Q13)
28. 28
Contacts
Carlos Wollenweber
CFO | IR Officer
Paulo Sousa
IR Analyst
Luiz Felipe Almeida
IR Analyst
www.direcional.com.b/ir
ri@direcional.com.br
(55 31) 3214-6200
(55 31) 3214-6450