This corporate presentation summarizes the history, business model, and key financial highlights of a real estate development company. Some key points:
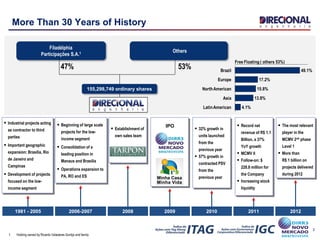
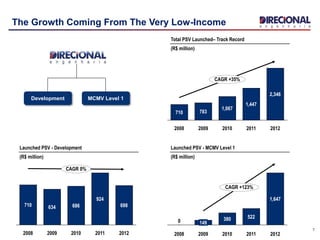
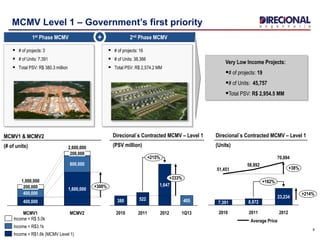
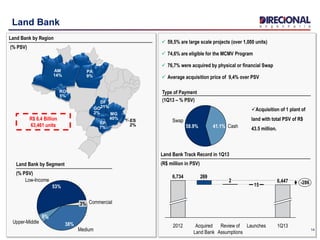
- The company has over 30 years of experience developing real estate projects focused on the low-income segment in Brazil.
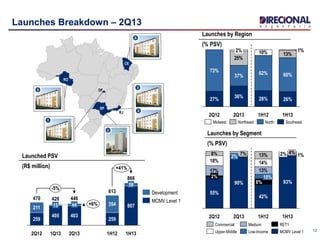
- It has expanded operations across multiple regions in Brazil and has consolidated a leading position in certain markets.
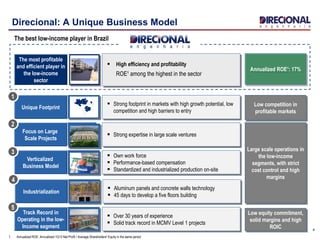
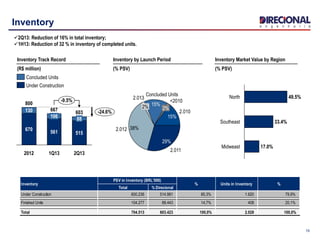
- The business model focuses on large-scale, standardized projects utilizing industrialized construction methods to drive efficiencies.
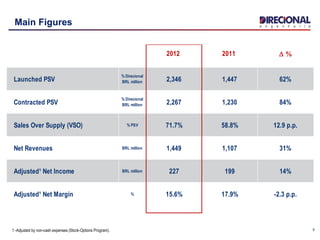
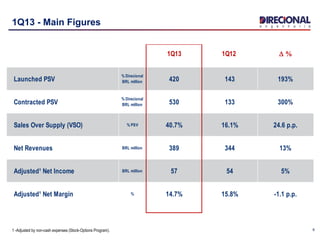
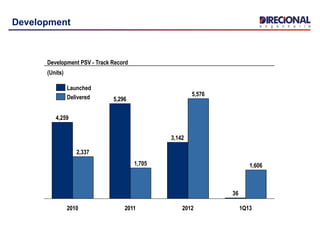
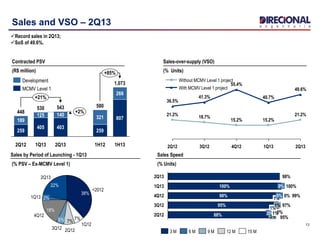
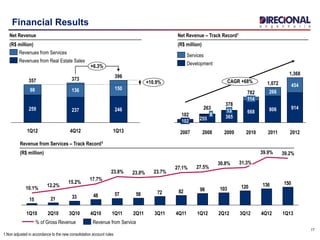
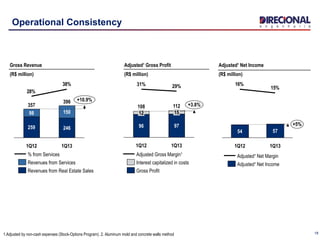
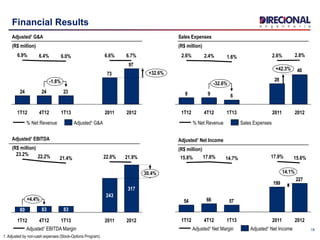
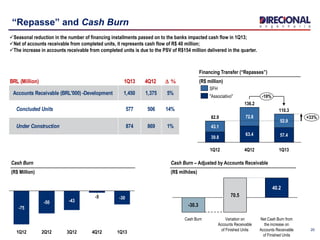
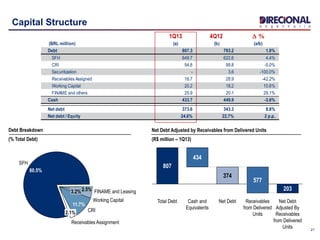
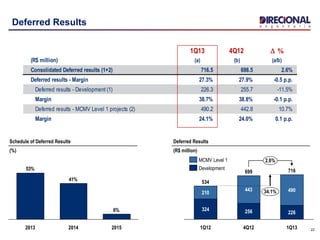
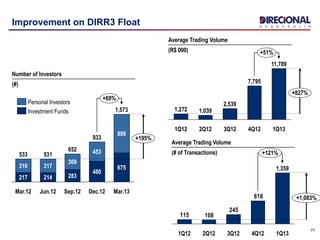
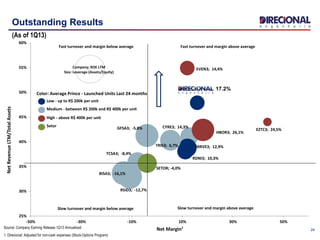
- Financial results show growing revenue, margins, and profitability over time as operations have expanded.