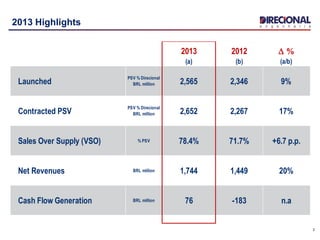
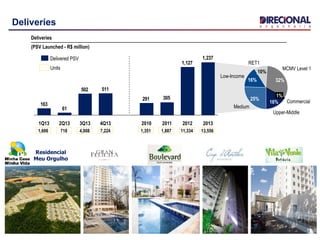
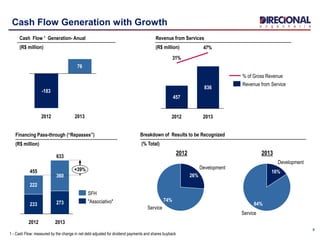
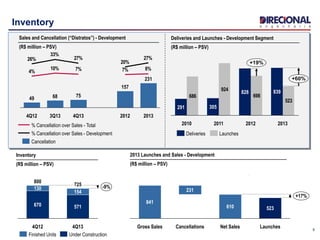
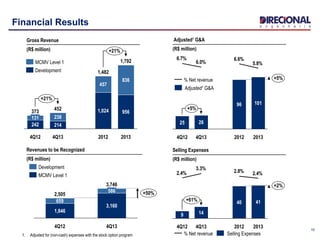
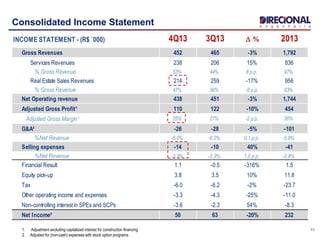
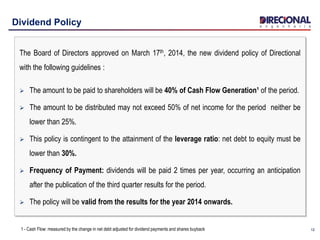
1
Earnings Release | Conference Call – 4Q13
March 18th, 2014
2
Agenda
Ricardo Ribeiro
Vice President
Carlos Wollenweber
CFO | IR Officer
Operational Highlights
Financial Highlights
2013 2012 D %
(a) (b) (a/b)
Launched
PSV % Direcional
BRL million 2,565 2,346 9%
Contracted PSV
PSV % Direcional
BRL million 2,652 2,267 17%
Sales Over Supply (VSO) % PSV 78.4% 71.7% +6.7 p.p.
Net Revenues BRL million 1,744 1,449 20%
Cash Flow Generation BRL million 76 -183 n.a
3
2013 Highlights
4
Launches
20% 14%
2013
82%
4%
2012
60%
20%
Launches by Region - Development
(% PSV)
16%
43%
27%
2013
24%
30%
3%
2012
33%
24%
Launches by Region - MCMV Level 1
(% PSV)
AP
MG
RJ
GO
CE
Launches 4Q13
2013:
 MCMV Level 1 represented 80% of the PSV launched;
 82% of the launches in the development segment were
in the southeast region.
+9%
2,565
+24%
2013
2,041
523
2012
2,346
1,647
698
Launched PSV
(R$ million)
MCMV Level 1
Development
SoutheastNorthMidwest Northeast
5
Net Sales and Inventory
Midweast 18%
North 51%
Southeast 31%
800
670
2013
-9%
2012
725
571
154
130
Under Construction
Finished Units
Inventory by Region
(% PSV)
Inventory
(PSV - R$ million)
North 38%
Southeast 44%
Midweast 18%
2012 2013
2,652
+17%
2013
2,041
610
2012
2,267
1,647
620
Contracted Net Sales
(PSV - R$ million)
MCMV Level 1
Development
21.1%
15.4%
21.2%
15.2%15.2%
55.1%
46.9%49.6%
40.7%
55.4%
3Q13 4Q132Q131Q134Q12
With MCMV Level 1 project
Without MCMV Level 1 project
Sales-over-supply ratio (VSO)¹
(% Total PSV)
1 - VSO ratio = Sales for the period / (Opening Inventory + Launches in the Period)
6
Deliveries
Deliveries
(PSV Launched - R$ million)
Units
1,606
1,237
1,127
305291
511502
61
163
20132012201120104Q133Q132Q131Q13
Delivered PSV
718 4,008 7,224
1%
MCMV Level 1
32%
RET1
Commercial
10%
Low-Income
16%
Medium
25%
Upper-Middle
16%
13,55611,3341,8871,351
Residencial
Meu Orgulho
7
Carlos Wollenweber
CFO | IR Officer
Financial Highlights
8
Cash Flow Generation with Growth
1 - Cash Flow: measured by the change in net debt adjusted for dividend payments and shares buyback
2013
76
2012
-183
Cash Flow ¹ Generation- Anual
(R$ million)
Financing Pass-through (“Repasses”)
(R$ million)
633
+39%
2013
273
360
2012
455
233
222
"Associativo"
SFH
Service
74%
Development
26%
Service
84%
Development
16%
Breakdown of Results to be Recognized
(% Total)
47%
31%
2013
836
2012
457
Revenue from Service
% of Gross Revenue
Revenue from Services
(R$ million)
20132012
9
Inventory
Sales and Cancellation (“Distratos”) - Development
(R$ million – PSV)
8%7%7%10%
4%
27%
20%
27%
33%
26%
4Q13 2013
231
2012
157
75
3Q13
68
4Q12
49
Cancellation
% Cancellation over Sales - Development
% Cancellation over Sales - Total
Inventory
(R$ million – PSV)
725 -9%
4Q13
571
154
4Q12
800
670
130
Under ConstructionFinished Units
2013 Launches and Sales - Development
(R$ million – PSV)
Deliveries and Launches - Development Segment
(R$ million – PSV)
686
924
698
523
+19%
+60%
2013
839
2012
828
2011
305
2010
291
LaunchesDeliveries
+17%
Launches
523
Net Sales
610
Cancellations
231
Gross Sales
841
10
Financial Results
1. Adjusted for (non-cash) expenses with the stock option program
Adjusted¹ G&A
(R$ million)
5.8%
6.6%
6.0%
6.7%
+5%
+5%
2013
101
2012
96
4Q13
26
4Q12
25
% Net revenue
Adjusted¹ G&A
Selling Expenses
(R$ million)
2.4%2.8%3.3%
2.4%
4Q13 2013
41
+2%
+61% 40
20124Q12
9 14
Selling Expenses% Net revenue
+50%
4Q134Q12
3,746
586
659
3,160
1,846
2,505
Development
MCMV Level 1
Revenues to be Recognized
(R$ million)
Gross Revenue
(R$ million)
1,024
457
2012
1,482
214
238
4Q13
452
242
131
4Q12
373
+21%
+21%
2013
1,792
956
836
Development
MCMV Level 1
INCOME STATEMENT - (R$ ´000) 4Q13 3Q13 D % 2013
Gross Revenues 452 465 -3% 1,792
Services Revenues 238 206 15% 836
% Gross Revenue 53% 44% 8 p.p. 47%
Real Estate Sales Revenues 214 259 -17% 956
% Gross Revenue 47% 56% -8 p.p. 53%
Net Operating revenue 438 451 -3% 1,744
Adjusted Gross Profit¹ 110 122 -10% 454
Adjusted Gross Margin¹ 25% 27% -2 p.p. 26%
G&A² -26 -28 -5% -101
%Net Revenue -6.0% -6.2% 0.1 p.p. -5.8%
Selling expenses -14 -10 40% -41
%Net Revenue -3.3% -2.3% 1.0 p.p. -2.4%
Financial Result 1.1 -0.5 -316% 1.5
Equity pick-up 3.8 3.5 10% 11.8
Tax -6.0 -6.2 -2% -23.7
Other operating income and expenses -3.3 -4.3 -25% -11.0
Non-controlling interest in SPEs and SCPs -3.6 -2.3 54% -8.3
Net Income² 50 63 -20% 232
1111
Consolidated Income Statement
1. Adjustment excluding capitalized interest for construction financing
2. Adjusted for (non-cash) expenses with stock option programs
1212
Dividend Policy
The Board of Directors approved on March 17th, 2014, the new dividend policy of Directional
with the following guidelines :
 The amount to be paid to shareholders will be 40% of Cash Flow Generation¹ of the period.
 The amount to be distributed may not exceed 50% of net income for the period neither be
lower than 25%.
 This policy is contingent to the attainment of the leverage ratio: net debt to equity must be
lower than 30%.
 Frequency of Payment: dividends will be paid 2 times per year, occurring an anticipation
after the publication of the third quarter results for the period.
 The policy will be valid from the results for the year 2014 onwards.
1 - Cash Flow: measured by the change in net debt adjusted for dividend payments and shares buyback
13
Disclosure and Contacts
This presentation contains certain forward-looking statements concerning the business prospects, projections of
operating and financial results and growth potential of the Company, which are based on management’s current
expectations and estimates of the future performance of the Company. Although the Company believes such
forward-looking statements are based on reasonable assumptions, it can give no assurance that its expectations
will be achieved. Expectations and estimates that are based on the future prospects of the Company are highly
dependent upon market behavior, Brazil’s political and economic situation, existing and future regulations of the
industry and international markets and, therefore, are subject to changes outside the Company’s and
management’s control. The Company undertakes no obligation to update any information contained herein or to
revise any forward-looking statement as a result of new information, future events or other information.
www.direcional.com.b/ir
ir@direcional.com.br
(55 31) 3214-6200
(55 31) 3214-6450
Carlos Wollenweber
CFO | IR Officer
Paulo Sousa
IR Coordinator
Luiz Felipe Almeida
IR Analist

4Q13 Disclosure and Results

  • 1.
    1 Earnings Release |Conference Call – 4Q13 March 18th, 2014
  • 2.
    2 Agenda Ricardo Ribeiro Vice President CarlosWollenweber CFO | IR Officer Operational Highlights Financial Highlights
  • 3.
    2013 2012 D% (a) (b) (a/b) Launched PSV % Direcional BRL million 2,565 2,346 9% Contracted PSV PSV % Direcional BRL million 2,652 2,267 17% Sales Over Supply (VSO) % PSV 78.4% 71.7% +6.7 p.p. Net Revenues BRL million 1,744 1,449 20% Cash Flow Generation BRL million 76 -183 n.a 3 2013 Highlights
  • 4.
    4 Launches 20% 14% 2013 82% 4% 2012 60% 20% Launches byRegion - Development (% PSV) 16% 43% 27% 2013 24% 30% 3% 2012 33% 24% Launches by Region - MCMV Level 1 (% PSV) AP MG RJ GO CE Launches 4Q13 2013:  MCMV Level 1 represented 80% of the PSV launched;  82% of the launches in the development segment were in the southeast region. +9% 2,565 +24% 2013 2,041 523 2012 2,346 1,647 698 Launched PSV (R$ million) MCMV Level 1 Development SoutheastNorthMidwest Northeast
  • 5.
    5 Net Sales andInventory Midweast 18% North 51% Southeast 31% 800 670 2013 -9% 2012 725 571 154 130 Under Construction Finished Units Inventory by Region (% PSV) Inventory (PSV - R$ million) North 38% Southeast 44% Midweast 18% 2012 2013 2,652 +17% 2013 2,041 610 2012 2,267 1,647 620 Contracted Net Sales (PSV - R$ million) MCMV Level 1 Development 21.1% 15.4% 21.2% 15.2%15.2% 55.1% 46.9%49.6% 40.7% 55.4% 3Q13 4Q132Q131Q134Q12 With MCMV Level 1 project Without MCMV Level 1 project Sales-over-supply ratio (VSO)¹ (% Total PSV) 1 - VSO ratio = Sales for the period / (Opening Inventory + Launches in the Period)
  • 6.
    6 Deliveries Deliveries (PSV Launched -R$ million) Units 1,606 1,237 1,127 305291 511502 61 163 20132012201120104Q133Q132Q131Q13 Delivered PSV 718 4,008 7,224 1% MCMV Level 1 32% RET1 Commercial 10% Low-Income 16% Medium 25% Upper-Middle 16% 13,55611,3341,8871,351 Residencial Meu Orgulho
  • 7.
    7 Carlos Wollenweber CFO |IR Officer Financial Highlights
  • 8.
    8 Cash Flow Generationwith Growth 1 - Cash Flow: measured by the change in net debt adjusted for dividend payments and shares buyback 2013 76 2012 -183 Cash Flow ¹ Generation- Anual (R$ million) Financing Pass-through (“Repasses”) (R$ million) 633 +39% 2013 273 360 2012 455 233 222 "Associativo" SFH Service 74% Development 26% Service 84% Development 16% Breakdown of Results to be Recognized (% Total) 47% 31% 2013 836 2012 457 Revenue from Service % of Gross Revenue Revenue from Services (R$ million) 20132012
  • 9.
    9 Inventory Sales and Cancellation(“Distratos”) - Development (R$ million – PSV) 8%7%7%10% 4% 27% 20% 27% 33% 26% 4Q13 2013 231 2012 157 75 3Q13 68 4Q12 49 Cancellation % Cancellation over Sales - Development % Cancellation over Sales - Total Inventory (R$ million – PSV) 725 -9% 4Q13 571 154 4Q12 800 670 130 Under ConstructionFinished Units 2013 Launches and Sales - Development (R$ million – PSV) Deliveries and Launches - Development Segment (R$ million – PSV) 686 924 698 523 +19% +60% 2013 839 2012 828 2011 305 2010 291 LaunchesDeliveries +17% Launches 523 Net Sales 610 Cancellations 231 Gross Sales 841
  • 10.
    10 Financial Results 1. Adjustedfor (non-cash) expenses with the stock option program Adjusted¹ G&A (R$ million) 5.8% 6.6% 6.0% 6.7% +5% +5% 2013 101 2012 96 4Q13 26 4Q12 25 % Net revenue Adjusted¹ G&A Selling Expenses (R$ million) 2.4%2.8%3.3% 2.4% 4Q13 2013 41 +2% +61% 40 20124Q12 9 14 Selling Expenses% Net revenue +50% 4Q134Q12 3,746 586 659 3,160 1,846 2,505 Development MCMV Level 1 Revenues to be Recognized (R$ million) Gross Revenue (R$ million) 1,024 457 2012 1,482 214 238 4Q13 452 242 131 4Q12 373 +21% +21% 2013 1,792 956 836 Development MCMV Level 1
  • 11.
    INCOME STATEMENT -(R$ ´000) 4Q13 3Q13 D % 2013 Gross Revenues 452 465 -3% 1,792 Services Revenues 238 206 15% 836 % Gross Revenue 53% 44% 8 p.p. 47% Real Estate Sales Revenues 214 259 -17% 956 % Gross Revenue 47% 56% -8 p.p. 53% Net Operating revenue 438 451 -3% 1,744 Adjusted Gross Profit¹ 110 122 -10% 454 Adjusted Gross Margin¹ 25% 27% -2 p.p. 26% G&A² -26 -28 -5% -101 %Net Revenue -6.0% -6.2% 0.1 p.p. -5.8% Selling expenses -14 -10 40% -41 %Net Revenue -3.3% -2.3% 1.0 p.p. -2.4% Financial Result 1.1 -0.5 -316% 1.5 Equity pick-up 3.8 3.5 10% 11.8 Tax -6.0 -6.2 -2% -23.7 Other operating income and expenses -3.3 -4.3 -25% -11.0 Non-controlling interest in SPEs and SCPs -3.6 -2.3 54% -8.3 Net Income² 50 63 -20% 232 1111 Consolidated Income Statement 1. Adjustment excluding capitalized interest for construction financing 2. Adjusted for (non-cash) expenses with stock option programs
  • 12.
    1212 Dividend Policy The Boardof Directors approved on March 17th, 2014, the new dividend policy of Directional with the following guidelines :  The amount to be paid to shareholders will be 40% of Cash Flow Generation¹ of the period.  The amount to be distributed may not exceed 50% of net income for the period neither be lower than 25%.  This policy is contingent to the attainment of the leverage ratio: net debt to equity must be lower than 30%.  Frequency of Payment: dividends will be paid 2 times per year, occurring an anticipation after the publication of the third quarter results for the period.  The policy will be valid from the results for the year 2014 onwards. 1 - Cash Flow: measured by the change in net debt adjusted for dividend payments and shares buyback
  • 13.
    13 Disclosure and Contacts Thispresentation contains certain forward-looking statements concerning the business prospects, projections of operating and financial results and growth potential of the Company, which are based on management’s current expectations and estimates of the future performance of the Company. Although the Company believes such forward-looking statements are based on reasonable assumptions, it can give no assurance that its expectations will be achieved. Expectations and estimates that are based on the future prospects of the Company are highly dependent upon market behavior, Brazil’s political and economic situation, existing and future regulations of the industry and international markets and, therefore, are subject to changes outside the Company’s and management’s control. The Company undertakes no obligation to update any information contained herein or to revise any forward-looking statement as a result of new information, future events or other information. www.direcional.com.b/ir ir@direcional.com.br (55 31) 3214-6200 (55 31) 3214-6450 Carlos Wollenweber CFO | IR Officer Paulo Sousa IR Coordinator Luiz Felipe Almeida IR Analist