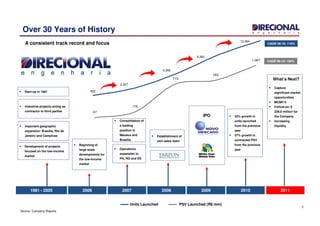
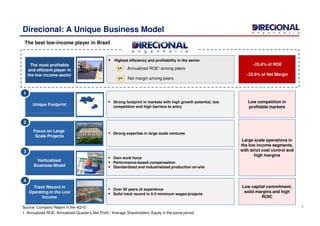
SlideShare a Scribd company logo
1
Corporate Presentation
12a Conferência Anual Santander
Disclaimer
This presentation may contain forward-looking statements. Such forward-looking statements are and will be subject to many risks
and uncertainties relating to factors that are beyond Direcional’s ability to control or estimate precisely, such as future market
conditions, competitive environment, currency and inflation fluctuations, changes in governmental and regulatory policies and other
factors relating to the operations of Direcional, which may cause actual future results of Direcional to differ materially from those
expressed or implied in such forward-looking statements
You are cautioned not to place undue reliance on these forward-looking statements, which speak only as of the date of this
presentation. Such forward-looking statements shall not be construed as guarantee of future performance. Direcional does not
undertake to publicly review or update these forward-looking statements in view of events or circumstances occurring after the date
2
undertake to publicly review or update these forward-looking statements in view of events or circumstances occurring after the date
of this presentation
This presentation does not constitute an offer, or invitation, or solicitation of an offer, to subscribe for or purchase any securities.
Neither this presentation nor anything contained herein shall form the basis of any contract or commitment whatsoever
This presentation and its contents are proprietary information and may not be reproduced or otherwise disseminated in whole or in
part without Direcional’s prior written consent.
652
2,227
5,359
9,360
12,364
Start-up in 1981
Industrial projects acting as
contractor to third parties
IPO
Over 30 Years of History
A consistent track record and focus
Capture
significant market
opportunities
MCMV II
Follow-on: $
228.8 million for
What’s Next?
CAGR 06-10: 110%
CAGR 06-10: 100%
67
176
710
783
1,067
Development of projects
focused on the low-income
market
Beginning of
large scale
developments for
the low-income
market
Operations
expansion to
PA, RO and ES
IPO 32% growth in
units launched
from the previous
year
57% growth in
contracted PSV
from the previous
year
3
Source: Company Reports
Units Launched
Consolidation of
a leading
position in
Manaus and
Brasilia
Establishment of
own sales team
Important geographic
expansion: Brasília, Rio de
Janeiro and Campinas
1981 - 2005 2006 2007 2008 2009 2010 2011
228.8 million for
the Company
Increasing
liquidity
PSV Launched (R$ mm)
67
Management Team
Ricardo Valadares Gontijo
Chairman & CEO
Ricardo Valadares Gontijo
Chairman & CEO
• Founder, CEO and Chairman of the Board
40 years of construction experience
• Civil Engineer graduated by UFMG with Gold Medal Award.
Ricardo Ribeiro Gontijo
Commercial Officer
Ricardo Ribeiro Gontijo
Commercial Officer
Roberto Senna
General Manager
Roberto Senna
General Manager
• Civil Engineer degree from The Universidade Federal da Bahia, MBA degree from FGV and specialization courses
at the Wharton School - University of Philadelphia, and University of Carlifornia - Irvine.
• Joined Odebrecht Group in 1979 and has held senior management positions in Brazil and abroad
• He was President of Metro-Rio, Director of Telemar Holding and member of the Board of several companies of the
group.
• He was CEO of Bairro Novo, a real estate subsidiary from Odebrecht Group, focused on residential development
and construction in the low income
•Board Member and responsible for Marketing, Sales and New Business
•Civil Engineer graduated by UFMG with the Gold Medal Award
•Joined Direcional in 2004.
4
Commercial OfficerCommercial Officer
Carlos Wollenweber
CFO & IR Officer
Carlos Wollenweber
CFO & IR Officer
Lucas Rocha
Engineering Officer
Lucas Rocha
Engineering Officer
Ana Carolina Huss
Human Resources Officer
Ana Carolina Huss
Human Resources Officer
•Joined Direcional in 2004.
•Extensive experience in the Brazilian real estate market.
•From 2007 to 2009, Controller of BR Properties
•From 2005 to 2007, Financial Director of Valora
•From 2001 to 2005, Financial Manager of Gafisa
•Electrical Engineer graduated by PUC / SP has master degree in Economics and Finance at PUC / SP and MBA
degree at MIT (Massachusetts Institute of Technology)
•Responsible for the engineering department with more than 30 years of experience in construction
•Holds a bachelor’s degree in Civil Engineering
•Joined Direcional in 1985
• Psychologist, graduated at University Paulista, MBA in Business Management, post graduate in Knowledge
Management at FVG and certified in Bright Link in professional coaching
• Human Resources Manager at Natura Cosméticos and Accor Brasil
• Responsible for the department ¨People and Organization¨ of the Bairro Novo, a company of the Odebrecht group.
Shareholder’s Structure
46.9% 15.0%
Filadélphia
Participações S.A. 1 GICTarpon2 Other
7.1% 24.1%
Ridgecrest, LLC
6.9%
51. Holding owbed by Ricardo Valadares Gontijo and his family
2. Funds managed by Tarpon Investimentos S.A.
6
Business Model
6
Unique Footprint
Strong footprint in markets with high growth potential, low
competition and high barriers to entry
Low competition in
profitable markets
Direcional: A Unique Business Model
The best low-income player in Brazil
The most profitable
and efficient player in
the low income sector
‘’’’‘
Highest efficiency and profitability in the sector
1st Annualized ROE¹ among peers
~25.8% of ROE
~22.6% of Net Margin
1st Net margin among peers
1
Track Record in
Operating in the Low
Income
Over 30 years of experience
Solid track record in 0-3 minimum wages projects
Low capital commitment,
solid margins and high
ROIC
Focus on Large
Scale Projects
Verticalized
Business Model
Strong expertise in large scale ventures
Own work force
Performance-based compensation
Standardized and industrialized production on-site
Large scale operations in
the low income segments,
with strict cost control and
high margins
7Source: Company Report in the 4Q10
1. Annualized ROE: Annualized Quarter’s Net Profit / Average Shareholders' Equity in the same period
2
3
4
Unique Footprint: High Growth Markets with Barriers to Entry
Land Bank Composition Barriers to Entry
Detailed mapping of logistics and supply
Scarcity of
Suppliers
Industrialization of raw materials
Vertically integrated model is rapidly
replicated
Direcional's Approach
1
Direcional is the leading company in underpenetrated markets with high growth potential
AM
13.5%
RO
3.9%
PA
13.4%
8
Complex
Logistics
Detailed mapping of logistics and supply
channels
Large and vertically integrated projects
Adverse
Weather
Conditions
Pre-manufactured building materials adapted
to diverse climates
Expertise in coordinating construction cycle
and weather demands
Unskilled
Labor
Highly-trained workers
Standardized and fully-integrated
construction
Compensation based on performance
“MINHA CASA, MINHA VIDA”
49.9k units elegible for the program
73.4% of total Land bank
Source: Company Report
ES
1.5%
MG
37.8%
SP
6.4%
DF
22.5%
RJ
1.1%
Popular,
52.8%
Commercial,
4.2% Medium,
36.1%
Upper
Middle,
6.9%
Segment Breakdown
(PSV)
Focus on Large Scale Projects …
Strong and unique expertise in large scale ventures
2
Large Scale Projects¹ Main Advantages of Scale
Economies of Scale
Industrialization process of raw
materials
Manaus Total Ville AM Under construction 3.848 2.136
Total Ville Bella Cittá PA Under construction 4.938 3.316
Total Ville Marabá PA Under construction 5.604 4.664
Allegro Residencial Club AM Under construction 1.648 704
Setor Total Ville DF Under construction 4.362 2.064
Total Ville Porto Velho RO Under construction 2.852 1.868
Dream Park ES Under construction 1.034 752
Project Status Total Units
Units to be
launched
9Source: Company Report
1. Projects with more than 1,000 units
Optimize construction processes
Urbanized projects
Lower Execution Risk
Lower Inflation Risk78.3% of the units to be launched in large scale projects1
16 projects with close to 65 thousand units
Eliza Miranda AM Under construction 1.406 128
Cachoeiras do Madeira RO Under construction 1.278 426
Total Ville Macaé RJ Under construction 1.145 399
Águas Claras DF To be Launched 1.148 1.148
Floramar MG To be Launched 1.172 1.172
Granjas Werneck MG To be Launched 15.000 15.000
Sítio São João MG To be Launched 2.500 2.500
Ferroeste MG To be Launched 2.388 2.388
Samambaia DF To be Launched 14.614 14.614
Total 64.937 53.279
Licensed Projects
… Through a Verticalized Business Model
More than 11,000 exclusive workers assuring quality, commitment, efficiency and cost control
Verticalized Business Model Ability to Deliver
3
Best Execution in the SectorBest Execution in the Sector
Construction DNAConstruction DNA
Own Work Force
VerticalizationVerticalization
Standardized / Industrialization
10
Performance Based
Compensation
Capacity to Hire and Train
Operational Team
Lower Turnover
On Schedule:
Projects Delivered on Time
With High Quality:
Lower Maintenance Cost
On Budget:
Margin Stability
Own Work Force Standardized / Industrialization
Economies of Scale
All projects are based on few
designs
Source: Company Report
Unique Expertise in the Low Income Segment
Solid track record in all the low income segments
Characteristics
Developer approach
̶ Companies develop projects and
sell units to customers
Price above R$170 k / unit
CAIXA does not facilitate customer
financing
Developer approach
̶ Companies develop projects and
sell units to customers
Price is capped at R$170 k / unit
CAIXA facilitates customer financing
Builder approach
̶ Homebuilders present projects to
Caixa for evaluation and approval
Normally land/infrastructure is given by
local Government
Price is capped at R$51 k / unit
4
Mid / Low Income Low Income (MCMV – 4-10 MW) Very Low Income (MCMV – 0-3 MW)+ +
11
1. Company estimates – maximum cash exposure in % of total PSV
Main Players
Equity Commitment1
Units Launched
2010
~5%~15%~20% ~10%
60% / 7,391 units12% / 1,503 units 28% / 3,470 units
PSV Launched
2010
36% / R$ 380 mm23% / R$ 245 mm 41% / R$ 441 mm
Top Notch Operational Performance
Direcional has been confirming its efficient cash cycle with sound financial results
Efficient Cash Cycle Highest Results in the Sector
Land
Acquisition
Sales
Speed
Land
Acquisition
Sales
Speed
38% VSO80% Swaps
19%
24%
MRV
PDG
Helbor
12
Efficient Cash
Cycle Management
Cash
Collection
Austere
Budget
Client
Financing
Construction
Financing
Cash
Collection
Austere
Budget
Client
Financing
Construction
Financing
Avg. Unit Selling Price
NetMargin2010
Source: Company Reports in the 4Q10
80-100% of
construction
cost
G&A of 6% of
Revenues
4%
9%
14%
- 150.000 300.000 450.000
CCDI
Rodobens
PDG
Even
Inpar
Cyrela
Tecnisa
Rossi
Trisul
Gafisa
13
Growth Drivers
13
MCMV Program Highlights
The largest housing program of the Brazilian history
First Priority of the New Government and currently at full
speed with Dilma’s recent election
The 0-3 segment has expanded three-fold, reaching 1.2
Growth Drivers: MCMV 2nd Phase
0-3 segment presents an outstanding growth opportunity
600,000
200,000
200,000
BRL 34 billion
1.000.000 uniits
BRL 72 billion
2.000.000 units
4-6
Wages
7-10
Wages
Total
(R$'000)
% Direcional
(R$'000)
Residencial meu Orgulho - 1ª Fase * Jun Manaus -AM 190,598 190,598 3,511
Bairro Carioca Oct Rio de Janeiro - RJ 114,240 114,240 2,240
Residencial Jardim Alterosa Dec Belo Horizonte - MG 75,440 75,440 1,640
Total 2010 380,278 380,278 7,391
2010 Projects
Launch
Date
City - State
PSV
Nr. of
Units
The 0-3 segment has expanded three-fold, reaching 1.2
million units
The regional distribution of the program should benefit
Direcional
14
400,000
1,200,000400,000
200,000
MCMV1 MCMV2
0-3
Wages
Growth Drivers: Selective Geographic Expansion
Direcional operates in Brazil’s most complex markets and expects to replicate this model in new attractive areas
Development of 0-3 MW Projects
Geographic Expansion Strategy New Sites Selection Criteria
High Housing Demand
Access to Credit Lines
15
Immediate gain of market share and visibility
New projects leveraging on our unique business
model
Access to Credit Lines
Operational Complexity & Region Expertise
Land Availability
16
Operating Highlights
2Q11 and 1H11
16
158
288 300
511191
191
131
131
176
710 783
1,067
511
Launches
+82%
CAGR 07-10: 82%
+71%
Launched PSV
(R$ million)
Launched PSV - Evolution
(R$ million)
Total
(R$'000)
% Direcional
(R$'000)
1 Verano Residencial - 1st Phase April Belém - PA 36,968 36,931 184 539 Medium
2 Total Ville Macaé - 2nd Phase - RET 1 April Macaé - RJ 27,264 13,632 340 1,145 Popular
3 Parque Ponta Negra - 3rd Phase April Manaus - AM 47,711 47,706 137 820 Upper-Middle
4 Tulip Inn Savassi - Hotel June Belo Horizonte - MG 86,238 85,376 240 240 Commercial
5 Total Ville Vida Nova - 3rd Phase - RET 1 June Manaus - AM 56,400 56,344 752 3,848 Popular
6 Bella Città Algodoal - 3rd Phase - RET 1 June Marituba - PA 48,000 47,995 640 4,938 Popular
302,581 287,984 2,293 11,530
1 Acquisition of Project - Parque Ponta Negra May Manaus - AM 131,289 131,289 545 n/a Medium
433,870 419,272 2,838 11,530
# of Units
Launched
Total Units
(All Phases)
Segment
Launches 2Q11
Launches + Project Acquisition
2Q11 Projects Date City - State
PSV
2Q10 2Q11 1H10 1H11
Development 0-3 mw projects ProjectAcquisition
176
2007 2008 2009 2010 1H11
17
54.6%
65.6%
58.1% 56.2%
45.4% 37.7%
9.7%
34.4%
4.2%
34.0%
2Q10 2Q11 1H10 1H11
Launches Breakdown
Launches
(Segment Breakdown – PSV)
Launches
(Geographic Breakdown - PSV)
54,6%
38,9%
7,7%
41,0%
30,0%
35,9%
37,5%
12,8%
26,7%
34,8%
16,6%
4,2%
9,3%
29,6%
20,0%
2Q10 2Q11 1H10 1H112Q10 2Q11 1H10 1H11
North Midwest Southeast
Tulip Inn Savassi - Hotel – PSV R$ 85.4 MM Total Ville Vida Nova 3rd phase – PSV R$ 56.4 MMVerano Residencial – PSV R$ 36.9 MM
18
Parque Ponta Negra – PSV R$ 47.7 MMTotal Ville Macaé 2nd phase – PSV R$ 13.6 MMBella Cittá Algodoal – PSV R$ 47.9 MM
2Q10 2Q11 1H10 1H11
0 - 3 MW Popular Medium Upper Middle Commercial
127
441
661
1,037
344133 169
297 344
191
191
89
89
Sales
CAGR 07-10: 101%
+27%
+16%
Contracted PSV
(R$ million)
Contracted PSV - Evolution
(R$ million)
58,9%
39,1%
24,2%
24,3%
36,5%
30,4%
9,2%
47,2%
13,7%
49,4%
7,8%
11,8%
10,8%
10,4%
16,7% 9,7%
2Q10 2Q11 1H10 1H11
0 - 3 MW Popular Medium Upper Middle Commercial
77.9%
48.1%
72.8%
40.1%
13.2%
19.8%
17.0%
21.7%
8.9%
32.1%
10.2%
38.2%
2Q10 2Q11 1H10 1H11
North Midwest Southeast
2007 2008 2009 2010 1H112Q10 2Q11 1H10 1H11
Development 0-3 mw projects Project Acquisition
19
Sales
(Geographic Breakdown)
Sales
(Segment Breakdown)
33.8%
38.3%
Sales Speed
Sales Over Supply of 18.5% in 2Q11.
Under RET1, a purchase agreement only becomes effective after CEF approves the mortgage credit facility. If we do not consider RET1
projects, Sales Over Supply would achieve 20.6%, whereas 51%* of the units launched in 2Q11 were sold during the same quarter
Sales Over Supply (VSO)
(Total PSV)
Sales Speed (%)
(Units)
20% 31%2T11 51%*
20.6%
23.7%
19.4% 20.8%
27.6%
22.1%
18.5%
1Q10 2Q10 3Q10 4Q10 1Q11 2Q11
With 0.3. MW project Without 0.3. mw project
20
2Q10 and 4Q10: the sales speed was positively impacted by the immediate
recognition 0-3 m.w. construction contracts
2Q11: was inegatively mpacted by the RET1 projects, in which sales are
subject to the mortgage facility approval from CEF.
* Not considering RET1 projects
Ex-RET1 project
89%
17%
87%
48%
4%
27%
4%
21%
3%
14%
1%2T10
3T10
4T10
1T11
3M 6M 9M 12M 15M
69%
92%
67%
97%
51%*
Concluded Projects - 2Q11
Total
(R$'000)
% Direcional
(R$'000)
1 Equilibrium Manaus - AM 49,501 43,561 136
2 Águas do Madeira Porto Velho - RO 61,520 40,973 426
3 Grand Prix Manaus - AM 42,026 36,983 192
4 Lake View Resort Brasília - DF 89,513 87,812 232
5 Garden Club - 1st Phase Porto Velho- RO 34,394 27,515 313
6 Dream Park Serra - ES 44,629 35,704 282
Completed Projects - 2Q11 321,584 272,547 1,581
Completed Projects - 2Q11 City - State
PSV
# of Units
21
Completed Projects - 2Q11 321,584 272,547 1,581
22
Operating and Financials Highlights
1H11 and 2Q11
22
Highlights
158
288 300
511191
191
131
131
2Q10 2Q11 1H10 1H11
176
710 783
1,067
511
2007 2008 2009 2010 1H11
+82%
CAGR 07-10: 82%
+71%
Launched PSV
(R$ million)
Launched PSV - Evolution
(R$ million)
102,3
263,2
377,6
781,9
478,7
21,1%
24,5%
22,5% 22,6%
19,1%
0,0%
5,0%
10,0%
15,0%
20,0%
25,0%
30,0%
0,0
100,0
200,0
300,0
400,0
500,0
600,0
700,0
800,0
900,0
2007 2008 2009 2010 1H11
Adjusted net Margin (%) 23
2Q10 2Q11 1H10 1H11
Development 0-3 mw projects ProjectAcquisition
2007 2008 2009 2010 1H11
+48%
+55%
Net Revenues
(R$ million)
CAGR: 97,0%
Net Revenues - Evolution
(R$ million)
165
245
308
479
2Q10 2Q11 1H10 1H11
14,9 20,7 33,0 48,2 56,8 57,7 35,6 114,5
10,1% 12,2%
15,2%
17,7%
23,8% 23,0%
11,2%
23,4%
1Q10 2Q10 3Q10 4Q10 1Q11 2Q11 1H10 1H11
Revenue of Services Evolution
Highlights
1Q10 – 2Q11 Growth: +286,7% + 222%
1Q10 2Q10 3Q10 4Q10 1Q11 2Q11 1H10 1H11
% Gross Revenue
24
Gross Revenue Breakdown: 1H11
Development,
76.6%
Management
Fee, 0.8%
0-3 MW
Projects, 22.1%
Brokerage,
0.5%
Cash Position
Loans and Financing
(ex- securitization)
Cash Position 2Q11 1Q11 4Q10 ∆∆∆∆ % ∆∆∆∆ %
(R$'000) (a) (b) (c) (a/b) (a/c)
Loans and Financing 408,630 348,307 302,374 17.3% 35.1%
SFH 341,303 282,674 226,056 20.7% 51.0%
Securitization of receivables 37,216 36,429 46,843 2.2% -20.6%
FINAME and others 9,149 8,611 8,882 6.2% 3.0%
Working Capital 20,962 20,593 20,593 1.8% 1.8%
Cash and Cash Equivalents 381,768 355,410 190,852 7.4% 100.0%
Net debt 26,862 -7,103 111,522
Net debt / Equity 2.3% -0.7% 14.1%
SFH, 91.9%
Securitizati
on of
receivables,
2.5%
Working
Capital,
5.6%
14,522
25,312 22,468
32,657
41,236
73,695
86,301
100,873
64,967
33,965
1Q09 2Q09 3Q09 4Q09 1Q10 2Q10 3Q10 4Q10 1Q11* 2Q11
Moving Average of Last 4 Quarters
25
Cash Burn¹ (R$ million)
-36%
-48%
1. Cash Burn: measured by the variation of the net debt, less capital increases
* 1Q11: Adjusted by R$ 223,8 million of follow-on and R$ 40.3 million of dividends payment
Majority
Shareholder
Tarpon
15,0%
Ridgecrest
6,9%
GIC
6,9%
Follow-On
20.8 million new shares were issued in the primary offer and 7.2 million sold in the secondary offering
Increased the free float from 39.5% to 53.1%.
Before Follow On After Follow On
Controlling
60.5%
Tarpon
15.0%
Ridgecrest
8.0%
Shareholder
46,9% Others
24,3%
540,3
1.808,3
Before Follow On After Follow On
86
195
224
414
Dec. / 10 May/ 11
Investments Funds Individuals 26
60.5% 8.0%
GIC
3.6%Other
12.9%
Average Daily Volume¹
(R$’000)
+235%+76%
Total # of Shareholders
1: five months before follow-on and five months after follow-on.
Shares Performance Since IPO
Since IPO
DIRR3: +4,2%
IBOVESPA: -6,2%
IMOB: -1,3%
80
100
120
140
160
5.000
6.000
7.000
8.000
9.000
10.000
PreçodaAção
Volume(R$mil)
80
100
120
140
160
5.000
6.000
7.000
8.000
9.000
10.000
StockPerformace
Volume(R$'000)
Before Follow On After Follow On
27
0
20
40
60
80
-
1.000
2.000
3.000
4.000
5.000
19-nov-09
3-dez-09
16-dez-09
4-jan-10
15-jan-10
29-jan-10
11-fev-10
26-fev-10
11-mar-10
24-mar-10
7-abr-10
20-abr-10
4-mai-10
17-mai-10
31-mai-10
15-jun-10
28-jun-10
12-jul-10
26-jul-10
10-ago-10
24-ago-10
13-set-10
30-set-10
14-out-10
27-out-10
10-nov-10
26-nov-10
9-dez-10
27-dez-10
10-jan-11
21-jan-11
4-fev-11
17-fev-11
2-mar-11
17-mar-11
30-mar-11
12-abr-11
27-abr-11
10-mai-11
23-mai-11
3-jun-11
16-jun-11
30-jun-11
PreçodaAção
Volume(R$mil)
Volume (R$ mil)
0
20
40
60
80
-
1.000
2.000
3.000
4.000
5.000
18-Nov-09
02-Dec-09
15-Dec-09
30-Dec-09
14-Jan-10
28-Jan-10
10-Feb-10
25-Feb-10
10-Mar-10
23-Mar-10
06-Apr-10
19-Apr-10
03-May-10
14-May-10
28-May-10
14-Jun-10
25-Jun-10
08-Jul-10
23-Jul-10
06-Aug-10
23-Aug-10
10-Sep-10
29-Sep-10
13-Oct-10
26-Oct-10
09-Nov-10
25-Nov-10
08-Dec-10
23-Dec-10
07-Jan-11
20-Jan-11
03-Feb-11
16-Feb-11
01-Mar-11
16-Mar-11
29-Mar-11
11-Apr-11
26-Apr-11
09-May-11
20-May-11
02-Jun-11
15-Jun-11
29-Jun-11
StockPerformace
Volume(R$'000)
Average Volume (21 days) Direcional Ibovespa IMOB
28
Appendix
28
115
120
500
600
Rising Income
▲ Basic Goods Basket
▲ Real Minimum Wage
▲ Average Wage (Monthly)
HOUSEHOLDS’ DISPOSABLE INCOME
(Jan/03 – Aug/10)
Emerging Class C
EMERGING CLASS C (1)
(% households, 2003 – 2009)
Positive Job Market Trends
Poised to Capitalize on Soaring Demand
+ +
Brazil’s social upward mobility has favored the sector
‘04-’10 EMPLOYMENT GROWTH
(%, Jan/04 – Nov/10)
50%
58%
27%
38%
3%
6%
9%
12%
15%
Jan-03
Oct-03
Jul-04
Apr-05
Jan-06
Oct-06
Jul-07
Apr-08
Jan-09
Oct-09
Jul-10
Apr-11
90
95
100
105
110
-
100
200
300
400
jan/03 out/05 jul/08 abr/11
29
The steady increase of household disposable
income, along with a higher availability of
housing credit, drives the search for new
homes
29 million individuals entered the class C
income segment in the last 6 years, and 18
million are expected to join it in the next 5
years
Source: FGV (A Nova Classe Média: O Lado Brilhante dos Pobres), DIEESE, IPEA and McCann Erickson do Brasil
1. Households earning R$1,126 to R$4,854 per month.
2.2x
1.8x
UNEMPLOYMENT RATE
(%, 12-month moving average)
37%
2003 2009 2014
66mm 95mm
+29mm
113mm
+18mm
-3%
Total Formal Informal
Jan-04 - Abr-11 %
Min 5,3%
Max 13,1%
Nov/10 6,4%
Average of 12M 6,4%
Corporate Governance
Board of Directors
Shareholderes
► Own Governance Standards
► Nominate Members to the Board of
Directors
Advisory Committees
► Nominated by the Board of
Directors
► Not deliberative
Investment
Committee
Finance
Committee
Compensation
Committee
► Fixed Assets
► Diversification
► Mergers and Acquisitions
► Cash Management Policies
► Capital Structure
► Risk Management
Board of Executive Officers
Operations
► Not deliberative
► Bi-monthly meetings or ad-hoc
Deliberative Committees
► Board of Directors + Directors +
Guests
► Monthly meetings or ad-hoc
Committee
Investment
Committees
Engineering
Committee
Human
Resource
Committee
► Land bank purchases
► Launchings
► Pre-budget approval (release)
► Approval of budget and
planning (beginning work)
► Performance Valuation
► Variable Compensation
30
Company Structure
Engineering/
Construction
Detailed Design
Health, Safety &
Environment
AdministrativeSu
pport
Quality/
Technology
AM
DF,PA,RO
MG,ES
SP,RJ
CFO / IR
HR Budget/Supply/
Planning
Shareholders
Clients
31Source: Company
Development /
Commercial
Viability Studies
Market
Support/Sales
Conceptual
Design /
Products
Legal
(Real Estate)
AM
Special Projects
(“0 – 3”)
President CEO
Legal
(Corporate)
Comunic. &
Market. Corp.
Sustainability/Cu
stomer
Relationship
Guidelines
Results
Shareholders
MG,ES
DF,PA,RO
SP,RJ
Clients
Contacts
Carlos Wollenweber
CFO | IR Officer
Lucas Bousas
IR Analyst
32
IR Analyst
Paulo Sousa
IR Analyst
www.direcional.com.br
ri@direcional.com.br
(55 31) 3214-6200
(55 31) 3214-6450

More Related Content

Viewers also liked

Colors - Photo Essay
Colors - Photo EssayColors - Photo Essay
Colors - Photo EssayMichele_Rempe
 
Самые "социальные" новостные СМИ: Facebook
Самые "социальные" новостные СМИ: FacebookСамые "социальные" новостные СМИ: Facebook
Самые "социальные" новостные СМИ: Facebook
Roden Media
 
Astrochemistry
AstrochemistryAstrochemistry
Astrochemistry
mert baki
 
Lanzamiento interno DISGO - Centro de convenciones de Barranco
Lanzamiento interno DISGO - Centro de convenciones de BarrancoLanzamiento interno DISGO - Centro de convenciones de Barranco
Lanzamiento interno DISGO - Centro de convenciones de Barranco
Juan Manuel Torres Loayza
 
Monografia para apresentar1
Monografia para apresentar1Monografia para apresentar1
Monografia para apresentar1
Vilma Santos
 
The Hateful Eight (2016)
The Hateful Eight (2016)The Hateful Eight (2016)
The Hateful Eight (2016)
Josh Pamfilo
 
Midcamp2016
Midcamp2016Midcamp2016
Ejemplos regla de tres
Ejemplos regla de tresEjemplos regla de tres
Ejemplos regla de tres
Donaldo Cardona Vasquez
 
10 secretos del marketing de guerrilla.
10 secretos del marketing de guerrilla.10 secretos del marketing de guerrilla.
10 secretos del marketing de guerrilla.
Interlat
 
Environmental Laws
Environmental LawsEnvironmental Laws
Environmental Laws
Shubham Goel
 
Marine Litter Management in Nigeria
Marine Litter Management in NigeriaMarine Litter Management in Nigeria
Marine Litter Management in Nigeria
Dr. Felicia Chinwe Mogo
 

Viewers also liked (11)

Colors - Photo Essay
Colors - Photo EssayColors - Photo Essay
Colors - Photo Essay
 
Самые "социальные" новостные СМИ: Facebook
Самые "социальные" новостные СМИ: FacebookСамые "социальные" новостные СМИ: Facebook
Самые "социальные" новостные СМИ: Facebook
 
Astrochemistry
AstrochemistryAstrochemistry
Astrochemistry
 
Lanzamiento interno DISGO - Centro de convenciones de Barranco
Lanzamiento interno DISGO - Centro de convenciones de BarrancoLanzamiento interno DISGO - Centro de convenciones de Barranco
Lanzamiento interno DISGO - Centro de convenciones de Barranco
 
Monografia para apresentar1
Monografia para apresentar1Monografia para apresentar1
Monografia para apresentar1
 
The Hateful Eight (2016)
The Hateful Eight (2016)The Hateful Eight (2016)
The Hateful Eight (2016)
 
Midcamp2016
Midcamp2016Midcamp2016
Midcamp2016
 
Ejemplos regla de tres
Ejemplos regla de tresEjemplos regla de tres
Ejemplos regla de tres
 
10 secretos del marketing de guerrilla.
10 secretos del marketing de guerrilla.10 secretos del marketing de guerrilla.
10 secretos del marketing de guerrilla.
 
Environmental Laws
Environmental LawsEnvironmental Laws
Environmental Laws
 
Marine Litter Management in Nigeria
Marine Litter Management in NigeriaMarine Litter Management in Nigeria
Marine Litter Management in Nigeria
 

Similar to 12 Conferência Anual Santander

BTG Pactual CEO Conference
BTG Pactual CEO ConferenceBTG Pactual CEO Conference
BTG Pactual CEO Conference
DirecionalRI
 
Abengoa First Quarter 2014 Earnings Presentation
Abengoa First Quarter 2014 Earnings PresentationAbengoa First Quarter 2014 Earnings Presentation
Abengoa First Quarter 2014 Earnings Presentation
Abengoa
 
Masco - Investor Presentation - September 2014
Masco - Investor Presentation - September 2014Masco - Investor Presentation - September 2014
Masco - Investor Presentation - September 2014
Masco_Investors
 
20150915 investor day presentation v_f_webcast version
20150915 investor day presentation v_f_webcast version20150915 investor day presentation v_f_webcast version
20150915 investor day presentation v_f_webcast version
Sysco_Investors
 
Investor Presentation - Toronto, Boston, Montreal
Investor Presentation - Toronto, Boston, MontrealInvestor Presentation - Toronto, Boston, Montreal
Investor Presentation - Toronto, Boston, Montreal
FinningInternational
 
Institucional 4 q13 novo padrão eng-final
Institucional 4 q13 novo padrão   eng-finalInstitucional 4 q13 novo padrão   eng-final
Institucional 4 q13 novo padrão eng-finalEquatorialRI
 
Symantec’s Strategic Direction Presentation
Symantec’s Strategic Direction PresentationSymantec’s Strategic Direction Presentation
Symantec’s Strategic Direction PresentationInvestorSymantec
 
Investor Day 2013: Coalitions in EMEA
Investor Day 2013: Coalitions in EMEAInvestor Day 2013: Coalitions in EMEA
Investor Day 2013: Coalitions in EMEA
Aimia's Investor Presentations
 
Investor Day 2013: Coalitions in EMEA
Investor Day 2013: Coalitions in EMEAInvestor Day 2013: Coalitions in EMEA
Investor Day 2013: Coalitions in EMEA
Aimia's Investor Presentations
 
current resume - Eckler
current resume - Ecklercurrent resume - Eckler
current resume - EcklerJames Eckler
 
Institucional 1 q14 novo padrão eng-final
Institucional 1 q14 novo padrão   eng-finalInstitucional 1 q14 novo padrão   eng-final
Institucional 1 q14 novo padrão eng-finalEquatorialRI
 
2020 Annual General Meeting of Shareholders Presentation
2020 Annual General Meeting of Shareholders Presentation2020 Annual General Meeting of Shareholders Presentation
2020 Annual General Meeting of Shareholders Presentation
Thermal Energy International Inc.
 
2015 masco corporation raymond james
2015 masco corporation raymond james2015 masco corporation raymond james
2015 masco corporation raymond james
Masco_Investors
 
2014 masco corporation jp morgan v2
2014 masco corporation jp morgan  v22014 masco corporation jp morgan  v2
2014 masco corporation jp morgan v2Masco_Investors
 
Q4 fy14 atento earnings presentation final
Q4 fy14 atento earnings presentation   finalQ4 fy14 atento earnings presentation   final
Q4 fy14 atento earnings presentation final
investorsatento
 
Abengoa Fiscal Year 2014 Presentation
Abengoa Fiscal Year 2014 PresentationAbengoa Fiscal Year 2014 Presentation
Abengoa Fiscal Year 2014 Presentation
Abengoa
 
MBAC Q3 2014 Presentation
MBAC Q3 2014 PresentationMBAC Q3 2014 Presentation
MBAC Q3 2014 Presentation
MBAC_Fertilizer
 
Atento Q4FY14 Bondholders Presentation
Atento Q4FY14 Bondholders PresentationAtento Q4FY14 Bondholders Presentation
Atento Q4FY14 Bondholders Presentation
investorsatento
 

Similar to 12 Conferência Anual Santander (20)

BTG Pactual CEO Conference
BTG Pactual CEO ConferenceBTG Pactual CEO Conference
BTG Pactual CEO Conference
 
Abengoa First Quarter 2014 Earnings Presentation
Abengoa First Quarter 2014 Earnings PresentationAbengoa First Quarter 2014 Earnings Presentation
Abengoa First Quarter 2014 Earnings Presentation
 
Masco - Investor Presentation - September 2014
Masco - Investor Presentation - September 2014Masco - Investor Presentation - September 2014
Masco - Investor Presentation - September 2014
 
Ujjivan Best Practices Hyderabad October 2011
Ujjivan Best Practices Hyderabad October 2011Ujjivan Best Practices Hyderabad October 2011
Ujjivan Best Practices Hyderabad October 2011
 
20150915 investor day presentation v_f_webcast version
20150915 investor day presentation v_f_webcast version20150915 investor day presentation v_f_webcast version
20150915 investor day presentation v_f_webcast version
 
Investor Presentation - Toronto, Boston, Montreal
Investor Presentation - Toronto, Boston, MontrealInvestor Presentation - Toronto, Boston, Montreal
Investor Presentation - Toronto, Boston, Montreal
 
Institucional 4 q13 novo padrão eng-final
Institucional 4 q13 novo padrão   eng-finalInstitucional 4 q13 novo padrão   eng-final
Institucional 4 q13 novo padrão eng-final
 
Symantec’s Strategic Direction Presentation
Symantec’s Strategic Direction PresentationSymantec’s Strategic Direction Presentation
Symantec’s Strategic Direction Presentation
 
Investor Day 2013: Coalitions in EMEA
Investor Day 2013: Coalitions in EMEAInvestor Day 2013: Coalitions in EMEA
Investor Day 2013: Coalitions in EMEA
 
Investor Day 2013: Coalitions in EMEA
Investor Day 2013: Coalitions in EMEAInvestor Day 2013: Coalitions in EMEA
Investor Day 2013: Coalitions in EMEA
 
current resume - Eckler
current resume - Ecklercurrent resume - Eckler
current resume - Eckler
 
background Eckler
background Ecklerbackground Eckler
background Eckler
 
Institucional 1 q14 novo padrão eng-final
Institucional 1 q14 novo padrão   eng-finalInstitucional 1 q14 novo padrão   eng-final
Institucional 1 q14 novo padrão eng-final
 
2020 Annual General Meeting of Shareholders Presentation
2020 Annual General Meeting of Shareholders Presentation2020 Annual General Meeting of Shareholders Presentation
2020 Annual General Meeting of Shareholders Presentation
 
2015 masco corporation raymond james
2015 masco corporation raymond james2015 masco corporation raymond james
2015 masco corporation raymond james
 
2014 masco corporation jp morgan v2
2014 masco corporation jp morgan  v22014 masco corporation jp morgan  v2
2014 masco corporation jp morgan v2
 
Q4 fy14 atento earnings presentation final
Q4 fy14 atento earnings presentation   finalQ4 fy14 atento earnings presentation   final
Q4 fy14 atento earnings presentation final
 
Abengoa Fiscal Year 2014 Presentation
Abengoa Fiscal Year 2014 PresentationAbengoa Fiscal Year 2014 Presentation
Abengoa Fiscal Year 2014 Presentation
 
MBAC Q3 2014 Presentation
MBAC Q3 2014 PresentationMBAC Q3 2014 Presentation
MBAC Q3 2014 Presentation
 
Atento Q4FY14 Bondholders Presentation
Atento Q4FY14 Bondholders PresentationAtento Q4FY14 Bondholders Presentation
Atento Q4FY14 Bondholders Presentation
 

More from DirecionalRI

Apresentação Reunião Pública 2016
Apresentação Reunião Pública 2016Apresentação Reunião Pública 2016
Apresentação Reunião Pública 2016
DirecionalRI
 
4Q15 Conference Call
4Q15 Conference Call4Q15 Conference Call
4Q15 Conference Call
DirecionalRI
 
TELECONFERÊNCIA 4T15
TELECONFERÊNCIA 4T15TELECONFERÊNCIA 4T15
TELECONFERÊNCIA 4T15
DirecionalRI
 
Webcast 1Q16
Webcast 1Q16Webcast 1Q16
Webcast 1Q16
DirecionalRI
 
TELECONFERÊNCIA 1T16
TELECONFERÊNCIA 1T16TELECONFERÊNCIA 1T16
TELECONFERÊNCIA 1T16
DirecionalRI
 
Apresentação Institucional - Evento BTG Pactual XVII CEO Conference
Apresentação Institucional - Evento BTG Pactual XVII CEO ConferenceApresentação Institucional - Evento BTG Pactual XVII CEO Conference
Apresentação Institucional - Evento BTG Pactual XVII CEO Conference
DirecionalRI
 
Apresentação Institucional 3T09
Apresentação Institucional 3T09Apresentação Institucional 3T09
Apresentação Institucional 3T09
DirecionalRI
 
Apresentação para a Visita de Analistas
Apresentação para a Visita de AnalistasApresentação para a Visita de Analistas
Apresentação para a Visita de Analistas
DirecionalRI
 
Itaú CEO Conference
Itaú CEO ConferenceItaú CEO Conference
Itaú CEO Conference
DirecionalRI
 
Apresentação Apimec 2010
Apresentação Apimec 2010Apresentação Apimec 2010
Apresentação Apimec 2010
DirecionalRI
 
Apresentação APIMEC - MG - 2011
Apresentação APIMEC - MG - 2011Apresentação APIMEC - MG - 2011
Apresentação APIMEC - MG - 2011
DirecionalRI
 
Manaus Site Visit
Manaus Site VisitManaus Site Visit
Manaus Site Visit
DirecionalRI
 
BTG Pactual Real Estate Conference – São Paulo
BTG Pactual Real Estate Conference – São PauloBTG Pactual Real Estate Conference – São Paulo
BTG Pactual Real Estate Conference – São Paulo
DirecionalRI
 
Apresentação APIMEC - SP
Apresentação APIMEC - SPApresentação APIMEC - SP
Apresentação APIMEC - SP
DirecionalRI
 
UBS Global Emerging Markets One-on-One Conference
UBS Global Emerging Markets One-on-One ConferenceUBS Global Emerging Markets One-on-One Conference
UBS Global Emerging Markets One-on-One Conference
DirecionalRI
 
Apresentação APIMEC - MG - 2012
Apresentação APIMEC - MG - 2012Apresentação APIMEC - MG - 2012
Apresentação APIMEC - MG - 2012
DirecionalRI
 
Convite APIMEC 2013
Convite APIMEC 2013Convite APIMEC 2013
Convite APIMEC 2013
DirecionalRI
 
Corporate Presentation June 2013
Corporate Presentation June 2013Corporate Presentation June 2013
Corporate Presentation June 2013
DirecionalRI
 
Apresentação APIMEC - MG - 2013
Apresentação APIMEC - MG - 2013Apresentação APIMEC - MG - 2013
Apresentação APIMEC - MG - 2013
DirecionalRI
 
Corporate Presentation 1Q13
Corporate Presentation 1Q13Corporate Presentation 1Q13
Corporate Presentation 1Q13
DirecionalRI
 

More from DirecionalRI (20)

Apresentação Reunião Pública 2016
Apresentação Reunião Pública 2016Apresentação Reunião Pública 2016
Apresentação Reunião Pública 2016
 
4Q15 Conference Call
4Q15 Conference Call4Q15 Conference Call
4Q15 Conference Call
 
TELECONFERÊNCIA 4T15
TELECONFERÊNCIA 4T15TELECONFERÊNCIA 4T15
TELECONFERÊNCIA 4T15
 
Webcast 1Q16
Webcast 1Q16Webcast 1Q16
Webcast 1Q16
 
TELECONFERÊNCIA 1T16
TELECONFERÊNCIA 1T16TELECONFERÊNCIA 1T16
TELECONFERÊNCIA 1T16
 
Apresentação Institucional - Evento BTG Pactual XVII CEO Conference
Apresentação Institucional - Evento BTG Pactual XVII CEO ConferenceApresentação Institucional - Evento BTG Pactual XVII CEO Conference
Apresentação Institucional - Evento BTG Pactual XVII CEO Conference
 
Apresentação Institucional 3T09
Apresentação Institucional 3T09Apresentação Institucional 3T09
Apresentação Institucional 3T09
 
Apresentação para a Visita de Analistas
Apresentação para a Visita de AnalistasApresentação para a Visita de Analistas
Apresentação para a Visita de Analistas
 
Itaú CEO Conference
Itaú CEO ConferenceItaú CEO Conference
Itaú CEO Conference
 
Apresentação Apimec 2010
Apresentação Apimec 2010Apresentação Apimec 2010
Apresentação Apimec 2010
 
Apresentação APIMEC - MG - 2011
Apresentação APIMEC - MG - 2011Apresentação APIMEC - MG - 2011
Apresentação APIMEC - MG - 2011
 
Manaus Site Visit
Manaus Site VisitManaus Site Visit
Manaus Site Visit
 
BTG Pactual Real Estate Conference – São Paulo
BTG Pactual Real Estate Conference – São PauloBTG Pactual Real Estate Conference – São Paulo
BTG Pactual Real Estate Conference – São Paulo
 
Apresentação APIMEC - SP
Apresentação APIMEC - SPApresentação APIMEC - SP
Apresentação APIMEC - SP
 
UBS Global Emerging Markets One-on-One Conference
UBS Global Emerging Markets One-on-One ConferenceUBS Global Emerging Markets One-on-One Conference
UBS Global Emerging Markets One-on-One Conference
 
Apresentação APIMEC - MG - 2012
Apresentação APIMEC - MG - 2012Apresentação APIMEC - MG - 2012
Apresentação APIMEC - MG - 2012
 
Convite APIMEC 2013
Convite APIMEC 2013Convite APIMEC 2013
Convite APIMEC 2013
 
Corporate Presentation June 2013
Corporate Presentation June 2013Corporate Presentation June 2013
Corporate Presentation June 2013
 
Apresentação APIMEC - MG - 2013
Apresentação APIMEC - MG - 2013Apresentação APIMEC - MG - 2013
Apresentação APIMEC - MG - 2013
 
Corporate Presentation 1Q13
Corporate Presentation 1Q13Corporate Presentation 1Q13
Corporate Presentation 1Q13
 

Recently uploaded

Corporate Presentation Probe June 2024.pdf
Corporate Presentation Probe June 2024.pdfCorporate Presentation Probe June 2024.pdf
Corporate Presentation Probe June 2024.pdf
Probe Gold
 
Snam 2023-27 Industrial Plan - Financial Presentation
Snam 2023-27 Industrial Plan - Financial PresentationSnam 2023-27 Industrial Plan - Financial Presentation
Snam 2023-27 Industrial Plan - Financial Presentation
Valentina Ottini
 
一比一原版(UW毕业证)华盛顿大学毕业证成绩单专业办理
一比一原版(UW毕业证)华盛顿大学毕业证成绩单专业办理一比一原版(UW毕业证)华盛顿大学毕业证成绩单专业办理
一比一原版(UW毕业证)华盛顿大学毕业证成绩单专业办理
ybout
 
Osisko Gold Royalties Ltd - Corporate Presentation, June 2024
Osisko Gold Royalties Ltd - Corporate Presentation, June 2024Osisko Gold Royalties Ltd - Corporate Presentation, June 2024
Osisko Gold Royalties Ltd - Corporate Presentation, June 2024
Osisko Gold Royalties Ltd
 
cyberagent_For New Investors_EN_240424.pdf
cyberagent_For New Investors_EN_240424.pdfcyberagent_For New Investors_EN_240424.pdf
cyberagent_For New Investors_EN_240424.pdf
CyberAgent, Inc.
 
2024-deutsche-bank-global-consumer-conference.pdf
2024-deutsche-bank-global-consumer-conference.pdf2024-deutsche-bank-global-consumer-conference.pdf
2024-deutsche-bank-global-consumer-conference.pdf
Sysco_Investors
 
Osisko Development - Investor Presentation - June 24
Osisko Development - Investor Presentation - June 24Osisko Development - Investor Presentation - June 24
Osisko Development - Investor Presentation - June 24
Philip Rabenok
 

Recently uploaded (7)

Corporate Presentation Probe June 2024.pdf
Corporate Presentation Probe June 2024.pdfCorporate Presentation Probe June 2024.pdf
Corporate Presentation Probe June 2024.pdf
 
Snam 2023-27 Industrial Plan - Financial Presentation
Snam 2023-27 Industrial Plan - Financial PresentationSnam 2023-27 Industrial Plan - Financial Presentation
Snam 2023-27 Industrial Plan - Financial Presentation
 
一比一原版(UW毕业证)华盛顿大学毕业证成绩单专业办理
一比一原版(UW毕业证)华盛顿大学毕业证成绩单专业办理一比一原版(UW毕业证)华盛顿大学毕业证成绩单专业办理
一比一原版(UW毕业证)华盛顿大学毕业证成绩单专业办理
 
Osisko Gold Royalties Ltd - Corporate Presentation, June 2024
Osisko Gold Royalties Ltd - Corporate Presentation, June 2024Osisko Gold Royalties Ltd - Corporate Presentation, June 2024
Osisko Gold Royalties Ltd - Corporate Presentation, June 2024
 
cyberagent_For New Investors_EN_240424.pdf
cyberagent_For New Investors_EN_240424.pdfcyberagent_For New Investors_EN_240424.pdf
cyberagent_For New Investors_EN_240424.pdf
 
2024-deutsche-bank-global-consumer-conference.pdf
2024-deutsche-bank-global-consumer-conference.pdf2024-deutsche-bank-global-consumer-conference.pdf
2024-deutsche-bank-global-consumer-conference.pdf
 
Osisko Development - Investor Presentation - June 24
Osisko Development - Investor Presentation - June 24Osisko Development - Investor Presentation - June 24
Osisko Development - Investor Presentation - June 24
 

12 Conferência Anual Santander

  • 2. Disclaimer This presentation may contain forward-looking statements. Such forward-looking statements are and will be subject to many risks and uncertainties relating to factors that are beyond Direcional’s ability to control or estimate precisely, such as future market conditions, competitive environment, currency and inflation fluctuations, changes in governmental and regulatory policies and other factors relating to the operations of Direcional, which may cause actual future results of Direcional to differ materially from those expressed or implied in such forward-looking statements You are cautioned not to place undue reliance on these forward-looking statements, which speak only as of the date of this presentation. Such forward-looking statements shall not be construed as guarantee of future performance. Direcional does not undertake to publicly review or update these forward-looking statements in view of events or circumstances occurring after the date 2 undertake to publicly review or update these forward-looking statements in view of events or circumstances occurring after the date of this presentation This presentation does not constitute an offer, or invitation, or solicitation of an offer, to subscribe for or purchase any securities. Neither this presentation nor anything contained herein shall form the basis of any contract or commitment whatsoever This presentation and its contents are proprietary information and may not be reproduced or otherwise disseminated in whole or in part without Direcional’s prior written consent.
  • 3. 652 2,227 5,359 9,360 12,364 Start-up in 1981 Industrial projects acting as contractor to third parties IPO Over 30 Years of History A consistent track record and focus Capture significant market opportunities MCMV II Follow-on: $ 228.8 million for What’s Next? CAGR 06-10: 110% CAGR 06-10: 100% 67 176 710 783 1,067 Development of projects focused on the low-income market Beginning of large scale developments for the low-income market Operations expansion to PA, RO and ES IPO 32% growth in units launched from the previous year 57% growth in contracted PSV from the previous year 3 Source: Company Reports Units Launched Consolidation of a leading position in Manaus and Brasilia Establishment of own sales team Important geographic expansion: Brasília, Rio de Janeiro and Campinas 1981 - 2005 2006 2007 2008 2009 2010 2011 228.8 million for the Company Increasing liquidity PSV Launched (R$ mm) 67
  • 4. Management Team Ricardo Valadares Gontijo Chairman & CEO Ricardo Valadares Gontijo Chairman & CEO • Founder, CEO and Chairman of the Board 40 years of construction experience • Civil Engineer graduated by UFMG with Gold Medal Award. Ricardo Ribeiro Gontijo Commercial Officer Ricardo Ribeiro Gontijo Commercial Officer Roberto Senna General Manager Roberto Senna General Manager • Civil Engineer degree from The Universidade Federal da Bahia, MBA degree from FGV and specialization courses at the Wharton School - University of Philadelphia, and University of Carlifornia - Irvine. • Joined Odebrecht Group in 1979 and has held senior management positions in Brazil and abroad • He was President of Metro-Rio, Director of Telemar Holding and member of the Board of several companies of the group. • He was CEO of Bairro Novo, a real estate subsidiary from Odebrecht Group, focused on residential development and construction in the low income •Board Member and responsible for Marketing, Sales and New Business •Civil Engineer graduated by UFMG with the Gold Medal Award •Joined Direcional in 2004. 4 Commercial OfficerCommercial Officer Carlos Wollenweber CFO & IR Officer Carlos Wollenweber CFO & IR Officer Lucas Rocha Engineering Officer Lucas Rocha Engineering Officer Ana Carolina Huss Human Resources Officer Ana Carolina Huss Human Resources Officer •Joined Direcional in 2004. •Extensive experience in the Brazilian real estate market. •From 2007 to 2009, Controller of BR Properties •From 2005 to 2007, Financial Director of Valora •From 2001 to 2005, Financial Manager of Gafisa •Electrical Engineer graduated by PUC / SP has master degree in Economics and Finance at PUC / SP and MBA degree at MIT (Massachusetts Institute of Technology) •Responsible for the engineering department with more than 30 years of experience in construction •Holds a bachelor’s degree in Civil Engineering •Joined Direcional in 1985 • Psychologist, graduated at University Paulista, MBA in Business Management, post graduate in Knowledge Management at FVG and certified in Bright Link in professional coaching • Human Resources Manager at Natura Cosméticos and Accor Brasil • Responsible for the department ¨People and Organization¨ of the Bairro Novo, a company of the Odebrecht group.
  • 5. Shareholder’s Structure 46.9% 15.0% Filadélphia Participações S.A. 1 GICTarpon2 Other 7.1% 24.1% Ridgecrest, LLC 6.9% 51. Holding owbed by Ricardo Valadares Gontijo and his family 2. Funds managed by Tarpon Investimentos S.A.
  • 7. Unique Footprint Strong footprint in markets with high growth potential, low competition and high barriers to entry Low competition in profitable markets Direcional: A Unique Business Model The best low-income player in Brazil The most profitable and efficient player in the low income sector ‘’’’‘ Highest efficiency and profitability in the sector 1st Annualized ROE¹ among peers ~25.8% of ROE ~22.6% of Net Margin 1st Net margin among peers 1 Track Record in Operating in the Low Income Over 30 years of experience Solid track record in 0-3 minimum wages projects Low capital commitment, solid margins and high ROIC Focus on Large Scale Projects Verticalized Business Model Strong expertise in large scale ventures Own work force Performance-based compensation Standardized and industrialized production on-site Large scale operations in the low income segments, with strict cost control and high margins 7Source: Company Report in the 4Q10 1. Annualized ROE: Annualized Quarter’s Net Profit / Average Shareholders' Equity in the same period 2 3 4
  • 8. Unique Footprint: High Growth Markets with Barriers to Entry Land Bank Composition Barriers to Entry Detailed mapping of logistics and supply Scarcity of Suppliers Industrialization of raw materials Vertically integrated model is rapidly replicated Direcional's Approach 1 Direcional is the leading company in underpenetrated markets with high growth potential AM 13.5% RO 3.9% PA 13.4% 8 Complex Logistics Detailed mapping of logistics and supply channels Large and vertically integrated projects Adverse Weather Conditions Pre-manufactured building materials adapted to diverse climates Expertise in coordinating construction cycle and weather demands Unskilled Labor Highly-trained workers Standardized and fully-integrated construction Compensation based on performance “MINHA CASA, MINHA VIDA” 49.9k units elegible for the program 73.4% of total Land bank Source: Company Report ES 1.5% MG 37.8% SP 6.4% DF 22.5% RJ 1.1% Popular, 52.8% Commercial, 4.2% Medium, 36.1% Upper Middle, 6.9% Segment Breakdown (PSV)
  • 9. Focus on Large Scale Projects … Strong and unique expertise in large scale ventures 2 Large Scale Projects¹ Main Advantages of Scale Economies of Scale Industrialization process of raw materials Manaus Total Ville AM Under construction 3.848 2.136 Total Ville Bella Cittá PA Under construction 4.938 3.316 Total Ville Marabá PA Under construction 5.604 4.664 Allegro Residencial Club AM Under construction 1.648 704 Setor Total Ville DF Under construction 4.362 2.064 Total Ville Porto Velho RO Under construction 2.852 1.868 Dream Park ES Under construction 1.034 752 Project Status Total Units Units to be launched 9Source: Company Report 1. Projects with more than 1,000 units Optimize construction processes Urbanized projects Lower Execution Risk Lower Inflation Risk78.3% of the units to be launched in large scale projects1 16 projects with close to 65 thousand units Eliza Miranda AM Under construction 1.406 128 Cachoeiras do Madeira RO Under construction 1.278 426 Total Ville Macaé RJ Under construction 1.145 399 Águas Claras DF To be Launched 1.148 1.148 Floramar MG To be Launched 1.172 1.172 Granjas Werneck MG To be Launched 15.000 15.000 Sítio São João MG To be Launched 2.500 2.500 Ferroeste MG To be Launched 2.388 2.388 Samambaia DF To be Launched 14.614 14.614 Total 64.937 53.279 Licensed Projects
  • 10. … Through a Verticalized Business Model More than 11,000 exclusive workers assuring quality, commitment, efficiency and cost control Verticalized Business Model Ability to Deliver 3 Best Execution in the SectorBest Execution in the Sector Construction DNAConstruction DNA Own Work Force VerticalizationVerticalization Standardized / Industrialization 10 Performance Based Compensation Capacity to Hire and Train Operational Team Lower Turnover On Schedule: Projects Delivered on Time With High Quality: Lower Maintenance Cost On Budget: Margin Stability Own Work Force Standardized / Industrialization Economies of Scale All projects are based on few designs Source: Company Report
  • 11. Unique Expertise in the Low Income Segment Solid track record in all the low income segments Characteristics Developer approach ̶ Companies develop projects and sell units to customers Price above R$170 k / unit CAIXA does not facilitate customer financing Developer approach ̶ Companies develop projects and sell units to customers Price is capped at R$170 k / unit CAIXA facilitates customer financing Builder approach ̶ Homebuilders present projects to Caixa for evaluation and approval Normally land/infrastructure is given by local Government Price is capped at R$51 k / unit 4 Mid / Low Income Low Income (MCMV – 4-10 MW) Very Low Income (MCMV – 0-3 MW)+ + 11 1. Company estimates – maximum cash exposure in % of total PSV Main Players Equity Commitment1 Units Launched 2010 ~5%~15%~20% ~10% 60% / 7,391 units12% / 1,503 units 28% / 3,470 units PSV Launched 2010 36% / R$ 380 mm23% / R$ 245 mm 41% / R$ 441 mm
  • 12. Top Notch Operational Performance Direcional has been confirming its efficient cash cycle with sound financial results Efficient Cash Cycle Highest Results in the Sector Land Acquisition Sales Speed Land Acquisition Sales Speed 38% VSO80% Swaps 19% 24% MRV PDG Helbor 12 Efficient Cash Cycle Management Cash Collection Austere Budget Client Financing Construction Financing Cash Collection Austere Budget Client Financing Construction Financing Avg. Unit Selling Price NetMargin2010 Source: Company Reports in the 4Q10 80-100% of construction cost G&A of 6% of Revenues 4% 9% 14% - 150.000 300.000 450.000 CCDI Rodobens PDG Even Inpar Cyrela Tecnisa Rossi Trisul Gafisa
  • 14. MCMV Program Highlights The largest housing program of the Brazilian history First Priority of the New Government and currently at full speed with Dilma’s recent election The 0-3 segment has expanded three-fold, reaching 1.2 Growth Drivers: MCMV 2nd Phase 0-3 segment presents an outstanding growth opportunity 600,000 200,000 200,000 BRL 34 billion 1.000.000 uniits BRL 72 billion 2.000.000 units 4-6 Wages 7-10 Wages Total (R$'000) % Direcional (R$'000) Residencial meu Orgulho - 1ª Fase * Jun Manaus -AM 190,598 190,598 3,511 Bairro Carioca Oct Rio de Janeiro - RJ 114,240 114,240 2,240 Residencial Jardim Alterosa Dec Belo Horizonte - MG 75,440 75,440 1,640 Total 2010 380,278 380,278 7,391 2010 Projects Launch Date City - State PSV Nr. of Units The 0-3 segment has expanded three-fold, reaching 1.2 million units The regional distribution of the program should benefit Direcional 14 400,000 1,200,000400,000 200,000 MCMV1 MCMV2 0-3 Wages
  • 15. Growth Drivers: Selective Geographic Expansion Direcional operates in Brazil’s most complex markets and expects to replicate this model in new attractive areas Development of 0-3 MW Projects Geographic Expansion Strategy New Sites Selection Criteria High Housing Demand Access to Credit Lines 15 Immediate gain of market share and visibility New projects leveraging on our unique business model Access to Credit Lines Operational Complexity & Region Expertise Land Availability
  • 17. 158 288 300 511191 191 131 131 176 710 783 1,067 511 Launches +82% CAGR 07-10: 82% +71% Launched PSV (R$ million) Launched PSV - Evolution (R$ million) Total (R$'000) % Direcional (R$'000) 1 Verano Residencial - 1st Phase April Belém - PA 36,968 36,931 184 539 Medium 2 Total Ville Macaé - 2nd Phase - RET 1 April Macaé - RJ 27,264 13,632 340 1,145 Popular 3 Parque Ponta Negra - 3rd Phase April Manaus - AM 47,711 47,706 137 820 Upper-Middle 4 Tulip Inn Savassi - Hotel June Belo Horizonte - MG 86,238 85,376 240 240 Commercial 5 Total Ville Vida Nova - 3rd Phase - RET 1 June Manaus - AM 56,400 56,344 752 3,848 Popular 6 Bella Città Algodoal - 3rd Phase - RET 1 June Marituba - PA 48,000 47,995 640 4,938 Popular 302,581 287,984 2,293 11,530 1 Acquisition of Project - Parque Ponta Negra May Manaus - AM 131,289 131,289 545 n/a Medium 433,870 419,272 2,838 11,530 # of Units Launched Total Units (All Phases) Segment Launches 2Q11 Launches + Project Acquisition 2Q11 Projects Date City - State PSV 2Q10 2Q11 1H10 1H11 Development 0-3 mw projects ProjectAcquisition 176 2007 2008 2009 2010 1H11 17
  • 18. 54.6% 65.6% 58.1% 56.2% 45.4% 37.7% 9.7% 34.4% 4.2% 34.0% 2Q10 2Q11 1H10 1H11 Launches Breakdown Launches (Segment Breakdown – PSV) Launches (Geographic Breakdown - PSV) 54,6% 38,9% 7,7% 41,0% 30,0% 35,9% 37,5% 12,8% 26,7% 34,8% 16,6% 4,2% 9,3% 29,6% 20,0% 2Q10 2Q11 1H10 1H112Q10 2Q11 1H10 1H11 North Midwest Southeast Tulip Inn Savassi - Hotel – PSV R$ 85.4 MM Total Ville Vida Nova 3rd phase – PSV R$ 56.4 MMVerano Residencial – PSV R$ 36.9 MM 18 Parque Ponta Negra – PSV R$ 47.7 MMTotal Ville Macaé 2nd phase – PSV R$ 13.6 MMBella Cittá Algodoal – PSV R$ 47.9 MM 2Q10 2Q11 1H10 1H11 0 - 3 MW Popular Medium Upper Middle Commercial
  • 19. 127 441 661 1,037 344133 169 297 344 191 191 89 89 Sales CAGR 07-10: 101% +27% +16% Contracted PSV (R$ million) Contracted PSV - Evolution (R$ million) 58,9% 39,1% 24,2% 24,3% 36,5% 30,4% 9,2% 47,2% 13,7% 49,4% 7,8% 11,8% 10,8% 10,4% 16,7% 9,7% 2Q10 2Q11 1H10 1H11 0 - 3 MW Popular Medium Upper Middle Commercial 77.9% 48.1% 72.8% 40.1% 13.2% 19.8% 17.0% 21.7% 8.9% 32.1% 10.2% 38.2% 2Q10 2Q11 1H10 1H11 North Midwest Southeast 2007 2008 2009 2010 1H112Q10 2Q11 1H10 1H11 Development 0-3 mw projects Project Acquisition 19 Sales (Geographic Breakdown) Sales (Segment Breakdown)
  • 20. 33.8% 38.3% Sales Speed Sales Over Supply of 18.5% in 2Q11. Under RET1, a purchase agreement only becomes effective after CEF approves the mortgage credit facility. If we do not consider RET1 projects, Sales Over Supply would achieve 20.6%, whereas 51%* of the units launched in 2Q11 were sold during the same quarter Sales Over Supply (VSO) (Total PSV) Sales Speed (%) (Units) 20% 31%2T11 51%* 20.6% 23.7% 19.4% 20.8% 27.6% 22.1% 18.5% 1Q10 2Q10 3Q10 4Q10 1Q11 2Q11 With 0.3. MW project Without 0.3. mw project 20 2Q10 and 4Q10: the sales speed was positively impacted by the immediate recognition 0-3 m.w. construction contracts 2Q11: was inegatively mpacted by the RET1 projects, in which sales are subject to the mortgage facility approval from CEF. * Not considering RET1 projects Ex-RET1 project 89% 17% 87% 48% 4% 27% 4% 21% 3% 14% 1%2T10 3T10 4T10 1T11 3M 6M 9M 12M 15M 69% 92% 67% 97% 51%*
  • 21. Concluded Projects - 2Q11 Total (R$'000) % Direcional (R$'000) 1 Equilibrium Manaus - AM 49,501 43,561 136 2 Águas do Madeira Porto Velho - RO 61,520 40,973 426 3 Grand Prix Manaus - AM 42,026 36,983 192 4 Lake View Resort Brasília - DF 89,513 87,812 232 5 Garden Club - 1st Phase Porto Velho- RO 34,394 27,515 313 6 Dream Park Serra - ES 44,629 35,704 282 Completed Projects - 2Q11 321,584 272,547 1,581 Completed Projects - 2Q11 City - State PSV # of Units 21 Completed Projects - 2Q11 321,584 272,547 1,581
  • 22. 22 Operating and Financials Highlights 1H11 and 2Q11 22
  • 23. Highlights 158 288 300 511191 191 131 131 2Q10 2Q11 1H10 1H11 176 710 783 1,067 511 2007 2008 2009 2010 1H11 +82% CAGR 07-10: 82% +71% Launched PSV (R$ million) Launched PSV - Evolution (R$ million) 102,3 263,2 377,6 781,9 478,7 21,1% 24,5% 22,5% 22,6% 19,1% 0,0% 5,0% 10,0% 15,0% 20,0% 25,0% 30,0% 0,0 100,0 200,0 300,0 400,0 500,0 600,0 700,0 800,0 900,0 2007 2008 2009 2010 1H11 Adjusted net Margin (%) 23 2Q10 2Q11 1H10 1H11 Development 0-3 mw projects ProjectAcquisition 2007 2008 2009 2010 1H11 +48% +55% Net Revenues (R$ million) CAGR: 97,0% Net Revenues - Evolution (R$ million) 165 245 308 479 2Q10 2Q11 1H10 1H11
  • 24. 14,9 20,7 33,0 48,2 56,8 57,7 35,6 114,5 10,1% 12,2% 15,2% 17,7% 23,8% 23,0% 11,2% 23,4% 1Q10 2Q10 3Q10 4Q10 1Q11 2Q11 1H10 1H11 Revenue of Services Evolution Highlights 1Q10 – 2Q11 Growth: +286,7% + 222% 1Q10 2Q10 3Q10 4Q10 1Q11 2Q11 1H10 1H11 % Gross Revenue 24 Gross Revenue Breakdown: 1H11 Development, 76.6% Management Fee, 0.8% 0-3 MW Projects, 22.1% Brokerage, 0.5%
  • 25. Cash Position Loans and Financing (ex- securitization) Cash Position 2Q11 1Q11 4Q10 ∆∆∆∆ % ∆∆∆∆ % (R$'000) (a) (b) (c) (a/b) (a/c) Loans and Financing 408,630 348,307 302,374 17.3% 35.1% SFH 341,303 282,674 226,056 20.7% 51.0% Securitization of receivables 37,216 36,429 46,843 2.2% -20.6% FINAME and others 9,149 8,611 8,882 6.2% 3.0% Working Capital 20,962 20,593 20,593 1.8% 1.8% Cash and Cash Equivalents 381,768 355,410 190,852 7.4% 100.0% Net debt 26,862 -7,103 111,522 Net debt / Equity 2.3% -0.7% 14.1% SFH, 91.9% Securitizati on of receivables, 2.5% Working Capital, 5.6% 14,522 25,312 22,468 32,657 41,236 73,695 86,301 100,873 64,967 33,965 1Q09 2Q09 3Q09 4Q09 1Q10 2Q10 3Q10 4Q10 1Q11* 2Q11 Moving Average of Last 4 Quarters 25 Cash Burn¹ (R$ million) -36% -48% 1. Cash Burn: measured by the variation of the net debt, less capital increases * 1Q11: Adjusted by R$ 223,8 million of follow-on and R$ 40.3 million of dividends payment
  • 26. Majority Shareholder Tarpon 15,0% Ridgecrest 6,9% GIC 6,9% Follow-On 20.8 million new shares were issued in the primary offer and 7.2 million sold in the secondary offering Increased the free float from 39.5% to 53.1%. Before Follow On After Follow On Controlling 60.5% Tarpon 15.0% Ridgecrest 8.0% Shareholder 46,9% Others 24,3% 540,3 1.808,3 Before Follow On After Follow On 86 195 224 414 Dec. / 10 May/ 11 Investments Funds Individuals 26 60.5% 8.0% GIC 3.6%Other 12.9% Average Daily Volume¹ (R$’000) +235%+76% Total # of Shareholders 1: five months before follow-on and five months after follow-on.
  • 27. Shares Performance Since IPO Since IPO DIRR3: +4,2% IBOVESPA: -6,2% IMOB: -1,3% 80 100 120 140 160 5.000 6.000 7.000 8.000 9.000 10.000 PreçodaAção Volume(R$mil) 80 100 120 140 160 5.000 6.000 7.000 8.000 9.000 10.000 StockPerformace Volume(R$'000) Before Follow On After Follow On 27 0 20 40 60 80 - 1.000 2.000 3.000 4.000 5.000 19-nov-09 3-dez-09 16-dez-09 4-jan-10 15-jan-10 29-jan-10 11-fev-10 26-fev-10 11-mar-10 24-mar-10 7-abr-10 20-abr-10 4-mai-10 17-mai-10 31-mai-10 15-jun-10 28-jun-10 12-jul-10 26-jul-10 10-ago-10 24-ago-10 13-set-10 30-set-10 14-out-10 27-out-10 10-nov-10 26-nov-10 9-dez-10 27-dez-10 10-jan-11 21-jan-11 4-fev-11 17-fev-11 2-mar-11 17-mar-11 30-mar-11 12-abr-11 27-abr-11 10-mai-11 23-mai-11 3-jun-11 16-jun-11 30-jun-11 PreçodaAção Volume(R$mil) Volume (R$ mil) 0 20 40 60 80 - 1.000 2.000 3.000 4.000 5.000 18-Nov-09 02-Dec-09 15-Dec-09 30-Dec-09 14-Jan-10 28-Jan-10 10-Feb-10 25-Feb-10 10-Mar-10 23-Mar-10 06-Apr-10 19-Apr-10 03-May-10 14-May-10 28-May-10 14-Jun-10 25-Jun-10 08-Jul-10 23-Jul-10 06-Aug-10 23-Aug-10 10-Sep-10 29-Sep-10 13-Oct-10 26-Oct-10 09-Nov-10 25-Nov-10 08-Dec-10 23-Dec-10 07-Jan-11 20-Jan-11 03-Feb-11 16-Feb-11 01-Mar-11 16-Mar-11 29-Mar-11 11-Apr-11 26-Apr-11 09-May-11 20-May-11 02-Jun-11 15-Jun-11 29-Jun-11 StockPerformace Volume(R$'000) Average Volume (21 days) Direcional Ibovespa IMOB
  • 29. 115 120 500 600 Rising Income ▲ Basic Goods Basket ▲ Real Minimum Wage ▲ Average Wage (Monthly) HOUSEHOLDS’ DISPOSABLE INCOME (Jan/03 – Aug/10) Emerging Class C EMERGING CLASS C (1) (% households, 2003 – 2009) Positive Job Market Trends Poised to Capitalize on Soaring Demand + + Brazil’s social upward mobility has favored the sector ‘04-’10 EMPLOYMENT GROWTH (%, Jan/04 – Nov/10) 50% 58% 27% 38% 3% 6% 9% 12% 15% Jan-03 Oct-03 Jul-04 Apr-05 Jan-06 Oct-06 Jul-07 Apr-08 Jan-09 Oct-09 Jul-10 Apr-11 90 95 100 105 110 - 100 200 300 400 jan/03 out/05 jul/08 abr/11 29 The steady increase of household disposable income, along with a higher availability of housing credit, drives the search for new homes 29 million individuals entered the class C income segment in the last 6 years, and 18 million are expected to join it in the next 5 years Source: FGV (A Nova Classe Média: O Lado Brilhante dos Pobres), DIEESE, IPEA and McCann Erickson do Brasil 1. Households earning R$1,126 to R$4,854 per month. 2.2x 1.8x UNEMPLOYMENT RATE (%, 12-month moving average) 37% 2003 2009 2014 66mm 95mm +29mm 113mm +18mm -3% Total Formal Informal Jan-04 - Abr-11 % Min 5,3% Max 13,1% Nov/10 6,4% Average of 12M 6,4%
  • 30. Corporate Governance Board of Directors Shareholderes ► Own Governance Standards ► Nominate Members to the Board of Directors Advisory Committees ► Nominated by the Board of Directors ► Not deliberative Investment Committee Finance Committee Compensation Committee ► Fixed Assets ► Diversification ► Mergers and Acquisitions ► Cash Management Policies ► Capital Structure ► Risk Management Board of Executive Officers Operations ► Not deliberative ► Bi-monthly meetings or ad-hoc Deliberative Committees ► Board of Directors + Directors + Guests ► Monthly meetings or ad-hoc Committee Investment Committees Engineering Committee Human Resource Committee ► Land bank purchases ► Launchings ► Pre-budget approval (release) ► Approval of budget and planning (beginning work) ► Performance Valuation ► Variable Compensation 30
  • 31. Company Structure Engineering/ Construction Detailed Design Health, Safety & Environment AdministrativeSu pport Quality/ Technology AM DF,PA,RO MG,ES SP,RJ CFO / IR HR Budget/Supply/ Planning Shareholders Clients 31Source: Company Development / Commercial Viability Studies Market Support/Sales Conceptual Design / Products Legal (Real Estate) AM Special Projects (“0 – 3”) President CEO Legal (Corporate) Comunic. & Market. Corp. Sustainability/Cu stomer Relationship Guidelines Results Shareholders MG,ES DF,PA,RO SP,RJ Clients
  • 32. Contacts Carlos Wollenweber CFO | IR Officer Lucas Bousas IR Analyst 32 IR Analyst Paulo Sousa IR Analyst www.direcional.com.br ri@direcional.com.br (55 31) 3214-6200 (55 31) 3214-6450