SlideShare a Scribd company logo
Statistics - STAT100
1- Statistics and types of Statistics :
What is statistics ?
Definition : statistics is the science of collecting ,
analyzing , presenting , interpreting data, as well as of
making decisions based on such analyses.
Definitions
( a ) Descriptive statistics : consists of methods for
organizing , displaying , and describing data by
using tables , graphs and summary measures .
( b ) Inferential statistics : consists of methods that
use sample results to help make decisions about a
population .
Population. Sample :
A set of units that is interest to
study .
A subset of the population .
Examples Of a population Examples Of a Sample :
-Children in a school
-Students in a college
-animals on a farm
-etc.
-Children in classroom in a school
- Civil engineering students at the
university
-a child takes a sample of five cookies
from a recently baked batch of thirty
chocolate chip cookies.
Data
Definition :data set is the collection of observed values of the
statistical variable .
types of statistical data
Statistical Data
𝟏)𝐐𝐮𝐚𝐥𝐢𝐭𝐚𝐭𝐢𝐯𝐞 𝐃𝐚𝐭𝐚 𝐜𝐚𝐭𝐞𝐠𝐨𝐫𝐢𝐞𝐬
𝟐)𝐐𝐮𝐚𝐧𝐭𝐢𝐭𝐚𝐭𝐢𝐯𝐞 𝐃𝐚𝐭𝐚𝐭 (𝐧𝐮𝐦𝐛𝐞𝐫𝐬)
𝟏)𝐃𝐢𝐬𝐜𝐫𝐞𝐭𝐞 𝐜𝐨𝐮𝐧𝐭𝐬 , {𝟏, 𝟑, 𝟓, 𝟕, … }
𝟐)𝐂𝐨𝐧𝐭𝐢𝐧𝐮𝐨𝐮𝐬 𝐦𝐞𝐚𝐬𝐮𝐫𝐞𝐦𝐞𝐧𝐭𝐬 , 𝟏, 𝟒
Definitions
1- Qualitative data :
Data generated by Qualitative
variable .
2- Quantitative data :
Data generated by quantitative
variable
Organizing and Graphing Qualitative data
Data sets are Organized into tables and displayed using
graphs . First we discuss of raw data .
definition : Raw data --- Data recoded in the sequence in
which they are collected and before are ranked .
EXAMPLE :1
A sample of 30 employees from large companies was selected,
and these employees were asked how stressful their jobs were.
The responses of these employees are recorded below, where
very represents very stressful, somewhat means somewhat
stressful, and none stands for not stressful at all.
Somewhat none somewhat very very none
Very somewhat somewhat very somewhat somewhat
very somewhat none very none somewhat
somewhat very somewhat somewhat very none
somewhat very very somewhat none somewhat
Construct a frequency distribution table for these data?
Solution
Relative Frequency and Percentage
Distribution
Relative Frequency of category =
Frequency of that category
Sum of all Frequencies
Percentage = (Relative Frequency ) . 100%
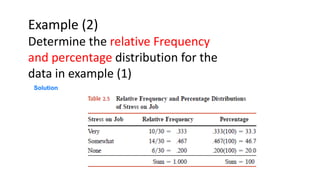
Example (2)
Determine the relative Frequency
and percentage distribution for the
data in example (1)
Solution
stressful
on jobs
Tally Frequency
(f )
Relative Percentage
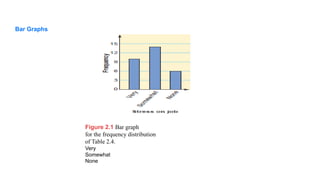
very |||| |||| 10 10
30
= 0.333
0.333 × 100
= 33.3
somewhat |||| || |||| 14 14
30
= 0.467
0.467 × 100
= 46.7
none |||| | 6 6
30
= 0.20
0.2 × 100
= 20
30 1 100
Solution Example :1 and 2 in one table
Figure 2.1 Bar graph
for the frequency distribution
of Table 2.4.
Very
Somewhat
None
Bar Graphs
H.W 1
2.3 The following data give the results of a sample survey. The letters A, B, and C represent the
three categories.
A B B A C B C C C A
C B C A C C B C C A
A B C C B C B A C A
a. Prepare a frequency distribution table.
b. Calculate the relative frequencies and percentages for all categories.
c. What percentage of the elements in this sample belong to category B?
d. What percentage of the elements in this sample belong to category A or C?
e. Draw a bar graph for the frequency distribution

More Related Content

What's hot

frequency distribution
 frequency distribution frequency distribution
frequency distribution
Unsa Shakir
 
Descriptive Statistics, Numerical Description
Descriptive Statistics, Numerical DescriptionDescriptive Statistics, Numerical Description
Descriptive Statistics, Numerical Description
getyourcheaton
 
Descriptive statistics
Descriptive statisticsDescriptive statistics
Descriptive statistics
kemdoby
 
Descriptive statistics
Descriptive statisticsDescriptive statistics
Descriptive statistics
Aileen Balbido
 
Business Statistics Chapter 3
Business Statistics Chapter 3Business Statistics Chapter 3
Business Statistics Chapter 3
Lux PP
 
Business Statistics Chapter 8
Business Statistics Chapter 8Business Statistics Chapter 8
Business Statistics Chapter 8
Lux PP
 
An Introduction to SPSS
An Introduction to SPSSAn Introduction to SPSS
An Introduction to SPSS
Rajesh Gunesh
 
Chap02 describing data; numerical
Chap02 describing data; numericalChap02 describing data; numerical
Chap02 describing data; numerical
Judianto Nugroho
 
Actuarial Statistics
Actuarial StatisticsActuarial Statistics
Actuarial Statistics
Mary Montoya
 
Basic business statistics 2
Basic business statistics 2Basic business statistics 2
Basic business statistics 2
Anwar Afridi
 
Some Important Discrete Probability Distributions
Some Important Discrete Probability DistributionsSome Important Discrete Probability Distributions
Some Important Discrete Probability Distributions
Yesica Adicondro
 
data_analysis_using_spss.docx
data_analysis_using_spss.docxdata_analysis_using_spss.docx
data_analysis_using_spss.docx
KevinShey1
 
spss teaching
spss teachingspss teaching
Descriptive Analysis in Statistics
Descriptive Analysis in StatisticsDescriptive Analysis in Statistics
Descriptive Analysis in Statistics
Azmi Mohd Tamil
 
What is Statistics
What is StatisticsWhat is Statistics
What is Statistics
sidra-098
 
History and definition of statistics
History and definition of statisticsHistory and definition of statistics
History and definition of statistics
Muhammad Kamran
 
BAB 2 PENYAJIAN DATA DG GRAFIK HISTOGRAM POLIGON OGIVE P2.ppt
BAB 2 PENYAJIAN DATA DG GRAFIK HISTOGRAM POLIGON OGIVE P2.pptBAB 2 PENYAJIAN DATA DG GRAFIK HISTOGRAM POLIGON OGIVE P2.ppt
BAB 2 PENYAJIAN DATA DG GRAFIK HISTOGRAM POLIGON OGIVE P2.ppt
zulfy485
 
Bbs11 ppt ch02
Bbs11 ppt ch02Bbs11 ppt ch02
Bbs11 ppt ch02
Tuul Tuul
 
Descriptive statistics
Descriptive statisticsDescriptive statistics
Descriptive statistics
Dr Resu Neha Reddy
 
Descriptive statistics
Descriptive statisticsDescriptive statistics
Descriptive statistics
mercy rani
 

What's hot (20)

frequency distribution
 frequency distribution frequency distribution
frequency distribution
 
Descriptive Statistics, Numerical Description
Descriptive Statistics, Numerical DescriptionDescriptive Statistics, Numerical Description
Descriptive Statistics, Numerical Description
 
Descriptive statistics
Descriptive statisticsDescriptive statistics
Descriptive statistics
 
Descriptive statistics
Descriptive statisticsDescriptive statistics
Descriptive statistics
 
Business Statistics Chapter 3
Business Statistics Chapter 3Business Statistics Chapter 3
Business Statistics Chapter 3
 
Business Statistics Chapter 8
Business Statistics Chapter 8Business Statistics Chapter 8
Business Statistics Chapter 8
 
An Introduction to SPSS
An Introduction to SPSSAn Introduction to SPSS
An Introduction to SPSS
 
Chap02 describing data; numerical
Chap02 describing data; numericalChap02 describing data; numerical
Chap02 describing data; numerical
 
Actuarial Statistics
Actuarial StatisticsActuarial Statistics
Actuarial Statistics
 
Basic business statistics 2
Basic business statistics 2Basic business statistics 2
Basic business statistics 2
 
Some Important Discrete Probability Distributions
Some Important Discrete Probability DistributionsSome Important Discrete Probability Distributions
Some Important Discrete Probability Distributions
 
data_analysis_using_spss.docx
data_analysis_using_spss.docxdata_analysis_using_spss.docx
data_analysis_using_spss.docx
 
spss teaching
spss teachingspss teaching
spss teaching
 
Descriptive Analysis in Statistics
Descriptive Analysis in StatisticsDescriptive Analysis in Statistics
Descriptive Analysis in Statistics
 
What is Statistics
What is StatisticsWhat is Statistics
What is Statistics
 
History and definition of statistics
History and definition of statisticsHistory and definition of statistics
History and definition of statistics
 
BAB 2 PENYAJIAN DATA DG GRAFIK HISTOGRAM POLIGON OGIVE P2.ppt
BAB 2 PENYAJIAN DATA DG GRAFIK HISTOGRAM POLIGON OGIVE P2.pptBAB 2 PENYAJIAN DATA DG GRAFIK HISTOGRAM POLIGON OGIVE P2.ppt
BAB 2 PENYAJIAN DATA DG GRAFIK HISTOGRAM POLIGON OGIVE P2.ppt
 
Bbs11 ppt ch02
Bbs11 ppt ch02Bbs11 ppt ch02
Bbs11 ppt ch02
 
Descriptive statistics
Descriptive statisticsDescriptive statistics
Descriptive statistics
 
Descriptive statistics
Descriptive statisticsDescriptive statistics
Descriptive statistics
 

Similar to 1-Organizing and Graphing Qualitative data 3.pptx

Lab 1 intro
Lab 1 introLab 1 intro
Lab 1 intro
Erik D. Davenport
 
Basics of statistics by Arup Nama Das
Basics of statistics by Arup Nama DasBasics of statistics by Arup Nama Das
Basics of statistics by Arup Nama Das
Arup8
 
Student’s presentation
Student’s presentationStudent’s presentation
Student’s presentation
Pwalmiki
 
presentation
presentationpresentation
presentation
Pwalmiki
 
Statistics 3, 4
Statistics 3, 4Statistics 3, 4
Statistics 3, 4
Diana Diana
 
SP and R.pptx
SP and R.pptxSP and R.pptx
SP and R.pptx
ssuserfc98db
 
Medical statistics
Medical statisticsMedical statistics
Medical statistics
Amany El-seoud
 
Adv.-Statistics-2.pptx
Adv.-Statistics-2.pptxAdv.-Statistics-2.pptx
Adv.-Statistics-2.pptx
marissacasarenoalmue
 
Principlles of statistics
Principlles of statisticsPrinciplles of statistics
Principlles of statistics
Shakhawan Khurshid
 
Measures of Central Tendency.pptx
Measures of Central Tendency.pptxMeasures of Central Tendency.pptx
Measures of Central Tendency.pptx
Melba Shaya Sweety
 
Mb0040 statistics for management
Mb0040   statistics for managementMb0040   statistics for management
Mb0040 statistics for management
smumbahelp
 
9주차
9주차9주차
Lecture_4_-_Data_Management_using_Statistics(3).pptx
Lecture_4_-_Data_Management_using_Statistics(3).pptxLecture_4_-_Data_Management_using_Statistics(3).pptx
Lecture_4_-_Data_Management_using_Statistics(3).pptx
ssuser10eca22
 
Source of DATA
Source of DATASource of DATA
Source of DATA
Nahid Amin
 
Biostatistics Survey Project on Menstrual cup v/s Sanitary Pads
Biostatistics Survey Project on Menstrual cup v/s Sanitary PadsBiostatistics Survey Project on Menstrual cup v/s Sanitary Pads
Biostatistics Survey Project on Menstrual cup v/s Sanitary Pads
Cheshta Rawat
 
2-L2 Presentation of data.pptx
2-L2 Presentation of data.pptx2-L2 Presentation of data.pptx
2-L2 Presentation of data.pptx
ssuser03ba7c
 
Descriptive statistics.ppt
Descriptive statistics.pptDescriptive statistics.ppt
Descriptive statistics.ppt
PerumalPitchandi
 
3. Descriptive statistics.ppt
3. Descriptive statistics.ppt3. Descriptive statistics.ppt
3. Descriptive statistics.ppt
Doris729291
 
3. Descriptive statistics.pbzfdsdfbbttsh
3. Descriptive statistics.pbzfdsdfbbttsh3. Descriptive statistics.pbzfdsdfbbttsh
3. Descriptive statistics.pbzfdsdfbbttsh
AjithGhoyal
 
3. Descriptive statistics.ppt
3. Descriptive statistics.ppt3. Descriptive statistics.ppt
3. Descriptive statistics.ppt
TanushreeBiswas23
 

Similar to 1-Organizing and Graphing Qualitative data 3.pptx (20)

Lab 1 intro
Lab 1 introLab 1 intro
Lab 1 intro
 
Basics of statistics by Arup Nama Das
Basics of statistics by Arup Nama DasBasics of statistics by Arup Nama Das
Basics of statistics by Arup Nama Das
 
Student’s presentation
Student’s presentationStudent’s presentation
Student’s presentation
 
presentation
presentationpresentation
presentation
 
Statistics 3, 4
Statistics 3, 4Statistics 3, 4
Statistics 3, 4
 
SP and R.pptx
SP and R.pptxSP and R.pptx
SP and R.pptx
 
Medical statistics
Medical statisticsMedical statistics
Medical statistics
 
Adv.-Statistics-2.pptx
Adv.-Statistics-2.pptxAdv.-Statistics-2.pptx
Adv.-Statistics-2.pptx
 
Principlles of statistics
Principlles of statisticsPrinciplles of statistics
Principlles of statistics
 
Measures of Central Tendency.pptx
Measures of Central Tendency.pptxMeasures of Central Tendency.pptx
Measures of Central Tendency.pptx
 
Mb0040 statistics for management
Mb0040   statistics for managementMb0040   statistics for management
Mb0040 statistics for management
 
9주차
9주차9주차
9주차
 
Lecture_4_-_Data_Management_using_Statistics(3).pptx
Lecture_4_-_Data_Management_using_Statistics(3).pptxLecture_4_-_Data_Management_using_Statistics(3).pptx
Lecture_4_-_Data_Management_using_Statistics(3).pptx
 
Source of DATA
Source of DATASource of DATA
Source of DATA
 
Biostatistics Survey Project on Menstrual cup v/s Sanitary Pads
Biostatistics Survey Project on Menstrual cup v/s Sanitary PadsBiostatistics Survey Project on Menstrual cup v/s Sanitary Pads
Biostatistics Survey Project on Menstrual cup v/s Sanitary Pads
 
2-L2 Presentation of data.pptx
2-L2 Presentation of data.pptx2-L2 Presentation of data.pptx
2-L2 Presentation of data.pptx
 
Descriptive statistics.ppt
Descriptive statistics.pptDescriptive statistics.ppt
Descriptive statistics.ppt
 
3. Descriptive statistics.ppt
3. Descriptive statistics.ppt3. Descriptive statistics.ppt
3. Descriptive statistics.ppt
 
3. Descriptive statistics.pbzfdsdfbbttsh
3. Descriptive statistics.pbzfdsdfbbttsh3. Descriptive statistics.pbzfdsdfbbttsh
3. Descriptive statistics.pbzfdsdfbbttsh
 
3. Descriptive statistics.ppt
3. Descriptive statistics.ppt3. Descriptive statistics.ppt
3. Descriptive statistics.ppt
 

Recently uploaded

Advanced Java[Extra Concepts, Not Difficult].docx
Advanced Java[Extra Concepts, Not Difficult].docxAdvanced Java[Extra Concepts, Not Difficult].docx
Advanced Java[Extra Concepts, Not Difficult].docx
adhitya5119
 
Your Skill Boost Masterclass: Strategies for Effective Upskilling
Your Skill Boost Masterclass: Strategies for Effective UpskillingYour Skill Boost Masterclass: Strategies for Effective Upskilling
Your Skill Boost Masterclass: Strategies for Effective Upskilling
Excellence Foundation for South Sudan
 
NEWSPAPERS - QUESTION 1 - REVISION POWERPOINT.pptx
NEWSPAPERS - QUESTION 1 - REVISION POWERPOINT.pptxNEWSPAPERS - QUESTION 1 - REVISION POWERPOINT.pptx
NEWSPAPERS - QUESTION 1 - REVISION POWERPOINT.pptx
iammrhaywood
 
What is Digital Literacy? A guest blog from Andy McLaughlin, University of Ab...
What is Digital Literacy? A guest blog from Andy McLaughlin, University of Ab...What is Digital Literacy? A guest blog from Andy McLaughlin, University of Ab...
What is Digital Literacy? A guest blog from Andy McLaughlin, University of Ab...
GeorgeMilliken2
 
A Independência da América Espanhola LAPBOOK.pdf
A Independência da América Espanhola LAPBOOK.pdfA Independência da América Espanhola LAPBOOK.pdf
A Independência da América Espanhola LAPBOOK.pdf
Jean Carlos Nunes Paixão
 
BÀI TẬP BỔ TRỢ TIẾNG ANH LỚP 9 CẢ NĂM - GLOBAL SUCCESS - NĂM HỌC 2024-2025 - ...
BÀI TẬP BỔ TRỢ TIẾNG ANH LỚP 9 CẢ NĂM - GLOBAL SUCCESS - NĂM HỌC 2024-2025 - ...BÀI TẬP BỔ TRỢ TIẾNG ANH LỚP 9 CẢ NĂM - GLOBAL SUCCESS - NĂM HỌC 2024-2025 - ...
BÀI TẬP BỔ TRỢ TIẾNG ANH LỚP 9 CẢ NĂM - GLOBAL SUCCESS - NĂM HỌC 2024-2025 - ...
Nguyen Thanh Tu Collection
 
How to Add Chatter in the odoo 17 ERP Module
How to Add Chatter in the odoo 17 ERP ModuleHow to Add Chatter in the odoo 17 ERP Module
How to Add Chatter in the odoo 17 ERP Module
Celine George
 
Pengantar Penggunaan Flutter - Dart programming language1.pptx
Pengantar Penggunaan Flutter - Dart programming language1.pptxPengantar Penggunaan Flutter - Dart programming language1.pptx
Pengantar Penggunaan Flutter - Dart programming language1.pptx
Fajar Baskoro
 
How to deliver Powerpoint Presentations.pptx
How to deliver Powerpoint  Presentations.pptxHow to deliver Powerpoint  Presentations.pptx
How to deliver Powerpoint Presentations.pptx
HajraNaeem15
 
Leveraging Generative AI to Drive Nonprofit Innovation
Leveraging Generative AI to Drive Nonprofit InnovationLeveraging Generative AI to Drive Nonprofit Innovation
Leveraging Generative AI to Drive Nonprofit Innovation
TechSoup
 
Natural birth techniques - Mrs.Akanksha Trivedi Rama University
Natural birth techniques - Mrs.Akanksha Trivedi Rama UniversityNatural birth techniques - Mrs.Akanksha Trivedi Rama University
Natural birth techniques - Mrs.Akanksha Trivedi Rama University
Akanksha trivedi rama nursing college kanpur.
 
Chapter wise All Notes of First year Basic Civil Engineering.pptx
Chapter wise All Notes of First year Basic Civil Engineering.pptxChapter wise All Notes of First year Basic Civil Engineering.pptx
Chapter wise All Notes of First year Basic Civil Engineering.pptx
Denish Jangid
 
Walmart Business+ and Spark Good for Nonprofits.pdf
Walmart Business+ and Spark Good for Nonprofits.pdfWalmart Business+ and Spark Good for Nonprofits.pdf
Walmart Business+ and Spark Good for Nonprofits.pdf
TechSoup
 
How to Build a Module in Odoo 17 Using the Scaffold Method
How to Build a Module in Odoo 17 Using the Scaffold MethodHow to Build a Module in Odoo 17 Using the Scaffold Method
How to Build a Module in Odoo 17 Using the Scaffold Method
Celine George
 
C1 Rubenstein AP HuG xxxxxxxxxxxxxx.pptx
C1 Rubenstein AP HuG xxxxxxxxxxxxxx.pptxC1 Rubenstein AP HuG xxxxxxxxxxxxxx.pptx
C1 Rubenstein AP HuG xxxxxxxxxxxxxx.pptx
mulvey2
 
คำศัพท์ คำพื้นฐานการอ่าน ภาษาอังกฤษ ระดับชั้น ม.1
คำศัพท์ คำพื้นฐานการอ่าน ภาษาอังกฤษ ระดับชั้น ม.1คำศัพท์ คำพื้นฐานการอ่าน ภาษาอังกฤษ ระดับชั้น ม.1
คำศัพท์ คำพื้นฐานการอ่าน ภาษาอังกฤษ ระดับชั้น ม.1
สมใจ จันสุกสี
 
Wound healing PPT
Wound healing PPTWound healing PPT
Wound healing PPT
Jyoti Chand
 
writing about opinions about Australia the movie
writing about opinions about Australia the moviewriting about opinions about Australia the movie
writing about opinions about Australia the movie
Nicholas Montgomery
 
The History of Stoke Newington Street Names
The History of Stoke Newington Street NamesThe History of Stoke Newington Street Names
The History of Stoke Newington Street Names
History of Stoke Newington
 
ISO/IEC 27001, ISO/IEC 42001, and GDPR: Best Practices for Implementation and...
ISO/IEC 27001, ISO/IEC 42001, and GDPR: Best Practices for Implementation and...ISO/IEC 27001, ISO/IEC 42001, and GDPR: Best Practices for Implementation and...
ISO/IEC 27001, ISO/IEC 42001, and GDPR: Best Practices for Implementation and...
PECB
 

Recently uploaded (20)

Advanced Java[Extra Concepts, Not Difficult].docx
Advanced Java[Extra Concepts, Not Difficult].docxAdvanced Java[Extra Concepts, Not Difficult].docx
Advanced Java[Extra Concepts, Not Difficult].docx
 
Your Skill Boost Masterclass: Strategies for Effective Upskilling
Your Skill Boost Masterclass: Strategies for Effective UpskillingYour Skill Boost Masterclass: Strategies for Effective Upskilling
Your Skill Boost Masterclass: Strategies for Effective Upskilling
 
NEWSPAPERS - QUESTION 1 - REVISION POWERPOINT.pptx
NEWSPAPERS - QUESTION 1 - REVISION POWERPOINT.pptxNEWSPAPERS - QUESTION 1 - REVISION POWERPOINT.pptx
NEWSPAPERS - QUESTION 1 - REVISION POWERPOINT.pptx
 
What is Digital Literacy? A guest blog from Andy McLaughlin, University of Ab...
What is Digital Literacy? A guest blog from Andy McLaughlin, University of Ab...What is Digital Literacy? A guest blog from Andy McLaughlin, University of Ab...
What is Digital Literacy? A guest blog from Andy McLaughlin, University of Ab...
 
A Independência da América Espanhola LAPBOOK.pdf
A Independência da América Espanhola LAPBOOK.pdfA Independência da América Espanhola LAPBOOK.pdf
A Independência da América Espanhola LAPBOOK.pdf
 
BÀI TẬP BỔ TRỢ TIẾNG ANH LỚP 9 CẢ NĂM - GLOBAL SUCCESS - NĂM HỌC 2024-2025 - ...
BÀI TẬP BỔ TRỢ TIẾNG ANH LỚP 9 CẢ NĂM - GLOBAL SUCCESS - NĂM HỌC 2024-2025 - ...BÀI TẬP BỔ TRỢ TIẾNG ANH LỚP 9 CẢ NĂM - GLOBAL SUCCESS - NĂM HỌC 2024-2025 - ...
BÀI TẬP BỔ TRỢ TIẾNG ANH LỚP 9 CẢ NĂM - GLOBAL SUCCESS - NĂM HỌC 2024-2025 - ...
 
How to Add Chatter in the odoo 17 ERP Module
How to Add Chatter in the odoo 17 ERP ModuleHow to Add Chatter in the odoo 17 ERP Module
How to Add Chatter in the odoo 17 ERP Module
 
Pengantar Penggunaan Flutter - Dart programming language1.pptx
Pengantar Penggunaan Flutter - Dart programming language1.pptxPengantar Penggunaan Flutter - Dart programming language1.pptx
Pengantar Penggunaan Flutter - Dart programming language1.pptx
 
How to deliver Powerpoint Presentations.pptx
How to deliver Powerpoint  Presentations.pptxHow to deliver Powerpoint  Presentations.pptx
How to deliver Powerpoint Presentations.pptx
 
Leveraging Generative AI to Drive Nonprofit Innovation
Leveraging Generative AI to Drive Nonprofit InnovationLeveraging Generative AI to Drive Nonprofit Innovation
Leveraging Generative AI to Drive Nonprofit Innovation
 
Natural birth techniques - Mrs.Akanksha Trivedi Rama University
Natural birth techniques - Mrs.Akanksha Trivedi Rama UniversityNatural birth techniques - Mrs.Akanksha Trivedi Rama University
Natural birth techniques - Mrs.Akanksha Trivedi Rama University
 
Chapter wise All Notes of First year Basic Civil Engineering.pptx
Chapter wise All Notes of First year Basic Civil Engineering.pptxChapter wise All Notes of First year Basic Civil Engineering.pptx
Chapter wise All Notes of First year Basic Civil Engineering.pptx
 
Walmart Business+ and Spark Good for Nonprofits.pdf
Walmart Business+ and Spark Good for Nonprofits.pdfWalmart Business+ and Spark Good for Nonprofits.pdf
Walmart Business+ and Spark Good for Nonprofits.pdf
 
How to Build a Module in Odoo 17 Using the Scaffold Method
How to Build a Module in Odoo 17 Using the Scaffold MethodHow to Build a Module in Odoo 17 Using the Scaffold Method
How to Build a Module in Odoo 17 Using the Scaffold Method
 
C1 Rubenstein AP HuG xxxxxxxxxxxxxx.pptx
C1 Rubenstein AP HuG xxxxxxxxxxxxxx.pptxC1 Rubenstein AP HuG xxxxxxxxxxxxxx.pptx
C1 Rubenstein AP HuG xxxxxxxxxxxxxx.pptx
 
คำศัพท์ คำพื้นฐานการอ่าน ภาษาอังกฤษ ระดับชั้น ม.1
คำศัพท์ คำพื้นฐานการอ่าน ภาษาอังกฤษ ระดับชั้น ม.1คำศัพท์ คำพื้นฐานการอ่าน ภาษาอังกฤษ ระดับชั้น ม.1
คำศัพท์ คำพื้นฐานการอ่าน ภาษาอังกฤษ ระดับชั้น ม.1
 
Wound healing PPT
Wound healing PPTWound healing PPT
Wound healing PPT
 
writing about opinions about Australia the movie
writing about opinions about Australia the moviewriting about opinions about Australia the movie
writing about opinions about Australia the movie
 
The History of Stoke Newington Street Names
The History of Stoke Newington Street NamesThe History of Stoke Newington Street Names
The History of Stoke Newington Street Names
 
ISO/IEC 27001, ISO/IEC 42001, and GDPR: Best Practices for Implementation and...
ISO/IEC 27001, ISO/IEC 42001, and GDPR: Best Practices for Implementation and...ISO/IEC 27001, ISO/IEC 42001, and GDPR: Best Practices for Implementation and...
ISO/IEC 27001, ISO/IEC 42001, and GDPR: Best Practices for Implementation and...
 

1-Organizing and Graphing Qualitative data 3.pptx

  • 1. Statistics - STAT100 1- Statistics and types of Statistics : What is statistics ? Definition : statistics is the science of collecting , analyzing , presenting , interpreting data, as well as of making decisions based on such analyses.
  • 2.
  • 3. Definitions ( a ) Descriptive statistics : consists of methods for organizing , displaying , and describing data by using tables , graphs and summary measures . ( b ) Inferential statistics : consists of methods that use sample results to help make decisions about a population .
  • 4. Population. Sample : A set of units that is interest to study . A subset of the population . Examples Of a population Examples Of a Sample : -Children in a school -Students in a college -animals on a farm -etc. -Children in classroom in a school - Civil engineering students at the university -a child takes a sample of five cookies from a recently baked batch of thirty chocolate chip cookies.
  • 5. Data Definition :data set is the collection of observed values of the statistical variable . types of statistical data Statistical Data 𝟏)𝐐𝐮𝐚𝐥𝐢𝐭𝐚𝐭𝐢𝐯𝐞 𝐃𝐚𝐭𝐚 𝐜𝐚𝐭𝐞𝐠𝐨𝐫𝐢𝐞𝐬 𝟐)𝐐𝐮𝐚𝐧𝐭𝐢𝐭𝐚𝐭𝐢𝐯𝐞 𝐃𝐚𝐭𝐚𝐭 (𝐧𝐮𝐦𝐛𝐞𝐫𝐬) 𝟏)𝐃𝐢𝐬𝐜𝐫𝐞𝐭𝐞 𝐜𝐨𝐮𝐧𝐭𝐬 , {𝟏, 𝟑, 𝟓, 𝟕, … } 𝟐)𝐂𝐨𝐧𝐭𝐢𝐧𝐮𝐨𝐮𝐬 𝐦𝐞𝐚𝐬𝐮𝐫𝐞𝐦𝐞𝐧𝐭𝐬 , 𝟏, 𝟒
  • 6. Definitions 1- Qualitative data : Data generated by Qualitative variable . 2- Quantitative data : Data generated by quantitative variable
  • 7. Organizing and Graphing Qualitative data Data sets are Organized into tables and displayed using graphs . First we discuss of raw data . definition : Raw data --- Data recoded in the sequence in which they are collected and before are ranked .
  • 8. EXAMPLE :1 A sample of 30 employees from large companies was selected, and these employees were asked how stressful their jobs were. The responses of these employees are recorded below, where very represents very stressful, somewhat means somewhat stressful, and none stands for not stressful at all. Somewhat none somewhat very very none Very somewhat somewhat very somewhat somewhat very somewhat none very none somewhat somewhat very somewhat somewhat very none somewhat very very somewhat none somewhat Construct a frequency distribution table for these data?
  • 10. Relative Frequency and Percentage Distribution Relative Frequency of category = Frequency of that category Sum of all Frequencies Percentage = (Relative Frequency ) . 100%
  • 11. Example (2) Determine the relative Frequency and percentage distribution for the data in example (1) Solution
  • 12. stressful on jobs Tally Frequency (f ) Relative Percentage very |||| |||| 10 10 30 = 0.333 0.333 × 100 = 33.3 somewhat |||| || |||| 14 14 30 = 0.467 0.467 × 100 = 46.7 none |||| | 6 6 30 = 0.20 0.2 × 100 = 20 30 1 100 Solution Example :1 and 2 in one table
  • 13. Figure 2.1 Bar graph for the frequency distribution of Table 2.4. Very Somewhat None Bar Graphs
  • 14. H.W 1 2.3 The following data give the results of a sample survey. The letters A, B, and C represent the three categories. A B B A C B C C C A C B C A C C B C C A A B C C B C B A C A a. Prepare a frequency distribution table. b. Calculate the relative frequencies and percentages for all categories. c. What percentage of the elements in this sample belong to category B? d. What percentage of the elements in this sample belong to category A or C? e. Draw a bar graph for the frequency distribution