
Recommended
More Related Content
What's hot
What's hot (20)
Viewers also liked
Viewers also liked (16)
Similar to 1.embedded based system for the study of heats of mixing of binary liquid mixtures
Similar to 1.embedded based system for the study of heats of mixing of binary liquid mixtures (20)
Recently uploaded
Recently uploaded (20)
1.embedded based system for the study of heats of mixing of binary liquid mixtures
- 1. International Journal of Current Research In Science, Engineering and Technology (IJCRSET) Volume 1, Issue 4, August 2016, PP 01-12 www.ijcrset.com www.ijcrset.com 1 | Page Embedded Based System For The Study Of Heats Of Mixing Of Binary Liquid Mixtures P.S.S Sushama1 , K.Malakondaiah 2 , C.Nagaraja3 123 (Department of Instrumentation and USIC, SKDU, Ananthapur, India) ______________________________________________________________________________________ Abstract : Studies of heats of reactions of binary liquid mixtures are given a considerable importance in understanding the nature of molecular interactions. Such studies mainly help to know the enthalpies of liquid mixtures. The present study deals with design of a simple embedded based system for measuring heat of mixing of binary liquid mixtures. The system consists of two units, cell assembly and data acquisition system. One of the components of the binary mixture is taken into the cell, other component is injected in to the cell through appropriate mechanical arrangement. The reaction on mixing causes the thermal changes which are sensed by the thermal sensor, that can be measured up to 10-4o C. The entire unit is interfaced to LPC 2366 ARM based controller (A less power consumption device made by philips). The ARM controller sends the data to the Personal Computer through the serial port and software is developed to calculate enthalpy values. A comparison of the results obtained with the literature data showed good agreement. The designed system can be used as an alternative for the measuring heats of mixing of binary liquid mixtures. The paper deals with the design aspects both hardware and software features of the system. _______________________________________________________________________________________ Keywords - liquids, mixtures, ARM Processor, embedded I. INTRODUCTION Heat of mixing data for binary liquid systems is useful for both chemists and engineers to know the nature of the solutions and design the heat transfer equipment (heat exchangers). As the data of the non ideal systems are very limited and the effect of temperature are very rarely has been investigated. Based on heat transfer theory, the relations between the heat effect generated and the quantity measured in the calorimeter known as the heat balance equation is established, which expresses the change of temperature directly as a function of the heat produced in a calorimeter and is applied to design different types of calorimeters. A number of calorimeter is available micro to macro and simple to complex in design. The calorimeters are differed by their principle, heat flow calorimeter, Benson et. al.1 Picker flow calorimeter, Fortier and Benson2 in this type of calorimeter excess heat capacities of mixtures of non-electrolytes were determined from volumetric heat capacity. Steady state and composition scanning differential flow micro calorimeters by Patrick Picker et. al.3,4 They developed two different flow micro calorimeters, one is of the adiabatic type and can be used to measure ΔT mixing for liquid phase reactions, and other can be operated under either adiabatic or isothermal conditions and serves for either gas or liquid phase investigations. The available commercial calorimeters like Parr5,6 and ITC are sophisticated and very costly. Hence an attempt is made to design adiabatic micro calorimeter which is simpler and versatile for a rapid and fairly accurate measurement of exothermic and endothermic heats of mixing for binary liquid mixtures. The proposed system shows a new approach which is attached with all the advantages of any embedded based system in speed and compatibility. These measurements assume a great significance because of diversified applications of these measurements in industries and R&D purposes. II. MATERIALS AND METHODS The chemicals used in the present work Carbon tetrachloride, n-hexane, Cyclohexane , Dimehyl formamide, methyl-tert-butylethane (MTBE), Chlorobenzene, Nitrobenzene, Carbontettachloride are obtained from M/s Fulka Ltd.,Bombay. Benzene (Spectroscopic grade) was obtained from M/s SD Fine Chemicals, Boisar, India. Dimethoxyethane are obtained from SD Fine Chemicals, Boisar, India The chemicals used here are used without any further purification. methyl-isobutyl ketone, methyl-ethylketone obtained from BDH Ltd., and dried over 4A molecular sieves for 4 – 5 days and purified by fractional distillation. Pure component properties used to calculate excess enthalpies such as molecular weight, density and heat capacity are collected and tabulated in Table 1. Measured density, boiling point and refractive index of the the compounds and compared with literature values reported by Riddick et al7 and Ian M. Smallwood8 to ensure the purity of the compounds. The data is tabulated in Table2. From Table2, it is found that the measured properties are in good agreement with literature values9,10 . The purity of the compounds are checked and further confirmed by GC, a
- 2. International Journal of Current Research In Science, Engineering and Technology www.ijcrset.com 2 | Page single sharp peak. The vibrator, Nokia 1100 (range is 500 milli volts to one volt) is used as a device to stir the mixture inside the cell, the ARM7TDMI based LPC2366 controller (NXP Philips), 12V and 2Amp stepper motor similar to that used in HP printer, constant current source REF200 and 5 k thermistor are purchased from local electronic shop, Ahmedabad, India. Micro syringe (Borosil) of 10 ml capacity, Dewar flask (Eagle) of 20 ml capacity are obtained from Ahmedabad, India. Insulating materials is Polytherific foam (PUF) from M/s Bharathi Refrigeration systems from Ahmedabad, India. The heats of mixing is calculated using the equation. Where T temperature difference, w is weight and CP is heat capacity of the components, C.C is cell constant. Suffixes represent components 1 and 2 respectively. The pure component data is collected from literature is tabulated in Table2. Table 1 Properties of pure components from literature value Table 2 Comparison of properties of pure components Sl. No. Name of the compoun d Mole cular weig ht Density g/cc Cp, Cal/ mol/o C Chemical Formula Re fer en ces 1 DMF 73 0.945 36 C4H10O2 5 2 MIBK 100 0.801 46 C6H12O 3 MEK 72 0.805 38 C4H10O 4 MTBE 88 0.741 44.8 C5H12O 5 Benzen e 78 0.790 31 C6H6 6 Chloro Benzen e 113 1.106 35 C4H5cl 7 Nitro benzen e 123 1.204 44 C6H5NO2 8 Hexane 86 0.659 42.0 C6H14 9 Cyclo hexane 84 0.778 36.4 C6H12 10 Ethanol 46 0.789 27 C6H5O 11 Water 18 0.998 18 H2O 12 Carbon tetrachl oride 154 1.580 32 CCl4 Sl. N o. Name of the compoun d Density g/cc Boiling point, o C Refractive Index Ref. Expt. Lit. Expt. Lit. Expt. Lit. 1 DMF 0.9453 0.945 152.6 153 1.4276 1.427 5 2 MIBK 0.8007 0.801 116.3 116 1.3945 1.394 3 MEK 0.8039 0.805 79.8 80 1.3772 1.377 4 MTBE 0.7402 0.741 55.2 55 1.3686 1.369 5 Benzene 0.7896 0.790 79.8 80 1.4978 1.498 6 ChloroBe nzene 1.1062 1.106 131.7 132 1.5236 1.523 7 Nitro benzene 1.2038 1.204 210.8 211 1.5488 1.550 8 Hexane 0.6578 0.659 69.4 69 1.3725 1.372 9 Cyclo hexane 0.7782 0.778 80.6 81 1.4242 1.424 10 Ethanol 0.7886 0.789 78.2 78 1.3586 1.359 11 Water 0.9982 0.998 99.8 100 1.3323 1.332 12 Carbon tetrachlor ide 1.5796 1.580 75.6 76 1.4592 1.459 CCCwCwTH PP E .2211
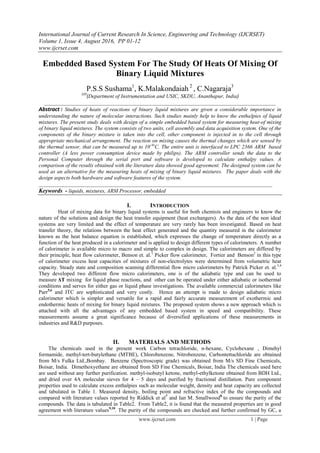
- 3. International Journal of Current Research In Science, Engineering and Technology www.ijcrset.com 3 | Page III. APPARATUS The calorimeter was designed to operate adiabatically and to allow the heats of mixing at room temperature to determine for the entire composition range. The designed system consists of two units. One is calorimeter cell assembly and other is data acquisition system. The Cell design is as shown in fig.1. The cell assembly consists of a test cell of 10 ml capacity inserted in a Dewar flask, which is insulated with Polytherific foam material about 2 mm thickness. One of the components of binary mixture is taken into the test cell and other component is added by means of dispensing unit. The dispensing unit consist of 12 V stepper motor, gear rod, coupling and micro syringe. Syringe is taken and attached to a gear rod. Stepper motor is plugged to a 12 V power supply and interfaced to LPC 2366 ARM controller. The syringe is connected to a feed tube at one end and the other end is kept in to the cell inside Dewar flask. A 5 k thermistor was taken. The thermistor is a glass covered probe with a resistance of 5 k at room temperature was sealed in the end of a piece of glass tubing which carried the leads a out of the calorimeter. One of the lead is connected to constant current source REF200 and the other lead is grounded to the power supply. The thermistor is inserted in the solution. Thermistor senses the temperature changes produced on adding second component to the other component which was held in the calorimeter cell. The sensed voltages are sent to the ADC channle2 of the port pin 24 of ADC of LPC 2366 ARM controller and data is acquired from the PC through the serial port .A tiny DC motor is taken and the leads are taken out and plugged to 900 mV power supply. A small glass tube is taken and bended at the edge to act this as a stirrer. The glass tube is fixed to the tip of the motor. Stirrer runs at a very low speed, so that the heat produced due to the stirrer is negligible. Here the designed tiny stirrer will not produce any frictional heat while stirring. Fig 1 Calorimeter Design IV. EXPERIMENTAL PROCEDURE The designed specification of calorimeter used for the measurement of heat of mixing for binary liquid mixtures is as shown in Fig.1. First data point is obtained by taking known quantity (5 ml) of component 1 into test cell and the 0.5 ml of component 2 is added through dispensing unit. A Vibrator is used to provide uniform distribution of the component 2 into component 1 in the cell. The temperature change is recorded at every 5 seconds. Experiment is stopped after reaching thermal equilibrium, i.e., no temperature change. 0.5 ml of component 2 is added to the mixture (5.5 ml) in the cell. The temperature change is recorded at every 5 seconds and stopped after reaching thermal equilibrium. The procedure is repeated till total amount of component 2 added is 5 ml with a 0.5 ml increment. . The temperature difference (T) is obtained by plotting time vs. temperature. Up to 50% weight percent range is covered in this way. To obtain the data over entire composition
- 4. International Journal of Current Research In Science, Engineering and Technology www.ijcrset.com 4 | Page range, the procedure is repeated by interchanging components 2 and 1, by taking 5 ml of component 2 in the cell and added component 1 in the increments of 0.5 ml. V. RESULTS AND DISCUSSIONS The designed calorimeter is tested with a number of binary systems. Table 3A Determination of cell constants using Cyclo Hexane + n-Hexane system Table 3B Determination of cell constants using Benzene + CCl4 system No adiabatic calorimeter is fully adiabatic, some heat will be lost by the sample to the sample holder. A mathematical correction factor, known as the cell constant, can be used to adjust the calorimetric result to account for these heat losses. Every calorimeter has a unique calorimeter constant. It may be calculated by applying a known amount of heat to the calorimeter and measuring the calorimeter's corresponding change in temperature. The calorimeter constant is then calculated by dividing the change in enthalpy (ΔH) by the change in temperature (ΔT). In our study we have determined calorimeter constant from the experiment results with the literature values for two different binary systems, cyclo alkane and normal chain alkane system, i.e., Mole fraction Temp diff HE , ca/g Cell const. X1 DT Expt Lit Diff Diff/ DT 0.1085 -0.0988 0.1988 2.3047 2.1060 21.3199 0.1958 -0.0589 0.1139 1.3839 1.2700 21.5664 0.2675 -0.0714 0.1501 1.6880 1.5380 21.5415 0.3275 -0.0964 0.2188 2.2971 2.0782 21.5661 0.3784 -0.1207 0.2945 2.8867 2.5922 21.4734 0.4221 -0.1389 0.3625 3.3584 2.9959 21.5644 0.4601 -0.1519 0.4221 3.6979 3.2758 21.5635 0.4934 -0.1599 0.4715 3.9204 3.4489 21.5625 0.5228 -0.1643 0.5122 4.0481 3.5359 21.5178 0.5490 -0.1642 0.5396 4.1030 3.5634 21.7014 0.5490 -0.1640 0.5613 4.1030 3.5417 21.5956 0.5750 -0.1661 0.5402 4.1010 3.5608 21.4378 0.6035 -0.1645 0.5071 4.0346 3.5275 21.4452 0.6349 -0.1597 0.4650 3.8862 3.4212 21.4257 0.6699 -0.1503 0.4120 3.6385 3.2264 21.4673 0.7089 -0.1363 0.3503 3.2776 2.9273 21.4791 0.7527 -0.1171 0.2812 2.8032 2.5220 21.5304 0.8023 -0.0959 0.2138 2.2488 2.0350 21.2275 0.8589 -0.0738 0.1529 1.7249 1.5720 21.3011 0.9241 -0.0656 0.1209 1.5116 1.3907 21.2090 429.4956 Average Value 21.4748 mole fraction temp dif Qmix , cal/g Diff Diff/DT X1 DT Expt. Lit. 0.9080 -0.0237 0.0411 0.554664 -0.51356 21.66934 0.8315 -0.0426 0.080877 0.995101 -0.91422 21.46067 0.7669 -0.0576 0.118819 1.356356 -1.23754 21.48502 0.7116 -0.0698 0.155455 1.659999 -1.50454 21.55507 0.6638 -0.0810 0.193709 1.920077 -1.72637 21.31319 0.6220 -0.0897 0.229178 2.146178 -1.917 21.37839 0.5851 -0.0974 0.264939 2.345107 -2.08017 21.35696 0.5524 -0.1036 0.298827 2.521859 -2.22303 21.45784 0.5231 -0.1095 0.333726 2.680204 -2.34648 21.43627 0.4968 -0.1142 0.366933 2.823053 -2.45612 21.50718 0.0898 -0.0221 0.039784 0.518298 -0.47851 21.65221 0.1649 -0.0404 0.07907 0.943367 -0.8643 21.39349 0.2285 -0.0560 0.118393 1.300488 -1.18209 21.10883 0.2831 -0.0680 0.154438 1.606293 -1.45185 21.35081 0.3305 -0.0792 0.192308 1.872179 -1.67987 21.21049 0.3720 -0.0880 0.227491 2.106235 -1.87874 21.34937 0.4086 -0.0950 0.2605 2.314384 -2.05388 21.61982 0.4413 -0.1020 0.295708 2.501076 -2.20537 21.62126 0.4705 -0.1099 0.335864 2.669737 -2.33387 21.23633 0.4968 -0.1106 0.355366 2.823053 -2.46769 22.31182 429.4744 Average value 21.4772
- 5. International Journal of Current Research In Science, Engineering and Technology www.ijcrset.com 5 | Page cyclohexane + n-Hexane and aromatic and chlorinated alkanes, i.e., Benzene + Carbontetrachloride (CCl4)11 . Average value of the differences between experimental and literature values over the entire composition range was taken as the cell constant. It was found that the cell constant for both the systems is similar. The results are tabulated in Table 3A and Table 3B. The detailed calculation procedure is given in Appendix A. The recorded temperature values are smoothened for finding the temperature difference (ΔT) values and the enthalpy calculations done by using the C++ program. Appendix A Steps to calculate the cell constant The pure component data, molecular weight, heat capacity and density are collected from the literature. Cyclohexane (1) + n-Hexane (2) Component Molecular weight Heat capacity Density (g/cc) (cal/g. K) Cyclohexane 84.61 0.43251 0.7785 n-Hexane 86.18 0.48735 0.6548 First Data Point Weight of 5 ml of component 1 (w1) = 5 x 0.7785 = 3.8925 g Weight of 0.5 ml of component 2 (w2)= 0.5x 0.6548 = 0.3274 g Weight fraction = w1/(w1+w2) = 3.8925/(3.8925+0.3274)= 0.9224 Mole fracton of component 1, 2 2 1 1 1 1 1 MW w MW w MW w X = 18.86 3274.0 611.84 8925.3 611.84 8925.3 = 0.9241 Average molecular weight = x1*MW1 + (1-X1)*MW2 = 0.9241x84.61 + (1-0.9241)*86.18 = 84.3133 Totals Moles in the mixture = Moles of component 1 (n1) + Moles of component 2 (n2) = w1/MW! + w2/MW2 = 3.8925/84.61 + 0.3274/86.18 = 0.0501 Q1 = 0.0 Q2, (cal/g k) = -T(w1cp1 + w2cp2) T Q2 = -( -0.0656(3.8925 0.43251 + 0.3274 0.48735)) = 0.1209 QMixt = Q1 + Q2 = 0 + 0.1190 = 0.1190 Cal/g K Qmix, (Lit value)= 1.5116 Difference = Qmix, (Expt) - Qmix(Lit) = 0.1209 - 1.5116 = - 1.3907Cell Constant = Difference / T = - 1.3907/(-0.0656) = 21.2090 Second Data Point Weight of 5.5 ml mixture = 3.8925 + 0.3274 = 4.2199 g Weight of 0.5 ml component2 = 0.3274 g Step wise calculation of weight of each component in the mixture: Step 1: weight of mixture x weight fraction of component 1/average molecular weight of mixture (as in data point 1) Weight of component 1 = 4.2199 x 0.9224 = 3.8925 g Weight of component 2 in the mixture= 4.2199 x (1-0.9224) = 0.3274 8 Total weight of component 2 for second point = weight in the mixture and added weight = 0.3274 +0 .3274 = 0.6548 g Weight fraction = 3.8925/(3.8925 + 0.6548) = 0.8560 Mole fraction = 3.8925/84.16 +0.6548/86.18 = 0.8589
- 6. International Journal of Current Research In Science, Engineering and Technology www.ijcrset.com 6 | Page Average molecular weight = 0.8589 x 84.61 + (1-0.8589) x 86.18 = 84.4450 Total moles = 3.8925/84.61 + 0.6548/86.18 = 0.0538 Q1 is the heat of mixing Q1 = QMixt of data point 1 x weight fraction of component1/average molecular weight Q1 = 0.1209 x 0.9224/84.3133 = 0.0051 Q2, (cal/g k) = -T(w1cp1 + w2cp2 ) = - (-0.0738 x (3.8925 x 0.43251 + 0.3274 x 0.48735)) = 0.1478 Qmix = 0.0051 + 0.1478 = 0.1529 cal/g K Qmix, (Lit value)= 1.7249 Difference = Qmix, (Expt) - Qmix(Lit) = 0.1529 - 1.7249 = - 1.5720 Cell Constant = Difference / T = - 1.5720/(-0.0738) = 21.301 Third Data Point Weight of mixture (6ml) = 4.2199 + 0.3274 = 4.5473 g Weight of component 1 in the mixture = 4.5473 x 0.8560 = 3.8925 Weight of component 2 in the mixture = 4.5473 x (1-0.8560) = 0.6548 Total weight of component 2 for second point = weight in the mixture and added weight = 0.6548 + 0.3274 = 0.9822 g Weight fraction = 3.8925/(3.8925 + 0.9822) = 0.7985 Mole fraction = 3.8925/84.16 +0.9822/86.18 = 0. 8023 Average molecular weight = 0.7985 x 84.61 + (1-0.7985) x 86.18) = 84.5594 Total moles = 3.8925/84.61 + 0.9822/86.18 = 0.0576 Q1 = QMixt of data point 2 x weight fraction of component1/average molecular weight Q1 = 1.529 x 0.8560/84.4450 = 0.065 Q2, (cal/g k) = -T(w1cp1 + w2cp2 + E) = -(-0.09486 x (3.8925 x 0.43251 + 0.9822 x 0.48735)) = 0.2073 Qmix = 0.0065 + 0.2073 = 0.2138 cal/g K Qmix, (Lit value)= 2.488 Difference = Qmix, (Expt) - Qmix(Lit) = 0.2138 – 2.488 = - 2.035 Cell Constant = Difference / T = - 2.035/(-0.0959) = 21.2275 The procedure is followed for all data points and taken average value. Which is 21.4739 The step wise calculation procedure is presented in Appendix B. The graphs on mole fraction vs. enthalpy of binary liquid mixtures are drawn using excel sheet. The measured values of Excess enthalpies using the designed calorimeter for various systems are compared with the literature values. In this study MTBE with substitute compounds are taken and tabulated below. Appendix B The pure component data, molecular weight, heat capacity and density is collected from the literature. Methyl Tertiary Buty Ethane (MTBE)(1)_+ Benzene (2) Component Molecular weight Heat capacity Density (g/cc) cal/mol K (cal/g. K) MTBE 88.15 44.79 0.5081 0.7410 Benzene 78.00 31.00 0.3974 0.8675
- 7. International Journal of Current Research In Science, Engineering and Technology www.ijcrset.com 7 | Page First data point Weight of 5 ml of component 1 (w1) = 5 x 0.741 = 3.702g Weight of 0.5 ml of component 2 (w2)= 0.5x 0.8675= 0.4338 g Weight fraction = w1/(w1+w2) = 3.702/(3.702+0.4338) = 0.8951 Mole fracton of component 1, 2 2 1 1 1 1 1 MW w MW w MW w X = 78 4338.0 15.88 702.3 15.88 702.3 = 0.8831 Average molecular weight = x1*MW1 + (1-X1)*MW2 = 0.8831x88.15 + (1-0.8831)*78 = 87.0 Totals Moles in the mixture = Moles of component 1 (n1) + Moles of component 2 (n2) = w1/MW! + w2/MW2 = 3.702/88.15 + 0.4388/78 = 0.0476 Q1 = 0.0 Q2, (cal/g k) = -T(w1cp1 + w2cp2 + E) where E = cell constant = 21.4739 Q2 = -( -0.06457(3.8925 0.43251 + 0.3274 0.48735 + 21.4739)) = 0.5530 QMixt = Q1 + Q2 = 0 + 0.0553 = 0.05530 Cal/g K QMixt, ( Cla/mol K) = QMixt, ( Cla/g K) /total moles = 0.0553/0.0476 = 11.6825 QMixt = 11.6825x 4.186 = 48.9771 J/mol K Second Data Point Weight of 5.5 ml mixture = 4.1358 g Weight of 0.5 ml component2 = 0.4388 g Step wise calculation of weight of each component in the mixture: Step 1: weight of mixture x weight fraction of component 1/average molecular weight of mixture(as in data point 1) Weight of component 1 = 4.1358 x 0.8951/87 = 3.702 g Weight of component 2 in the mixture= 4.1358 – 3.702 + 0.4338 = 8.8675 g Total weight of component 2 for second point = weight in the mixture and added weight = 4.1358 – 3.702 + 0.4338 = 0.8675 g Weight fraction = 3.702/(3.702+0.8675) = 0.8102 Mole fraction = 78 8675.0 15.88 702.3 15.88 702.3 = 0.7906 Average molecular weight = 0.7906x88.15 + (1-0.7906)*78 = 86.0 Total moles = 3.702/88.15 + 0.8675/78 = 0.531 Q1 is the heat of mixing Q1 = QMixt of data point 1 x weight fraction of component1/average molecular weight Q1 = 0.533*0.8951/87 = 0.0235 Q2, (cal/g k) = -T(w1cp1 + w2cp2 + E) = -( 3.702*0.5081+0.8675*0.3974+ 21.4739)) = 0.9926 Qmix = 0.0235 + 0.9926 cal/g K = 1.0162 QMixt, ( Cla/mol K) = QMixt, ( Cla/g K) /total moles = 1.0162/0.0531 = 19.1303 QMixt =4.186* 19.1303 = 80.0796 J/mol K The procedure is followed for all data points.
- 8. International Journal of Current Research In Science, Engineering and Technology www.ijcrset.com 8 | Page Table 4 Comparison of HE values for MTBE + Benzene system Table 5 Comparison of HE values for MTBE + Chlorobenzene System Mole fraction Temp diff. HE , ca/g % dev % Abs. dev X1 DT Expt. Lit. 0.0702 -0.0377 61.66723 65.7224 -6.58 6.58 0.1312 -0.0656 101.4375 103.1158 -1.65 1.65 0.1847 -0.0833 121.8941 124.9320 -2.49 2.49 0.2320 -0.0969 134.7273 137.8477 -2.32 2.32 0.2741 -0.1135 150.273 145.4869 3.18 3.18 0.3118 -0.1106 140.068 149.8851 -7.01 7.01 0.3458 -0.1242 150.5544 152.2232 -1.11 1.11 0.3766 -0.1213 141.2712 153.2092 -8.45 8.45 0.4047 -0.1260 141.1457 153.2811 -8.60 8.60 0.4303 -0.1312 141.7238 152.7191 -7.76 7.76 0.4563 -0.1264 155.8413 151.5737 2.74 2.74 0.4856 -0.1215 156.2761 149.6136 4.26 4.26 0.5190 -0.1056 143.4629 146.5411 -2.15 2.15 0.5573 -0.0918 132.8393 141.9060 -6.83 6.83 0.6017 -0.0850 130.5302 135.0060 -3.43 3.43 0.6537 -0.0727 120.0582 124.7196 -3.88 3.88 0.7157 -0.0646 113.819 109.2392 4.02 4.02 0.7906 -0.0419 80.07923 85.7189 -7.04 7.04 0.8831 -0.0235 48.67686 50.1959 -3.12 3.12 86.62 Percent Average Deviation (PAAD) 4.56% mole fraction temp dif HE, Expt HE, Lit. % dev % Abs. dev X1 DT Cla/g Cla/g 0.0788 0.0385 -71.64272 -66.9476 6.55 6.55 0.1460 0.0864 -148.0908 -143.055 3.40 3.40 0.2041 0.1247 -200.8032 -210.02 -4.59 4.59 0.2549 0.1794 -272.6966 -264.025 3.18 3.18 0.2995 0.1985 -285.8596 -305.821 -6.98 6.98 0.3391 0.2549 -349.1017 -337.345 3.37 3.37 0.3744 0.2623 -342.6953 -360.589 -5.22 5.22 0.4062 0.2921 -365.1651 -377.279 -3.32 3.32 0.4349 0.3147 -377.281 -388.817 -3.06 3.06 0.4609 0.3571 -411.4704 -396.311 3.68 3.68 0.4872 0.3069 -384.2116 -400.949 -4.36 4.36 0.5166 0.2915 -385.3712 -402.623 -4.48 4.48 0.5499 0.2976 -414.3931 -399.995 3.47 3.47 0.5876 0.2741 -404.0098 -391.151 3.18 3.18 0.6310 0.2304 -361.9965 -373.34 -3.13 3.13 0.6813 0.1900 -320.8879 -342.619 -6.77 6.77 0.7403 0.1668 -301.8436 -293.525 2.76 2.76 0.8104 0.1168 -228.0132 -219.373 3.79 3.79 0.8953 0.0582 -122.1843 -115.891 5.15 5.15 80.45 PAAD 4.23%
- 9. International Journal of Current Research In Science, Engineering and Technology www.ijcrset.com 9 | Page Fig 2: MTBE + Benzene substituted compounds The comparison for three binary systems methyl tertiary butyl ether (MTBE) with benzene, chlorobenzene and Nitrobenzene12 is as shown in the figure 2. From the Tables 4 – 6, it is observed that the excess enthalpy values for MTBE and benzene are positive (156.3, 153.3 and 48.7, 50.2 maximum and minimum values for experimental and literature values respectively). The percent average absolute deviation (PAAD) calculated using eqn. (2) is 4.6%. For MTBE and chlorobenzene, it is negative with -76.6, -66.9 and - 414.4, -402.6 maximum and minimum values for experimental and literature values respectively and PAAD is 4.3%. The values for nitrobenzene are positive to negative with a PAAD of 7.6%. The maximum and minimum values for experimental and literature are 103.5 , 3.9 & -31.0. The higher percent deviation (7.6%) is due to the small values of excess enthalpies. Table 6 Comparison of HE values for MTBE + Nitro Benzene system mole fraction temp dif HE , Expt. HE , Lit. % dev % Abs. dev 0.0790 -0.03460 64.9066 57.12924 11.982 11.982 0.1465 -0.05047 88.6246 83.18271 6.140 6.140 0.2047 -0.05184 85.5674 93.53545 -9.312 9.312 0.2555 -0.06652 103.5125 95.70375 7.544 7.544 0.3002 -0.06061 89.4404 93.53582 -4.579 4.579 0.3399 -0.06734 94.4018 89.08179 5.635 5.635 0.3753 -0.06627 88.6210 83.47089 5.811 5.811 0.4070 -0.05681 72.6937 77.34162 -6.394 6.394 0.4357 -0.05516 67.6311 71.06154 -5.072 5.072 0.4618 -0.04823 61.6576 64.84383 -5.168 5.168 0.4881 -0.04726 61.8176 58.15572 5.924 5.924 0.5175 -0.03460 47.8459 50.24988 -5.024 5.024 0.5507 -0.02999 43.0956 40.93145 5.022 5.022 0.5885 -0.02176 32.4054 30.00963 7.393 7.393 0.6318 -0.00983 15.3460 17.36053 -13.128 13.128 0.6821 -0.00280 3.9234 3.0949 21.116 21.116 0.7409 0.00670 -13.1272 -12.0003 8.584 8.584 0.8110 0.01315 -26.4091 -25.2766 4.288 4.288 0.8956 0.01474 -31.0094 -28.9053 6.785 6.785 144.9 PAAD 7.6%
- 10. International Journal of Current Research In Science, Engineering and Technology www.ijcrset.com 10 | Page Table 7 Comparison of HE values for DMF + MIBK System Table 8 Comparison of HE values for DMF + MEK System Fig.3: DMF with ketones mole fraction temp dif HE , Expt. HE , Lit. % dev % Abs. dev 0.1038 -0.0291 46.469 44.616 3.99 3.99 0.1880 -0.0559 81.993 87.315 -6.49 6.49 0.2578 -0.0832 112.791 107.080 5.06 5.06 0.3165 -0.0954 120.398 116.434 3.29 3.29 0.3667 -0.1002 118.366 122.495 -3.49 3.49 0.4099 -0.1112 123.542 127.564 -3.25 3.25 0.4477 -0.1289 135.242 131.977 2.41 2.41 0.4809 -0.1419 141.294 135.551 4.06 4.06 0.5103 -0.1414 134.135 138.101 -2.96 2.96 0.5366 -0.1584 143.336 139.564 2.63 2.63 0.5626 -0.1405 144.914 139.975 3.41 3.41 0.5914 -0.1182 129.089 138.935 -7.63 7.63 0.6232 -0.1257 139.480 135.671 2.73 2.73 0.6587 -0.1040 121.933 129.232 -5.99 5.99 0.6984 -0.1028 124.170 118.633 4.46 4.46 0.7432 -0.0846 106.351 103.220 2.94 2.94 0.7942 -0.0597 79.388 83.368 -5.01 5.01 0.8527 -0.0446 61.985 61.195 1.28 1.28 0.9205 -0.0280 40.099 38.678 3.54 3.54 74.63 PAAD 3.93% Mole fraction temp dif HE , Expt. HE , Lit. % dev % Abs. dev 0.1391 -0.0756 162.723 139.003 14.58 14.58 0.2443 -0.1179 221.623 215.641 2.70 2.70 0.3265 -0.1432 242.307 257.387 -6.22 6.22 0.3926 -0.1758 270.856 285.953 -5.57 5.57 0.4469 -0.2085 295.428 309.162 -4.65 4.65 0.4923 -0.2407 316.253 328.827 -3.98 3.98 0.5308 -0.2850 349.362 345.031 1.24 1.24 0.5639 -0.2916 335.523 357.669 -6.60 6.60 0.5926 -0.3190 346.031 366.825 -6.01 6.01 0.6178 -0.3683 378.277 372.783 1.45 1.45 0.6423 -0.3156 355.885 376.137 -5.69 5.69 0.6689 -0.3442 398.299 376.385 5.50 5.50 0.6978 -0.3284 392.669 371.922 5.28 5.28 0.7293 -0.2970 368.535 360.660 2.14 2.14 0.7637 -0.2685 345.255 340.054 1.51 1.51 0.8016 -0.2258 303.091 307.351 -1.41 1.41 0.8434 -0.1958 271.337 260.136 4.13 4.13 0.8899 -0.1316 190.022 196.987 -3.67 3.67 0.9417 -0.0794 116.019 116.019 0.00 0.00 82.32 PAAD 4.33%
- 11. International Journal of Current Research In Science, Engineering and Technology www.ijcrset.com 11 | Page Similar observation were made (Tables7, 8) with dimethyl formamide(DMF) with methyl ethyl ketone (MEK) and mehyl isobutyl ketone (MIBK)13 systems. The PAAD are 3.9 % and 4.3% for DMF + MEK and DMF+MIBK respectively. From the figs.2 and 3, it can be seen that the experimental values are in good agreement with literature values. Table 9 Experimental values of HE for DME + Benzene System Mole fraction temp dif HE , Expt. HE , Lit. % dev % Abs. dev 0.0950 -0.1013 201.26 197.705 1.766 1.766 0.1735 -0.0958 174.28 189.773 -8.890 8.890 0.2395 -0.0956 161.37 160.594 0.481 0.481 0.2957 -0.1003 158.1 142.251 10.025 10.025 0.3442 -0.0912 136.77 134.310 1.798 1.798 0.3865 -0.1034 144.62 132.089 8.665 8.665 0.4236 -0.1023 137.16 132.161 3.644 3.644 0.4565 -0.0976 125.33 132.721 -5.897 5.897 0.4858 -0.1018 124.22 133.028 -7.091 7.091 0.5121 -0.1095 127.82 132.911 -3.983 3.983 0.5121 -0.1086 126.16 132.911 -5.351 5.351 0.5384 -0.0946 115.82 132.377 -14.296 14.296 0.5675 -0.0983 125.7 131.442 -4.568 4.568 0.6000 -0.1101 144.37 130.395 9.680 9.680 0.6363 -0.0997 137.33 130.095 5.269 5.269 0.6774 -0.0965 139.2 132.326 4.938 4.938 0.7241 -0.088 135.98 140.051 -2.994 2.994 0.7777 -0.1034 166.91 156.547 6.209 6.209 0.8400 -0.0982 169.25 179.709 -6.180 6.180 0.9130 -0.1023 179.57 177.836 0.966 0.966 112.690 5.63% Fig. 4 DME + Benzene The binary mixtures for Dimethoxyethane( DME) +Benzene set of results was fitted by the flowing equation to calculate the enthalpy. HE (j/mol) = 3553.1(x1-x2)4 - 159.31(x1-x2)3 + 221.25(x1-x2)2 - 10.094(x1-x2) + 532.07 (2) Excess enthalpy data is generated for a binary system dimethoxyethane and benzene at room temperature. Fig. 4 represents the experimental data and polynomial equation (2). The data along with the calculated values using equation (2) is reported in Table 8. The percet average absolute deviation over the entire composition range is 4.3%. Acknowledgements I would like to thank my professor K. Malakondaiah. For his guidance and I would equally extend my dexterous attitude to Dr.Y.V.L. Ravikumar, Technical officer IICT and Dr. B. Satyavathi, Principal Scientist IICT for their assistance and constant backup by helping throughout for the development of project because of which this project could be completed successfully.
- 12. International Journal of Current Research In Science, Engineering and Technology www.ijcrset.com 12 | Page REFERENCES 1. Benson, Mrazek, H.V Van Ness and Robert Rev. Sci. Instr. 26, 477 (1955). 2. Jean-Luc Fortier, George C Benson. Excess heat capacities of binary liquid mixtures determined with a Picker flow calorimeter. The Journal of Chemical Thermodynamics. 8, (5), 411-423, (1976). 3. Patrick Picker, Paul-André Leduc, Patrick R. Philip, Jacques E. Desnoyers. Heat capacity of solutions by flow microcalorimetry. The Journal of Chemical Thermodynamics 3 (5), 631-642, (1971). 4. P. Picker, C. Jolicoeur, J.E. Desnoyers. Steady state and composition scanning differential flow microcalorimeters. The Journal of Chemical Thermodynamics 1( 5), 469-483, (1969). 5. S.Viswanathan, M. AnandRao, D.H.L Prasad, M. Venkateswara Rao, J.Chem.Eng. Data 40, 99, (1995). 6. S.Viswanathan, M. AnandRao, D.H.L Prasad, M. Venkateswara Rao, J.Chem.Eng. Data 40, 1056, (1995). 7. Handbook of organic solvent properties by Ian M. Smallwood Consultant. 8. J. A. Reddick, W.B. Bunger, T. K. Sanako. Organic Solvents: Physical properties and methods of purification, 4th ed. Wiley-Inter science, New York, (1986). 9. M.V.P. Rao, P. R. Naidu. Excess volumes of binary mixtures of alcohols in methyl-cyclohexane. Can. J. Chem. 52, 788 - 790, (1974). 10. J. Timmerman. Physicochemical constants of pure organic compounds, vol.1.Elsevier, Amsterdam, (1950). 11. Harry Watts, E. C. W. Clarke, D. N. Glew, New calorimeter for measurement of the enthalpy of mixing of liquid. the enthalpy of mixing of benzene with carbon tetrachloride and n- hexane with cyclohexan., Canadian Journal of Chemistry, 46, 6), 815 – 821, (1968). 12. S. Viswanathan, M. Anand Rao, Y. V. L. Ravi Kumar, D. H. L. Prasad, Excess enthalpies of binary mixtures of methyl tert-butyl ether (MTBE) with benzene, chlorobenzene, benzonitrile and nitrobenzene at 298.15 K., Thermochimica Acta, 335, 69 – 72, (1999). 13. P. Venkatesu, M. V. Prabhakara Rao, D. H. L. Prasad, Y. V. L. ravi Kumar., Excess molar enthalpies of N, N-dimethyl formamide with ketones at 298.15 K. Thermochimica Acta, 342, 73 – 78, (1999).