This document evaluates the accuracy of mathematical heat transfer equations for finned double pipe heat exchangers using CFD techniques, highlighting the differences in results between these methods. The analysis indicates that while mathematical models are useful for initial assessments, they may underestimate actual physical conditions, particularly exhaust gas temperatures, leading to potential energy recovery opportunities. The study emphasizes the importance of CFD modeling for accurate predictions and identifies best practices for conducting such analyses.
![Advanced Energy: An International Journal (AEIJ), Vol. 2, No. 1, January 2015
2
double pipe heat exchanger. Such a system can easily be fitted as part of an engine exhaust pipe
system. The examples discussed in this paper, consider the process of heat energy transfer from
the exhaust flue gas to water. This paper focuses on evaluating numerical techniques used to
calculate heat transfer effectiveness. Providing designers and manufacturers, an insight on the
expected level of accuracy when using mathematical equations associated with a double pipe heat
exchanger.
CFD software was used to evaluate the model. Results were tabulated and compared with
mathematically driven results. The analysis showed the difference between the results generated
by the two different methods. Discussions on possible causes of differences were included
supported by graphical CFD images. Best practices in CFD analysis were discussed with the
support of similar recently carried out CFD work.
The CFD analysis highlighted the following facts; Mathematical equations are good for an initial
analysis, but will require CFD or experimental modeling to obtain more accurate results on heat
transfer, the mathematically generated results showed an underestimated temperature output for
the exhaust flue gas. This analysis has shown the possibility of further energy recovery from the
higher flue gas outlet temperature which would otherwise be wasted heat energy.
This document describes, and is written to conform to, author guidelines for the journals of
AIRCC series. It is prepared in Microsoft Word as a .doc document. Although other means of
preparation are acceptable, final, camera-ready versions must conform to this layout. Microsoft
Word terminology is used where appropriate in this document. Although formatting instructions
may often appear daunting, the simplest approach is to use this template and insert headings and
text into it as appropriate.
2. MATHEMATICAL MODEL FOR DOUBLE PIPE HEAT
EXCHANGERS
Equations for calculating heat exchanger effectiveness are covered in details in ASHRAE
Fundamentals (2009) [1], representing various types of heat exchangers.
Reference is made to Appendix 1 for a sample calculations with the conditions involved. Counter
flow conditions were assumed in the two techniques; mathematical and CFD models. In certain
cases and usually at the end of such equations, a check is required for a possible further iteration.
Refer to Appendix 1 for such an example.
The example in Appendix 1 refers to heat transfer across a pipe surface area towards water
flowing in the inner pipe. Tables 1 to 3 indicate results computed using the equations shown in
Appendix 1. The second column from left of table shows the first attempt of calculations.](https://image.slidesharecdn.com/08aeijpaper-230208082942-83bf44c9/75/EVALUATING-MATHEMATICAL-HEAT-TRANSFER-EFFECTIVENESS-EQUATIONS-USING-CFD-TECHNIQUES-FOR-A-FINNED-DOUBLE-PIPE-HEAT-EXCHANGER-2-2048.jpg)
![Advanced Energy: An International Journal (AEIJ), Vol. 2, No. 1, January 2015
3
Table 1.Double Pipe Heat Exchanger with 16 fins.
Item Description
CFD
method
Mathematical
method
Temperature
difference (%)
between
mathematical and
CFD methods (*)
After iterations (**)
1 Heat transfer
effectiveness
- 0.984714 -
2 Temperature of
water – out °C
(°F)
42.00
(116)
47.39 (126.8) 13 % -
3 Temperature of
exhaust – out
°C (°F)
64.03
(160.1)
42.44 (116.9) 51 % -
Fin thickness 1 mm (0.04 inch). Fluids temperatures at entry point; water 40 C (104
F), flue gas 200 C (392 F).Flue gas mass flow rate 0.12 kg/s (0.264 lb/s).
(*) Results without iterations carried out on the mathematically generated results. (**)
Results after iterations using mathematical methods showing temperature and percentage
difference between the CFD and mathematically generated temperatures.
Table 2. Double Pipe Heat Exchanger with 15 fins.
Item Description
CFD
method
Mathematical
method
Difference (%)
between mathematical
and CFD methods (*)
After iterations (**) –
temperature /
[difference %]
1 Heat transfer
effectiveness
- 0.887249 0.884507
2 Temperature of
water – out °C
(°F)
46.05
(124.1)
66.13 (164.3) 43.6 % 66.33 (164.66) / [6.4
%)]
3 Temperature of
exhaust – out
°C (°F)
83.31
(198.6)
74.95 (181.9) 11 % 75.80 (183.6) / [86
%]
Fin thickness 1 mm. Fluids temperatures at entry point; water 40 C (104 F), flue gas 350
C (662 F). Flue gas mass flow rate 0.243 kg/s (0.535 lb/s).
(*) Results without iterations carried out on the mathematically generated results. (**) Results
after iterations using mathematical methods showing temperature and percentage difference
between the CFD and mathematically generated temperatures.](https://image.slidesharecdn.com/08aeijpaper-230208082942-83bf44c9/75/EVALUATING-MATHEMATICAL-HEAT-TRANSFER-EFFECTIVENESS-EQUATIONS-USING-CFD-TECHNIQUES-FOR-A-FINNED-DOUBLE-PIPE-HEAT-EXCHANGER-3-2048.jpg)
![Advanced Energy: An International Journal (AEIJ), Vol. 2, No. 1, January 2015
4
Table 3. Double Pipe Heat Exchanger with 13 fins.
Ite
m
Description
CFD
method
Mathematical
method
Difference (%)
between
mathematical and
CFD methods (*)
After iterations (**) –
temperature /
[difference %]
1 Heat transfer
effectiveness
- 0.887249 0.882163
2 Temperature of
water – out °C
(°F)
46.36
(124.72)
66.06 (164.12) 42.5 % 66.26 (164.52) / [13.4
%]
3 Temperature of
exhaust – out
C (°F)
81.03
(194.06)
75.67 (183.34) 7.1 % 76.52 (185.04) / [90
%]
Fin thickness 1 mm. Fluids temperatures at entry point; water 40 C (104 F), flue gas 350
C (662 F). Flue gas mass flow rate 0.243 kg/s.
(*) Results without iterations carried out on the mathematically generated results. (**) Results
after iterations using mathematical methods showing temperature and percentage difference
between the CFD and mathematically generated temperatures.
Figure 1. 16 fin cross sectional view, from ASHRAE Fundamentals Handbook (2009) [1].
t = fin thickness
L = fin length (radial)
40 mm = 1.6 inch
40
mm
t , L](https://image.slidesharecdn.com/08aeijpaper-230208082942-83bf44c9/75/EVALUATING-MATHEMATICAL-HEAT-TRANSFER-EFFECTIVENESS-EQUATIONS-USING-CFD-TECHNIQUES-FOR-A-FINNED-DOUBLE-PIPE-HEAT-EXCHANGER-4-2048.jpg)
![Advanced Energy: An International Journal (AEIJ), Vol. 2, No. 1, January 2015
6
ASHRAE Fundamentals Chapter 4 (2009) [2], section on heat exchangers documents the
development and experimental work associated with heat exchangers, including complex
geometrical shapes. The
Reference is made to tables 1 to 3. Second from left column results were based on initial
assumption of specific heat capacity of 1018 J/(kg.K) (0.2431 Btu/lb.F) at 175 °C (347 °F).
First column from right in tables 1 to 3, the specific heat capacity found in standard
thermodynamic tables to be 1029 J/(kg.K) (0.2457 Btu/lb.F) at 212 °C (413.6 °F). Therefore
iterations were carried out by entering in the mathematical equation 1029 J/(kg.K) (0.2457
Btu/lb.F). Results are as shown in tables 1 to 3.
Equations used in Appendix cater for conditions where temperatures of fluids leaving the heat
exchanger are unknown. To avoid trial-and-error calculations, the NTU- ε method uses three
dimensionless parameters: effectiveness ε, number of transfer units (NTU), and capacity rate ratio
cr. Also, the equations used do not consider the inner pipe wall thickness, but just surface area,
unlike CFD analysis carried below.
Fay C McQuiston (2000) [4] notes that, precise values are difficult to predict, and experience
along with experimental data is often relied on.
In practice, improving heat transfer between two fluids in a heat exchanger usually depends on;
construction materials, velocity of fluids, and size of heat exchanger (heat exchange surfaces).
According to Fay C McQuiston (2000) [4], the trade-off between first cost (primarily size) and
operating cost (primarily due to pressure drop) is a major consideration in heat exchanger analysis
and selection.
3. CFD ANALYSIS
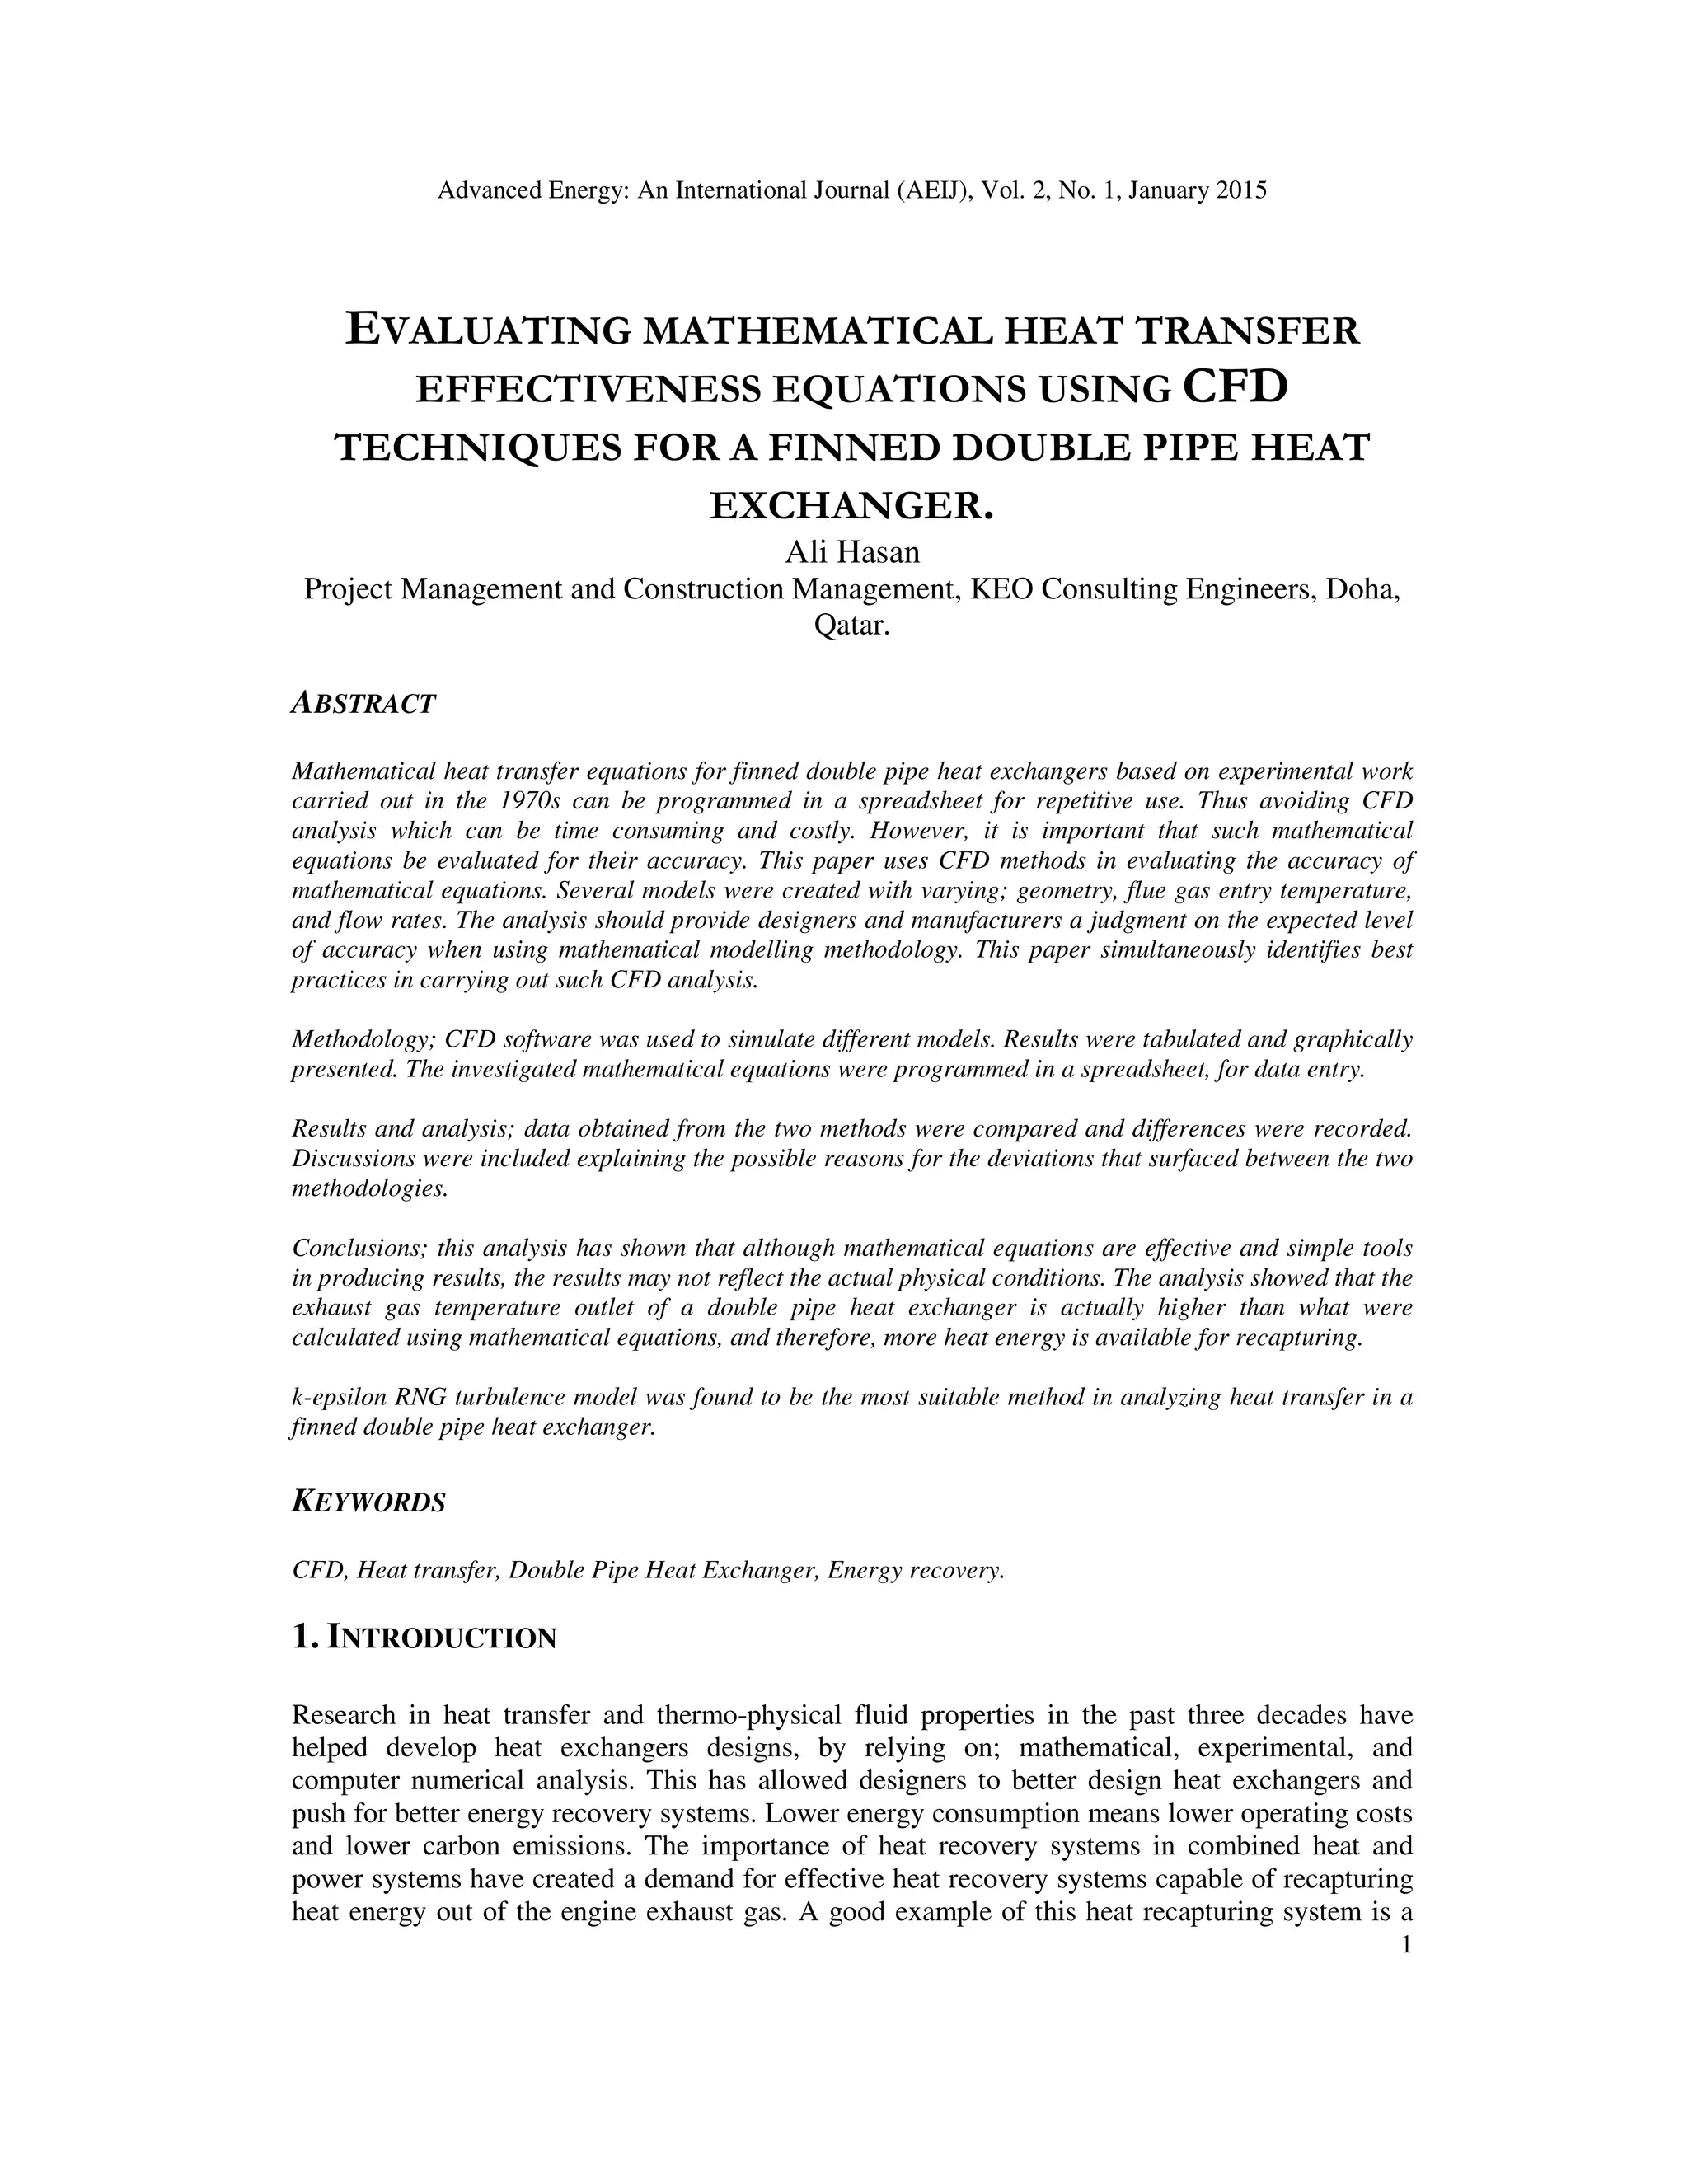
Models were developed for a cross sectional segment. AutoCAD 2013 was used for modeling,
and exported to ANSYS Fluent version 13, using IGES files. The AutoCAD file drawing in 2D
first and then extruded into a 5000 mm (200 inch) length segment creating a 3D model. Walls,
boundary conditions were defined, materials, and fluids data were entered. Analysis was run, and
data was produces as shown in Figures 3 to 10. Fluids temperature properties were entered in
tables 1 to 3 for comparison with the mathematically derived results.
Unlike the equations referred to in section 1, CFD modeling considers the inner pipe wall
thickness, the material responsible for transferring heat energy from flue gas to the water body,
and the fluid boundary conditions. Thus, CFD tools provide an effective heat transfer simulation
between the fluid body and the solid body.](https://image.slidesharecdn.com/08aeijpaper-230208082942-83bf44c9/75/EVALUATING-MATHEMATICAL-HEAT-TRANSFER-EFFECTIVENESS-EQUATIONS-USING-CFD-TECHNIQUES-FOR-A-FINNED-DOUBLE-PIPE-HEAT-EXCHANGER-6-2048.jpg)
![Advanced Energy: An International Journal (AEIJ), Vol. 2, No. 1, January 2015
12
Fay C McQuiston (2000) [4] states, that manual design or simulation of a heat exchanger is an
arduous task and seldom done. Computer programs are available to simulate or select heat
exchangers for various applications.
Assumptions made:
- Flue gas as an ideal gas.
Note: According to E Rathakrishnan (2004) [3], many of the familiar gases such as air,
nitrogen, oxygen, hydrogen, helium, argon, neon, krypton, and even heavier gases such as
carbon dioxide can be treated as ideal gas with negligible error, often less than 1%.
Therefor, air, or gas where referred to in this paper, was assumed as an ideal gas in this
CFD analysis.
- Materials, flue gas, copper fins and pipe wall, and water, as per the software standard
database.
- K- Epsilon RNG, a common turbulence model selected from the software database. Wall
roughness factor constant, 0.5. Refer to Appendix 2 for specific settings. Settings not
specified in this paper were kept a software default settings.
- Inflated layers created along the fluid boundary layers in contact with the tube wall, and
fin surfaces. This will improve boundary conditions simulations.
4. RESULTS AND ANALYSIS
4.1 Results and Analysis discussed separately.
a. Results
Results obtained using the mathematical modelling and the CFD analysis were tabulated as
shown in tables 1 to 3.The results cover three different scenarios addressing different flow rates,
temperatures, fin thickness, and flue gas entering temperatures. The object is to investigate how
the mathematical equations perform under different conditions.
b. Analysis
Impact of fin thickness.
Tables 1 to 3 show that higher heat transfer effectiveness can be achieved with the thinner 1mm
thick 16 fins, when compared to the thicker but lower number of fins.
Impact of flue gas entry temperature.
A high entry flue gas temperature of 350 ºC (732 ºF) produced higher water exiting temperatures,
but lower effectiveness value. In accordance with mathematical and CFD derived exiting
temperatures.
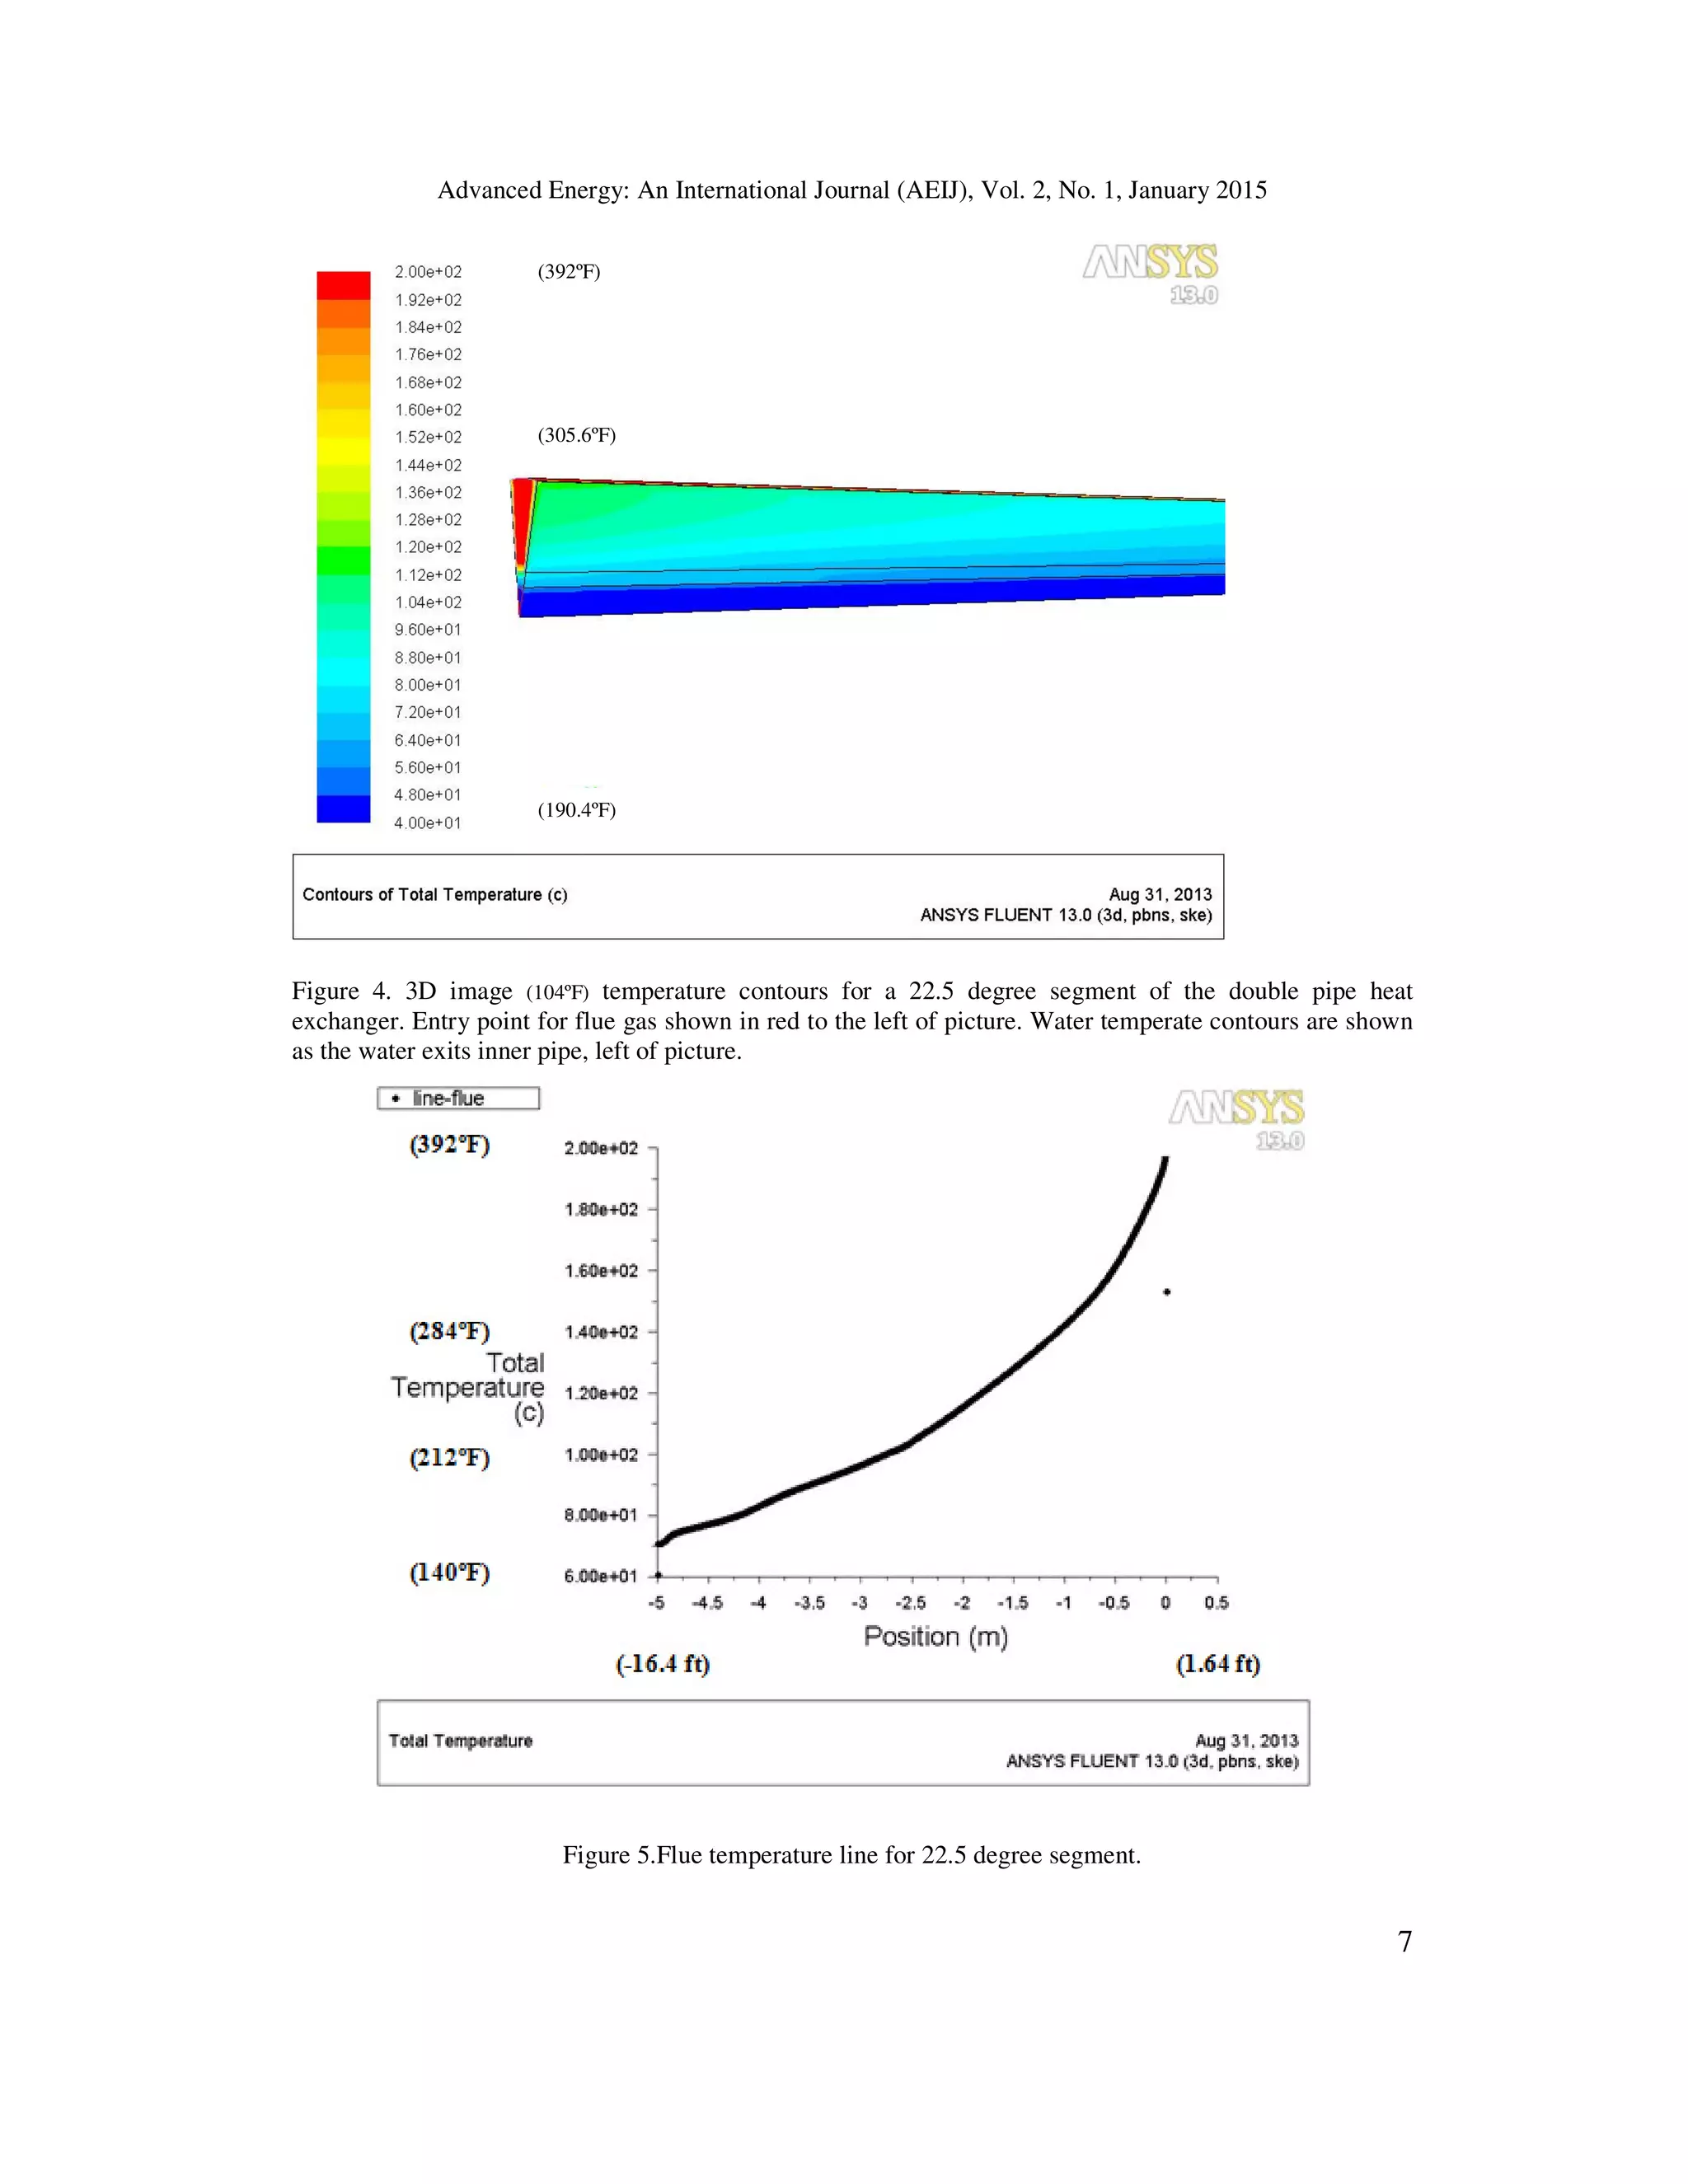
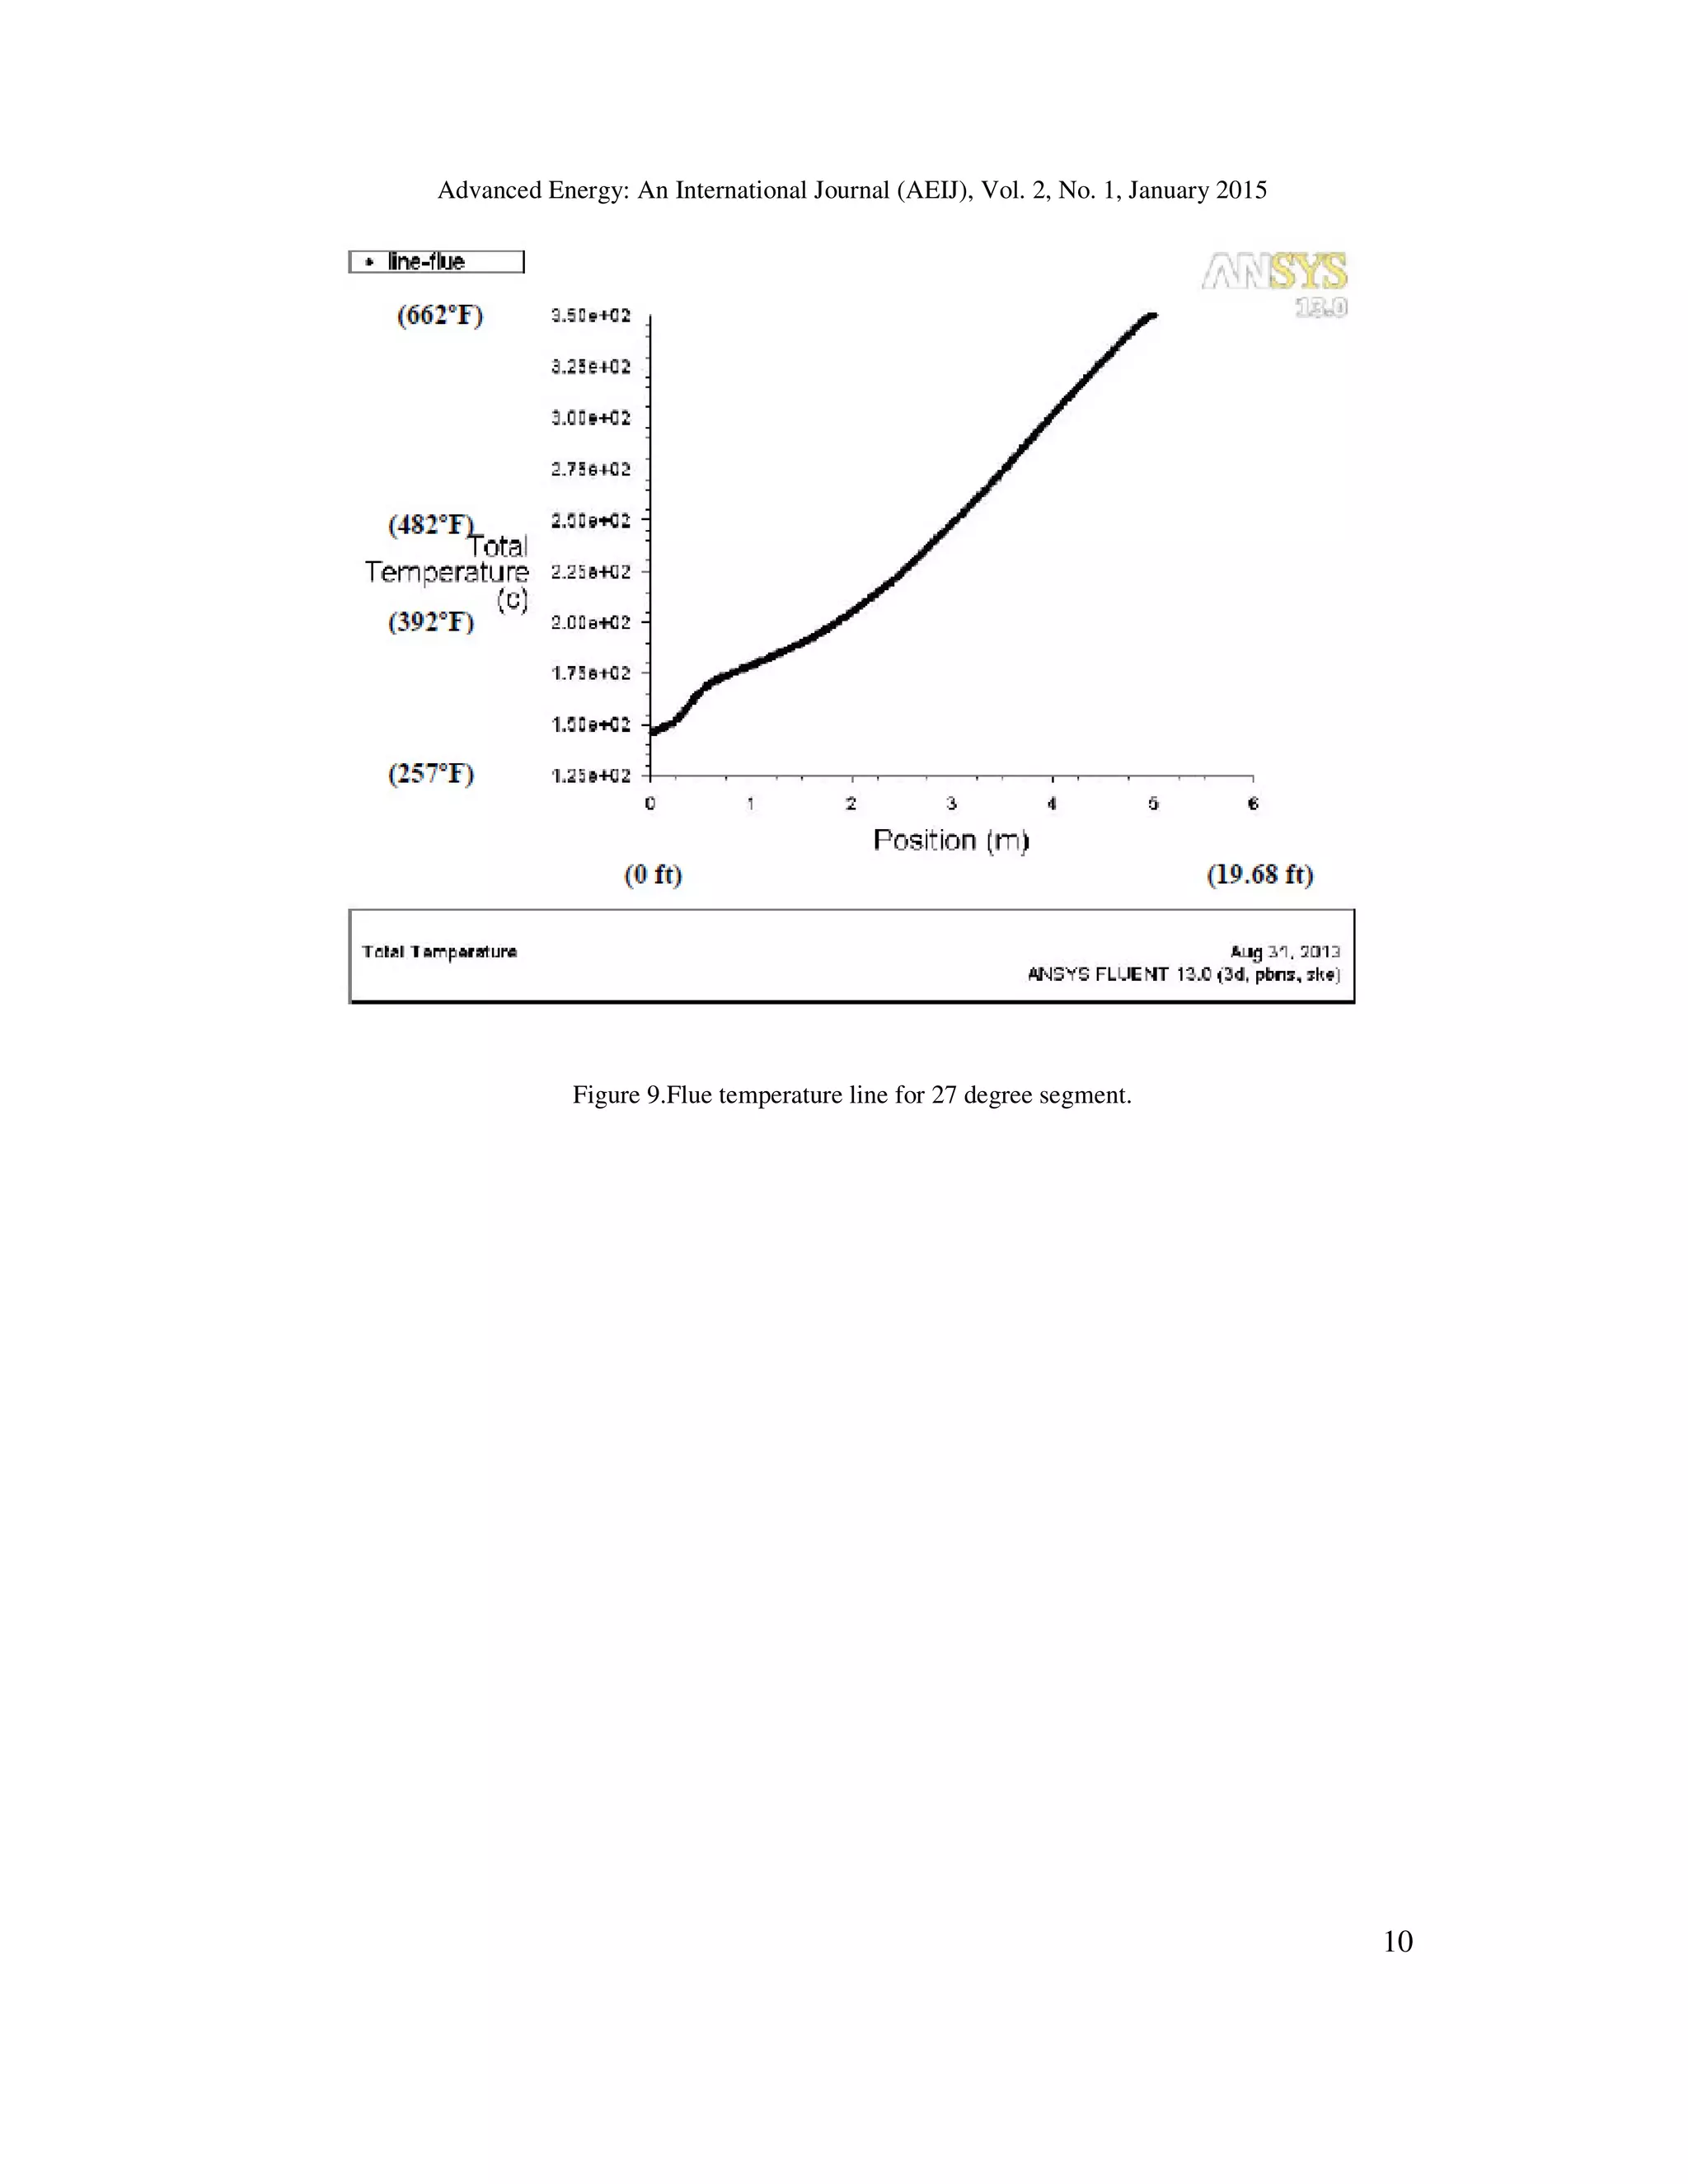
CFD - flue gas temperature line graphs.
Flue gas line graphs showed a positive slope with curvature (nonlinear) in relation to increasing
temperature. Refer to graph Figs 5+.
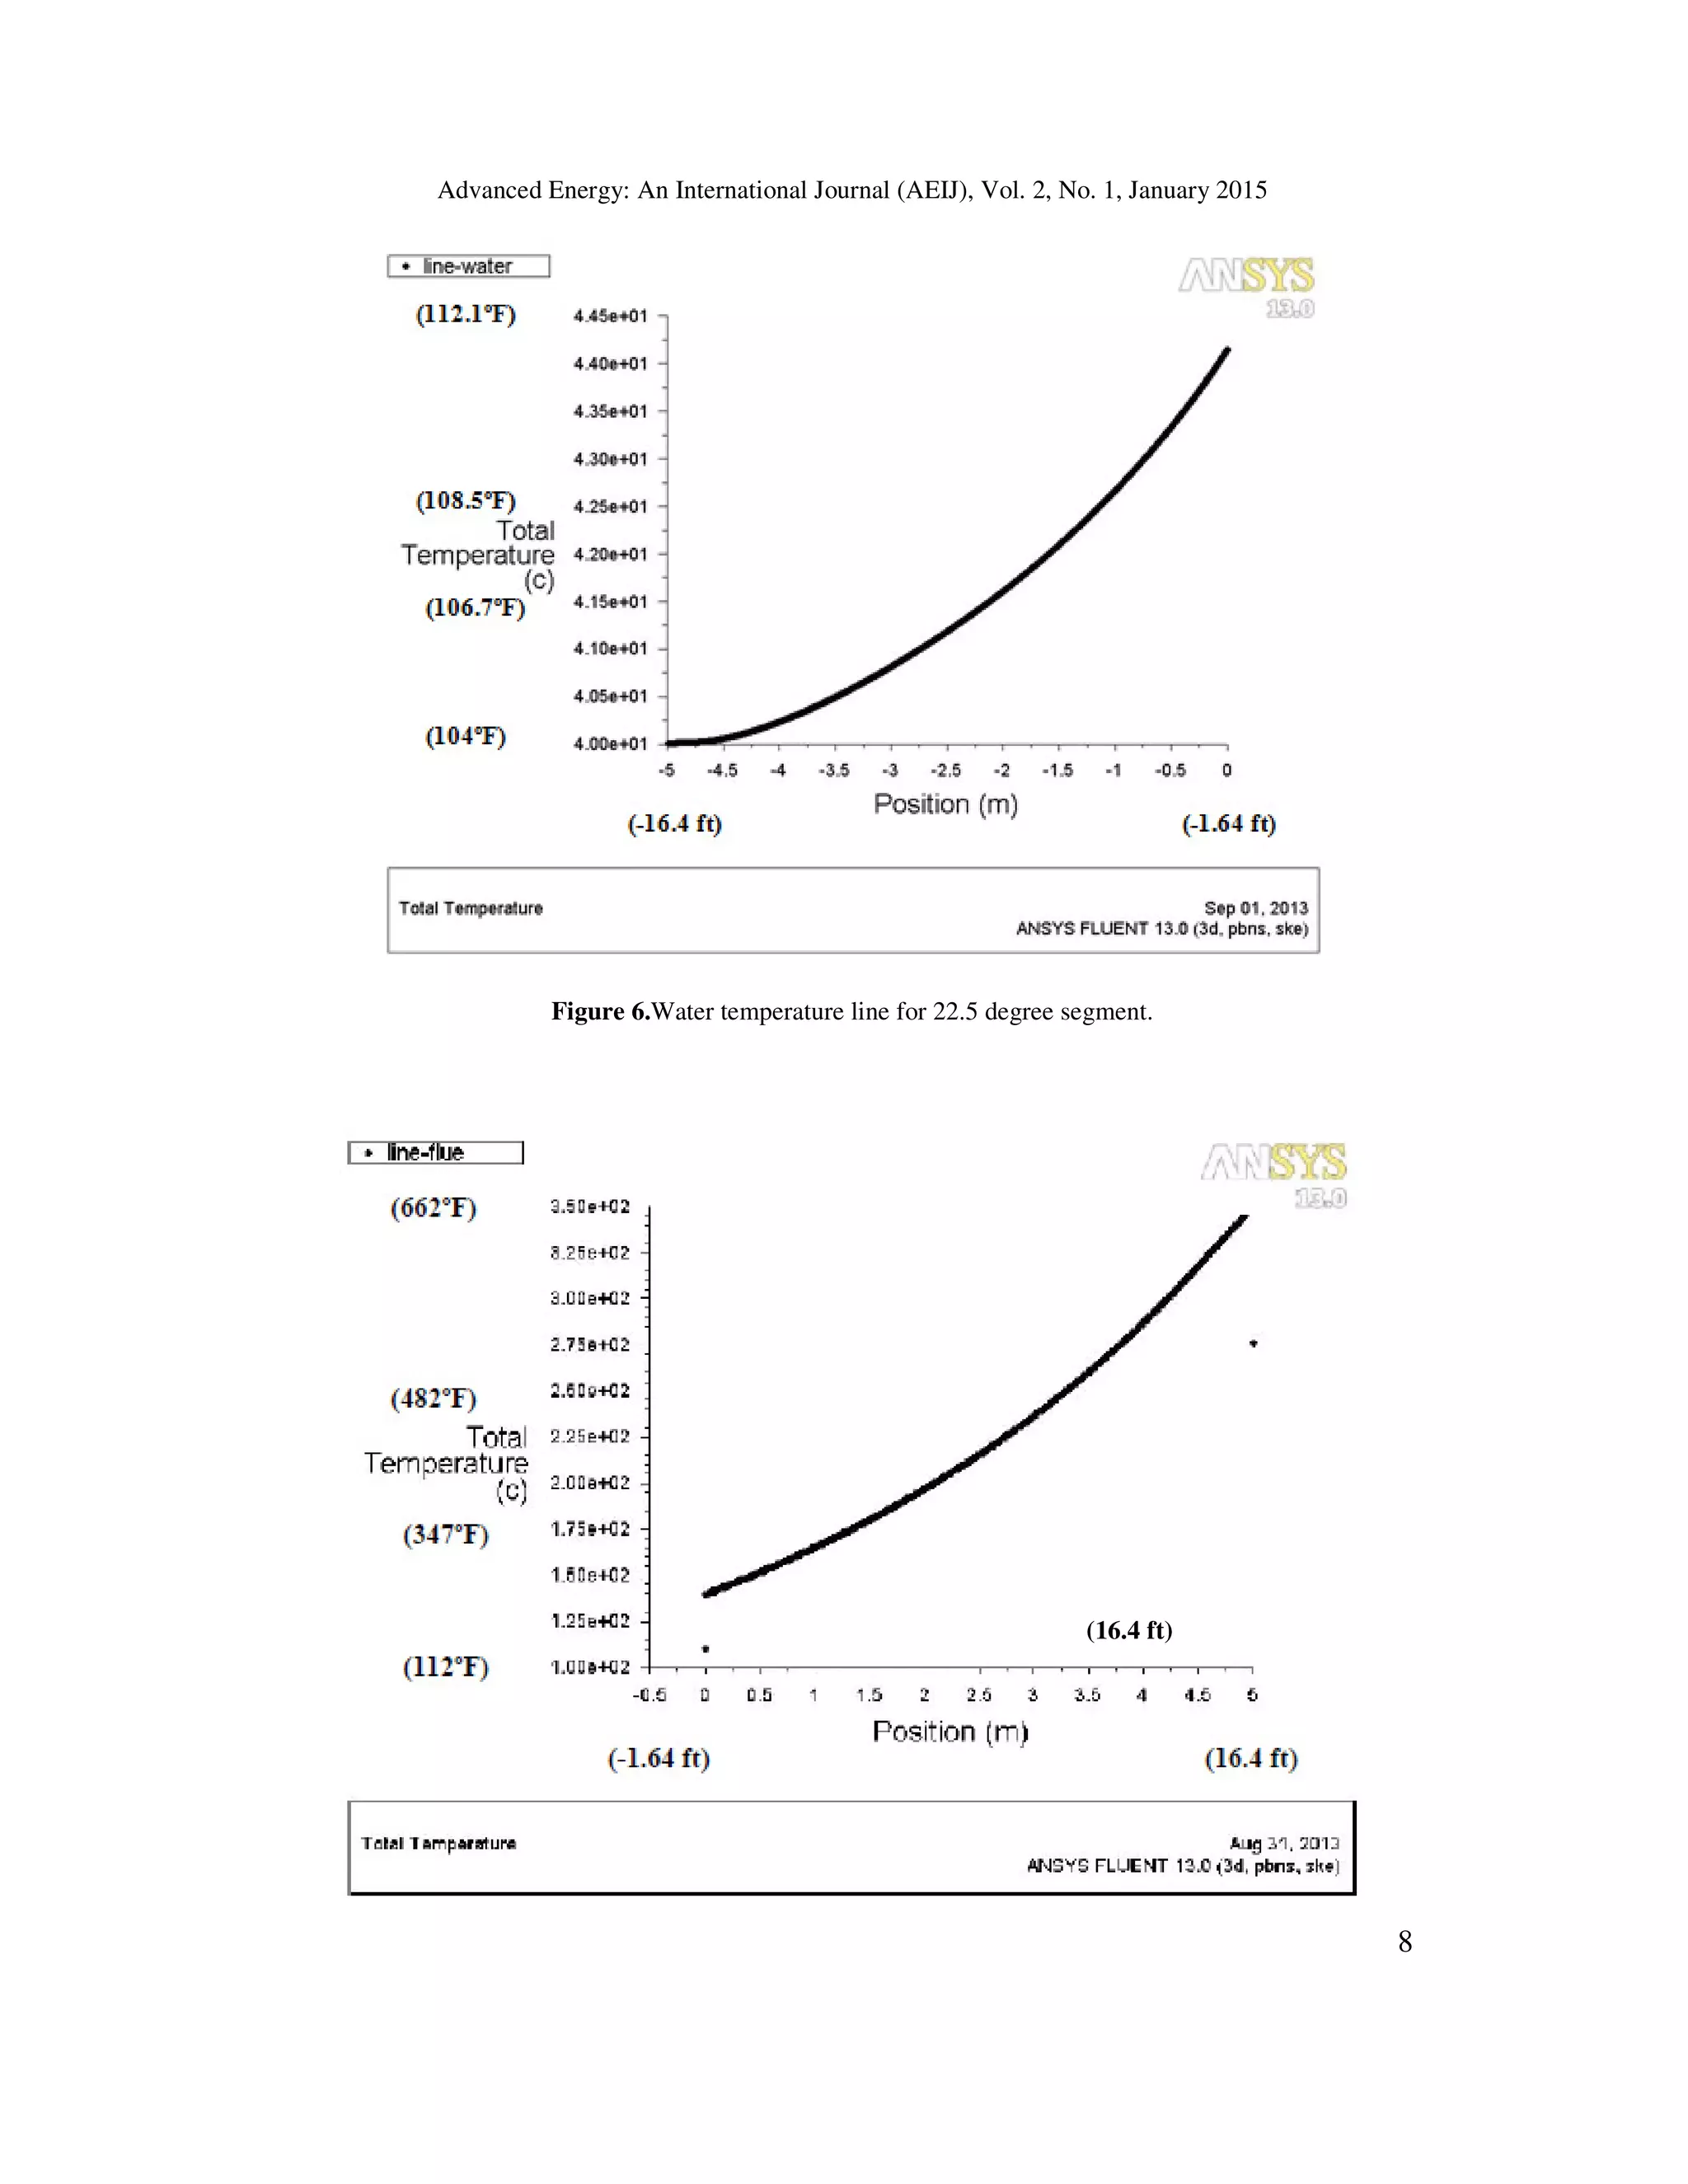
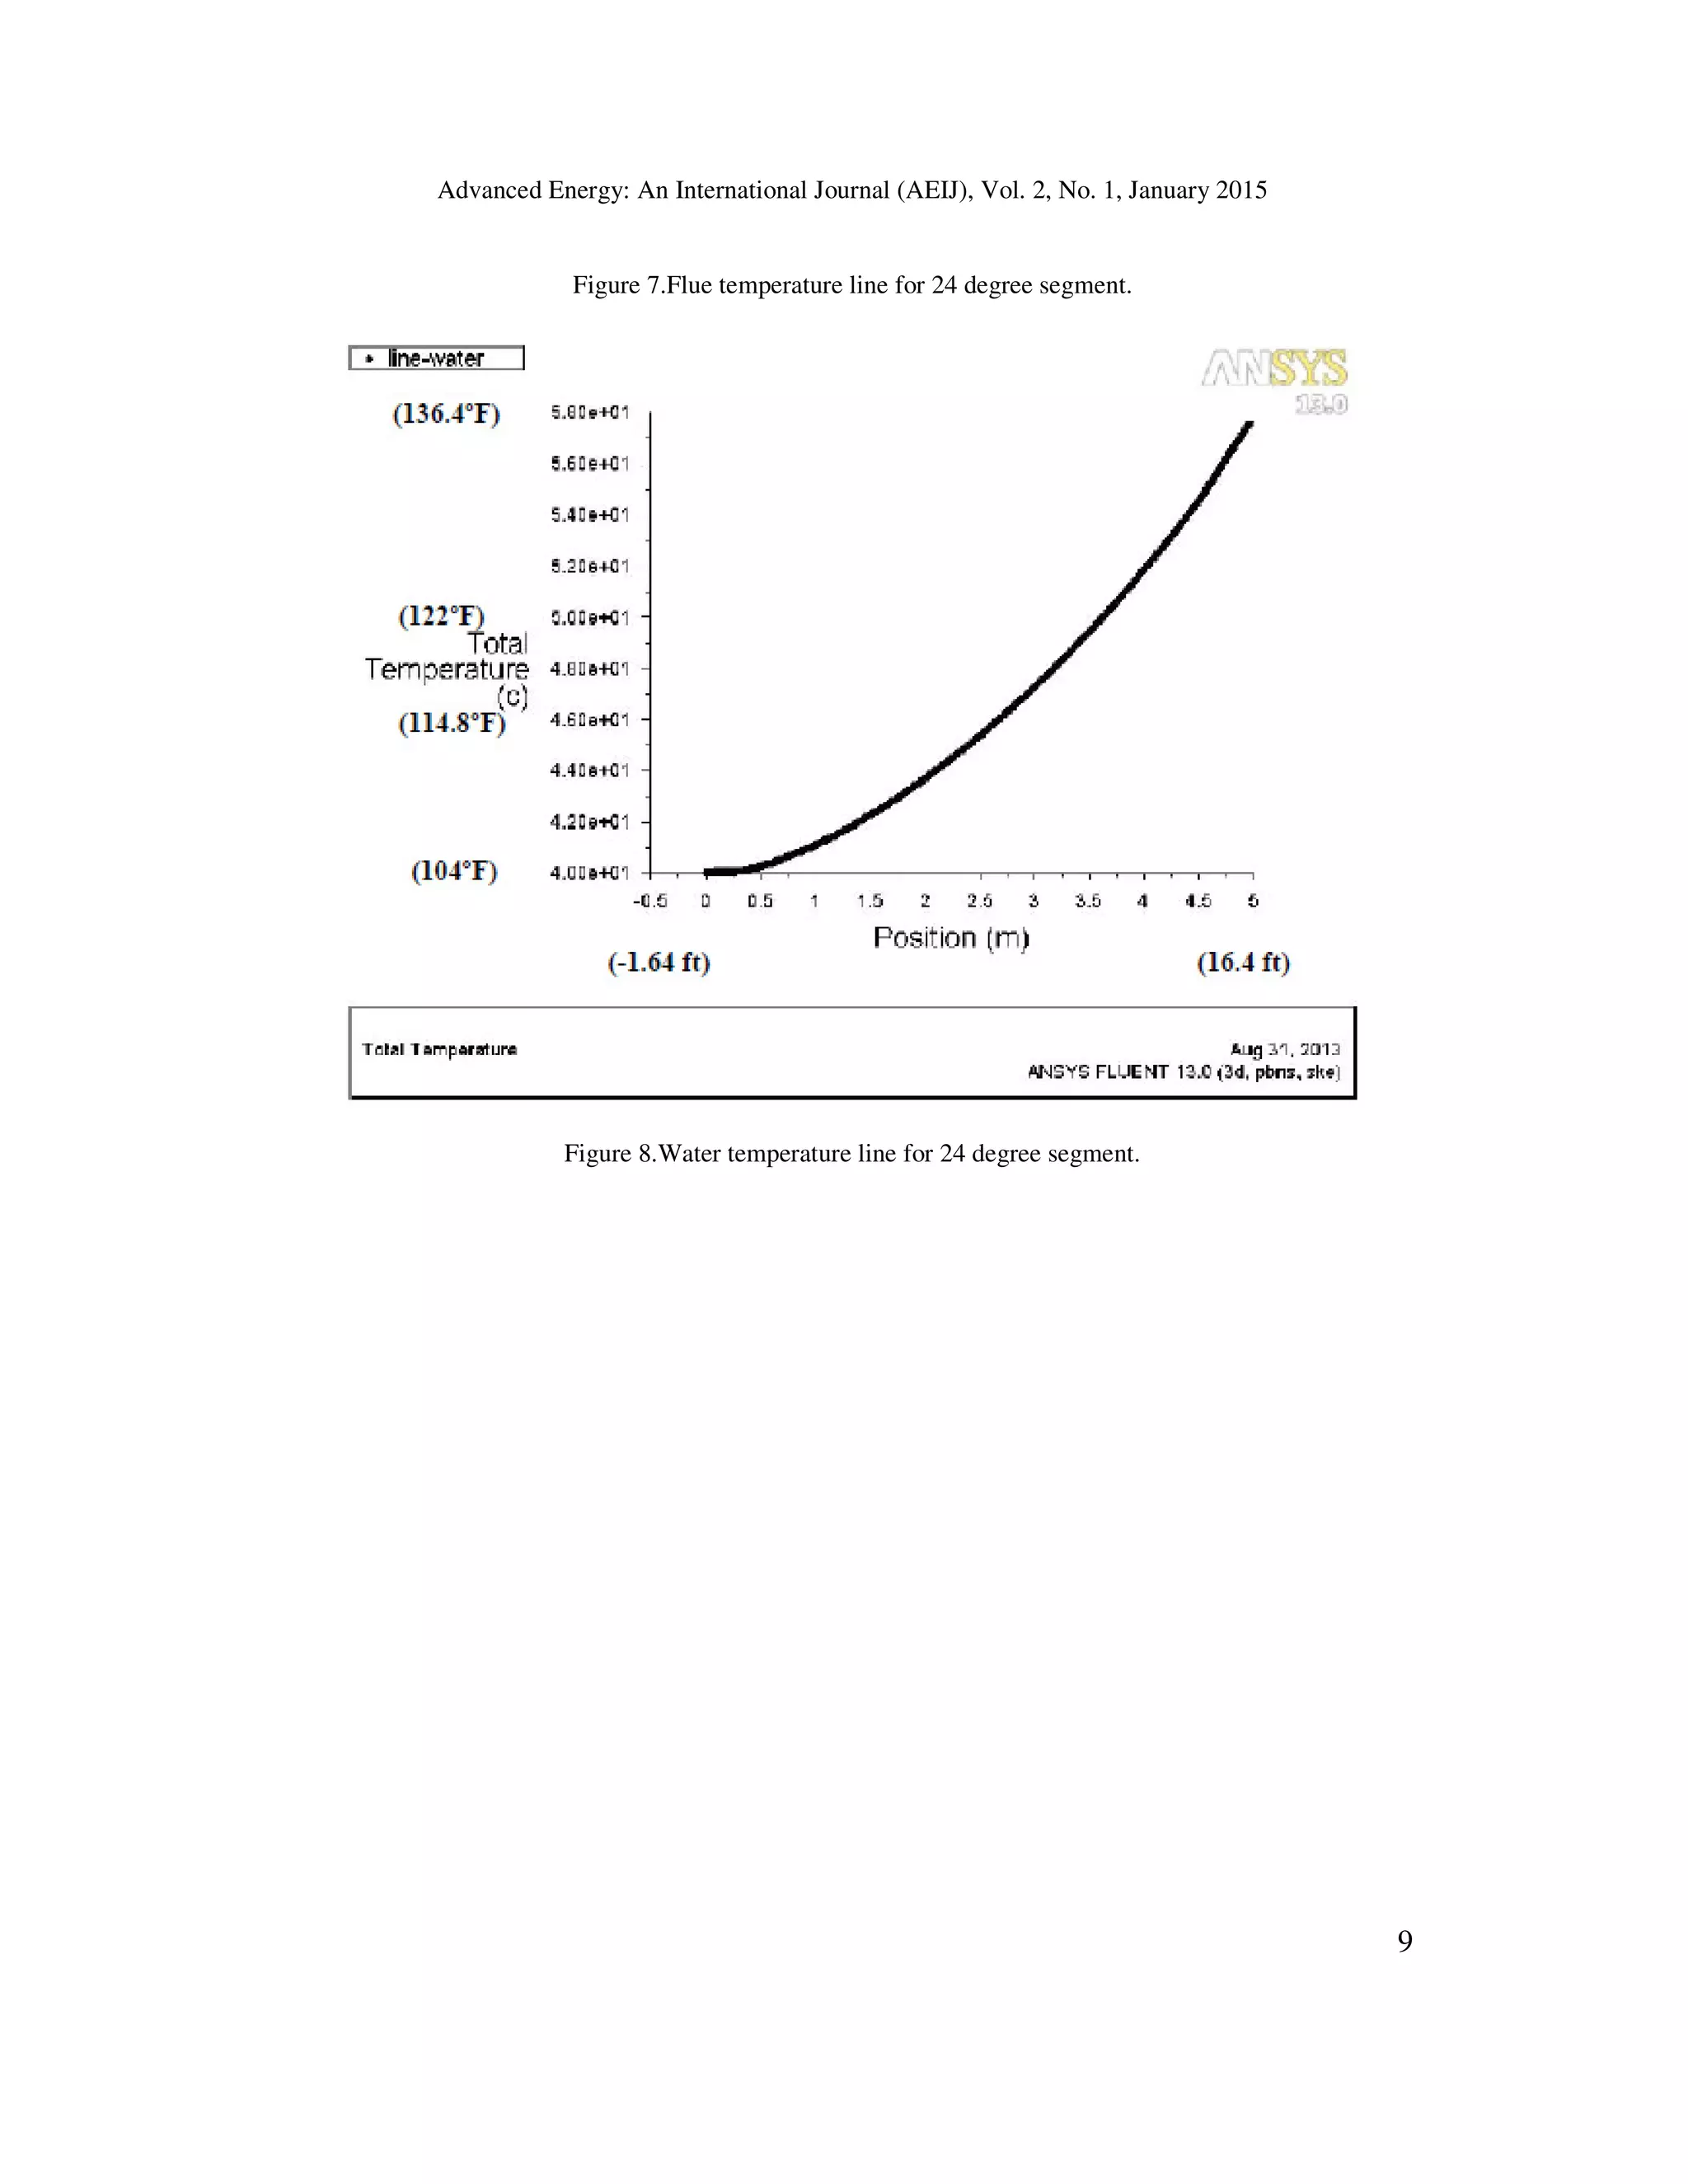
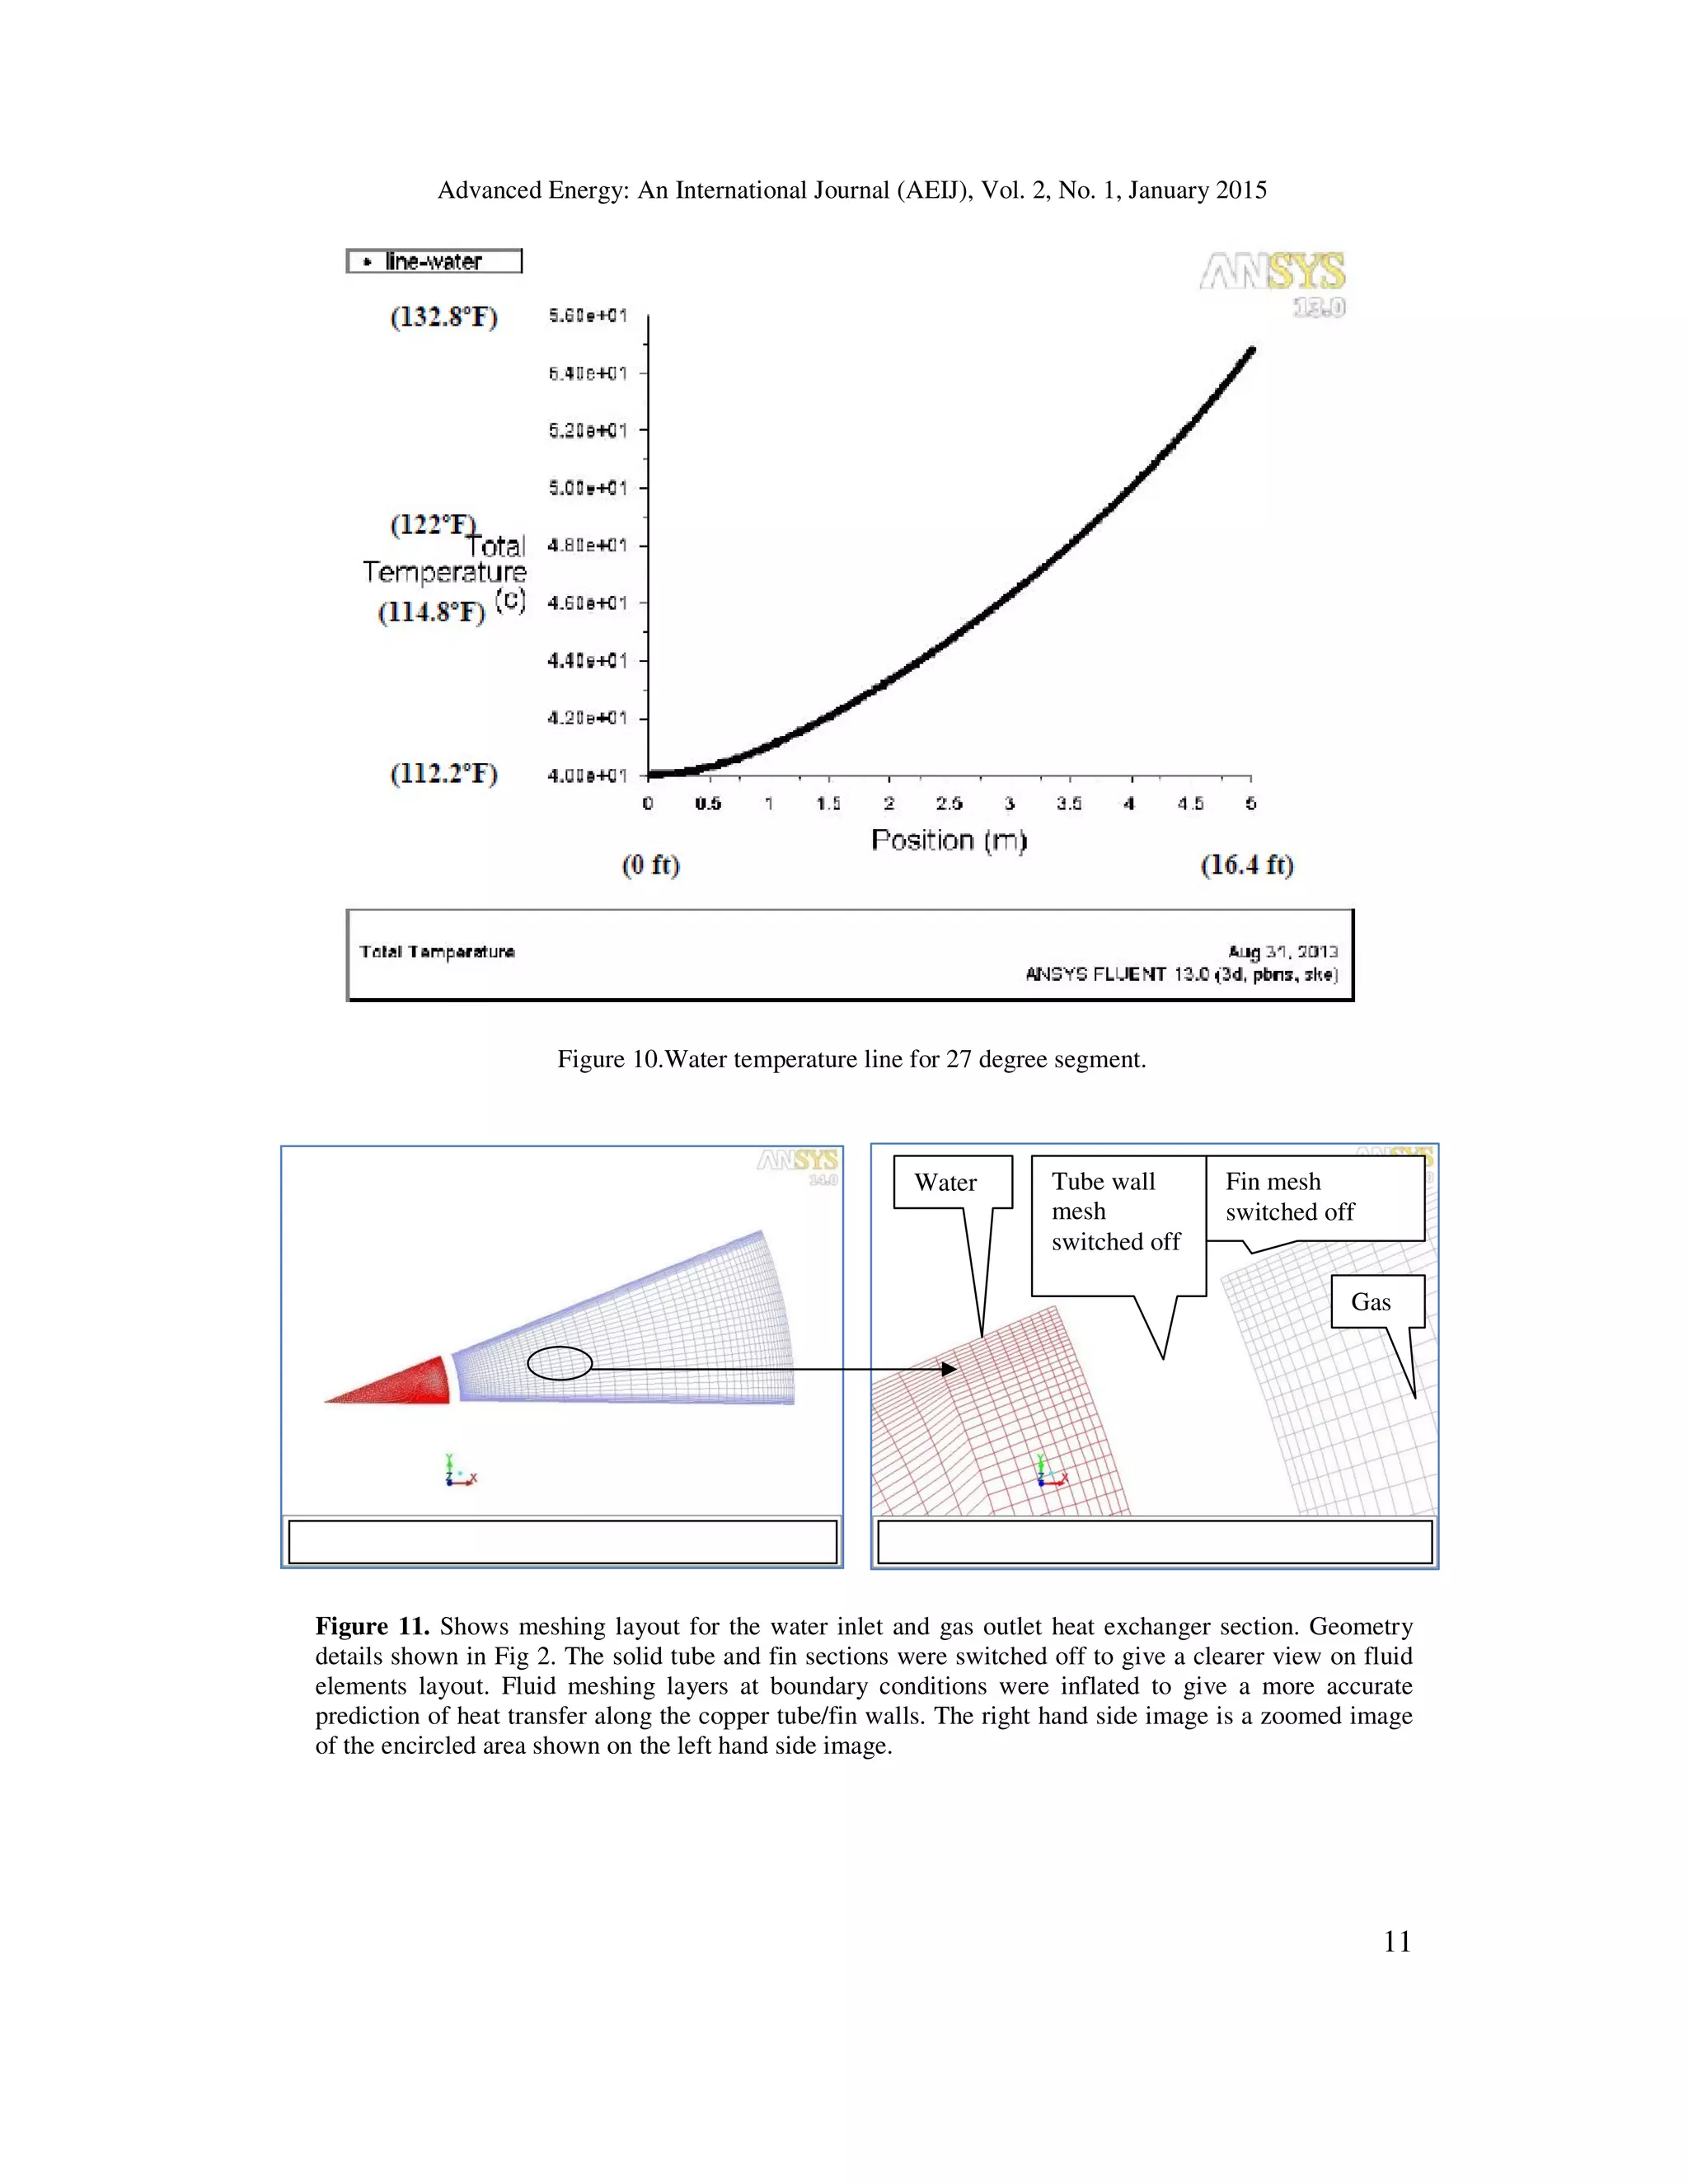
CFD - water temperature line graphs.](https://image.slidesharecdn.com/08aeijpaper-230208082942-83bf44c9/75/EVALUATING-MATHEMATICAL-HEAT-TRANSFER-EFFECTIVENESS-EQUATIONS-USING-CFD-TECHNIQUES-FOR-A-FINNED-DOUBLE-PIPE-HEAT-EXCHANGER-12-2048.jpg)
![Advanced Energy: An International Journal (AEIJ), Vol. 2, No. 1, January 2015
13
Similar to the flue line graphs, positive slope as temperature increases. Percentage deviations
showed better accuracy or lower percentage deviations using thinner fins. Table 1 indicated a
deviation of 4.5% for a 1mm (0.04 inch) thick fin. Higher percentage deviations were observed
against mathematically generated figures for thicker fins, as shown in tables 2 3.
The reasons for the significant differences between the out temperatures calculated using the two
different methods, CFD and mathematical equations, are;
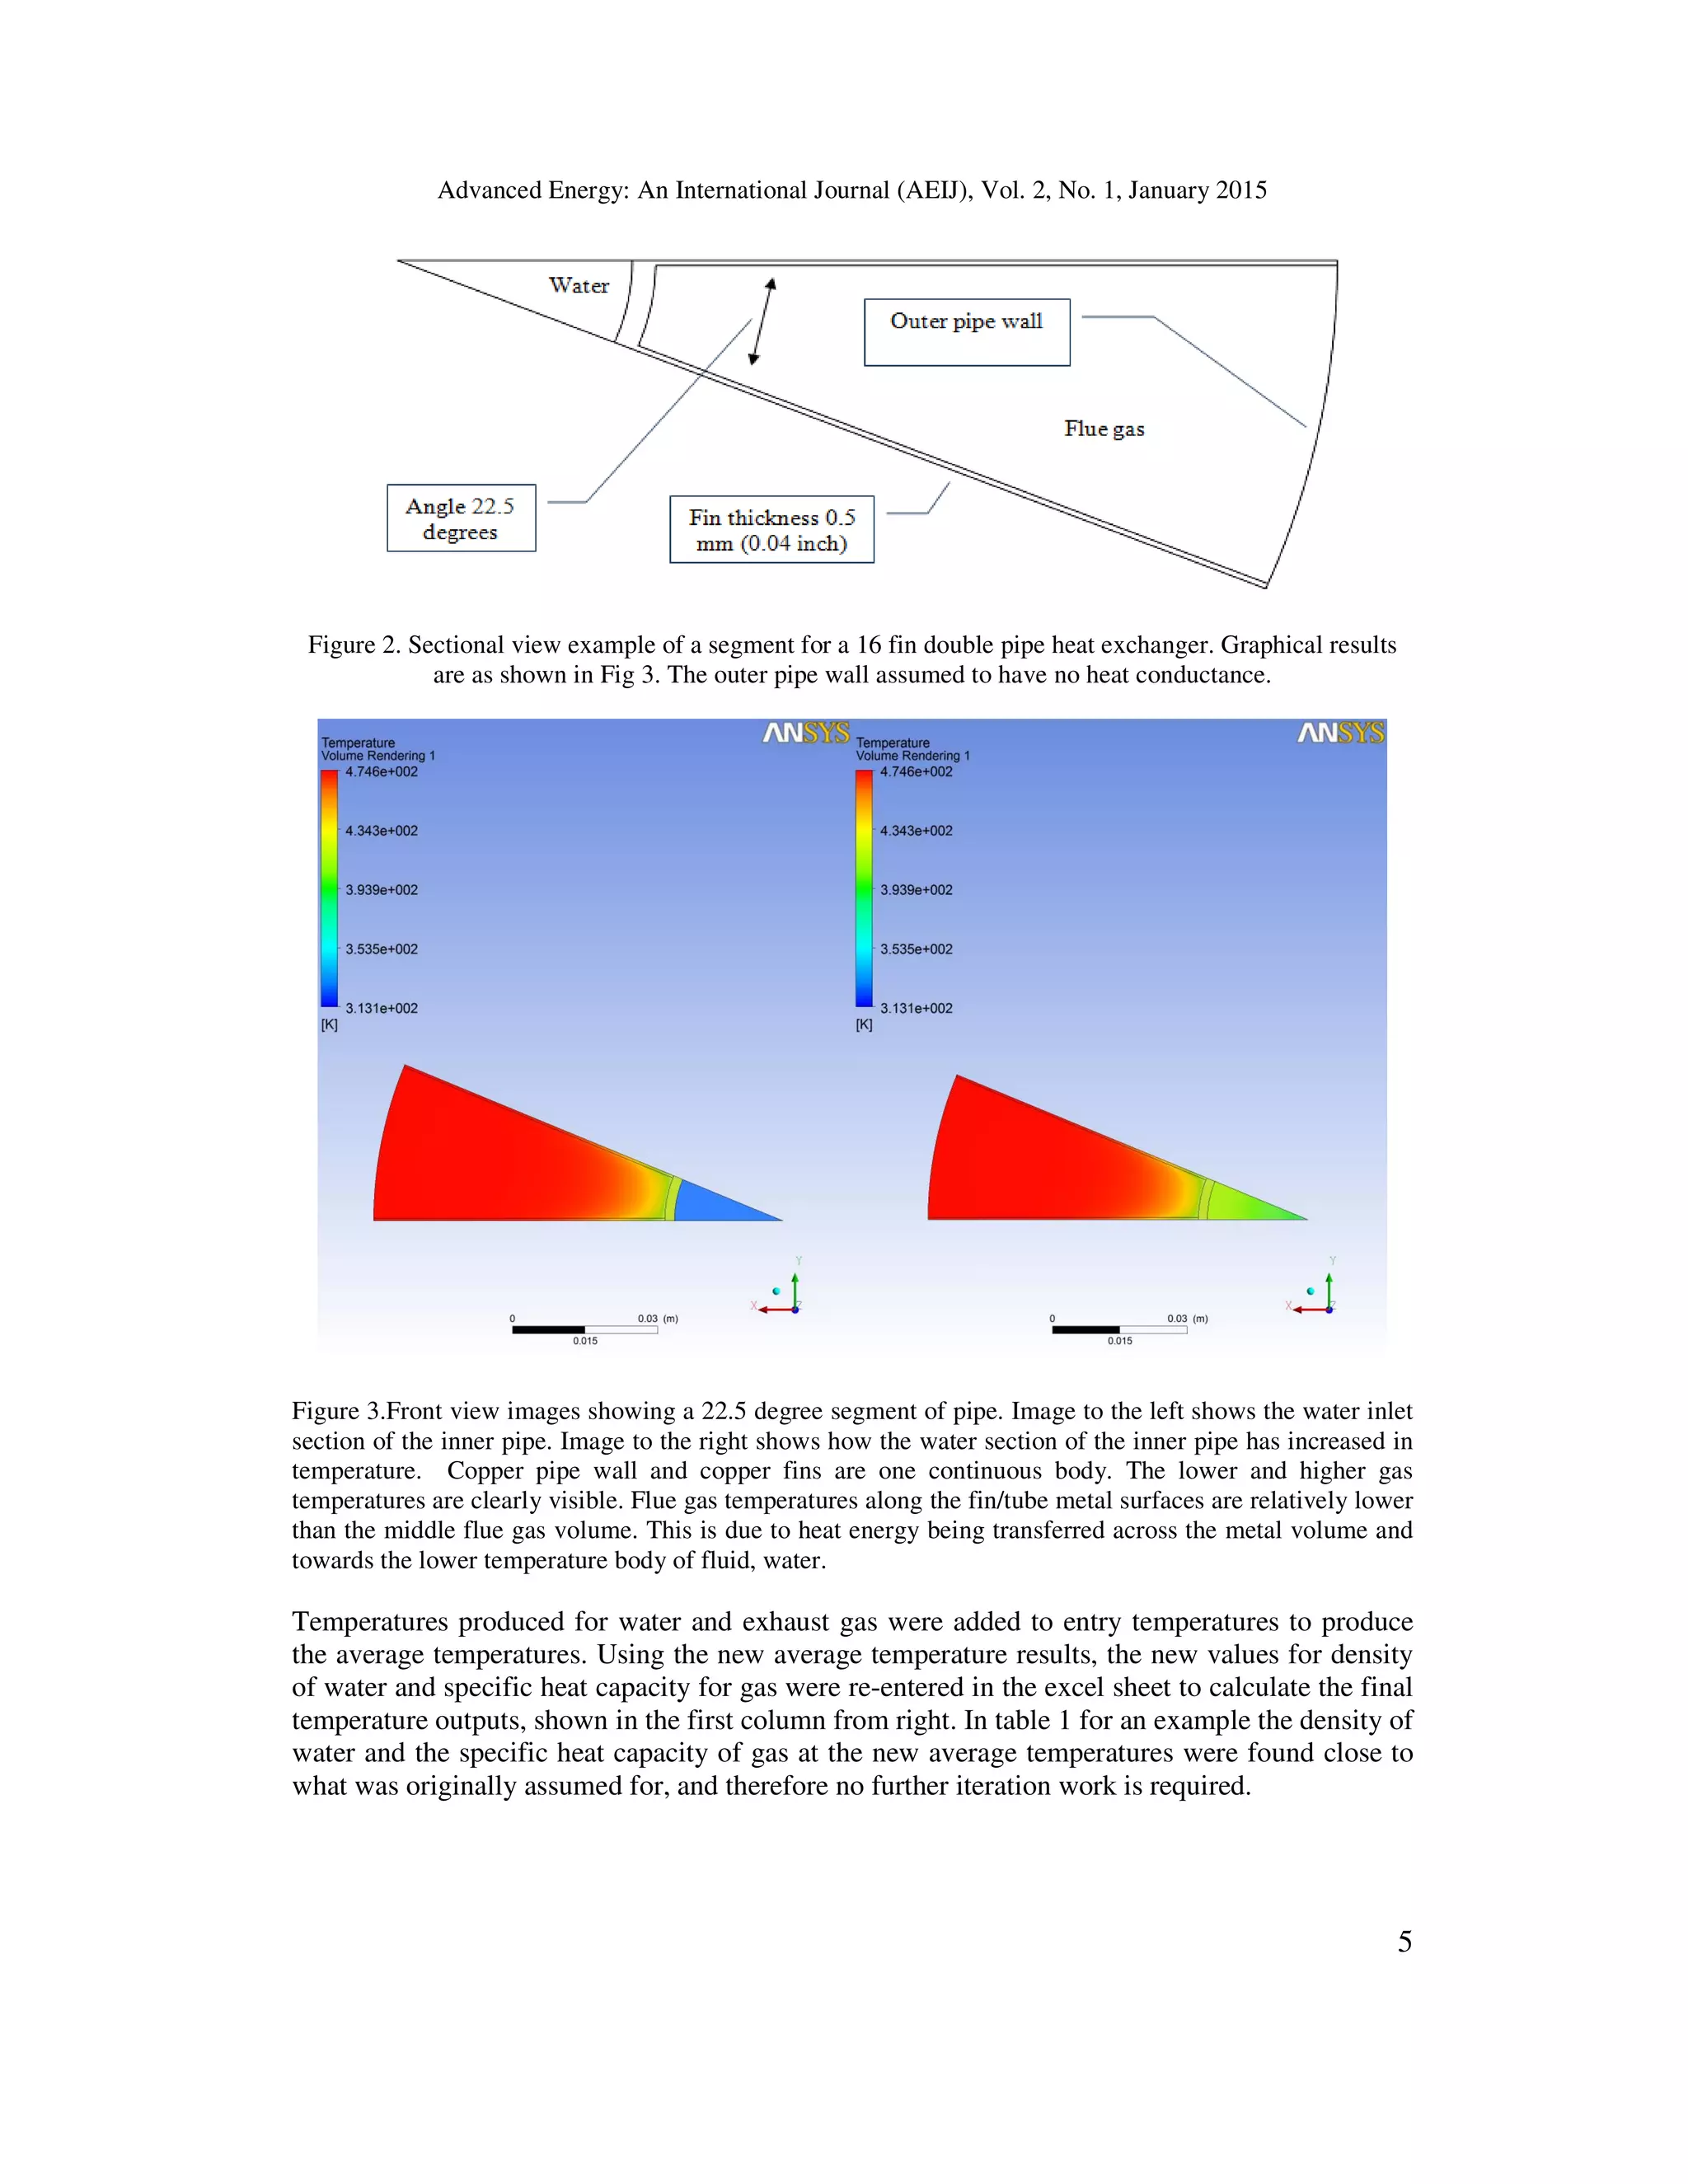
a. The mathematical equation does not take into consideration heat transfer at boundary
conditions. Heat transfer in the mathematical equations assumes that the transfer of
heat energy between the two fluid bodies is a uniform process, with both fluid
volume bodies having a uniform temperature across the body of fluid. In reality and
as demonstrated in Figs 3 and 4. The temperature in the flue gas varies from locations
along the fin surface and the pipe wall surface. The temperature in the middle of the
flue gas volume remains higher than along the pipe wall, and fin surfaces, where heat
energy is being conducted through the copper metal and passed towards the water
fluid body of relatively lower heat temperature.
b. The mathematical equations refer to pipe wall surface area, whereas in reality and in
this CFD model the pipe wall has a thickness.
c. Turbulences in the flue gas contribute to the mixing of the cooled gas boundary
layers, with the inner middle flue gas volume. The higher the fluid turbulences are the
better the heat transfer is between the two different fluid volumes.
d. K-epsilon RNG turbulence models was found to be the most suitable model. Other
models did not converge. This confirms the published work by M Hatami [5].
Stating that the RNG turbulence model converged easily during the processing stage,
whereas SST or Shear Stress Transport theory did not easily converge.
e. B.S. Massey1983 [6] describes flow near the boundary layer may be either laminar or
turbulent. Turbulent flow past a solid surface having a random movement of particles
perpendicular to the surface. Yet fluid particles cannot pass through an impermeable
solid surface, and so, as the surface is approached, these movements perpendicular to
it must die out. It follows then that turbulent flow cannot exist immediately in contact
with the solid boundary. Thus even when main flow possess considerable turbulence,
and even when the greater part of the boundary layer us also turbulent, there is still an
extremely thin layer, adjacent to the solid surface, in which the flow has negligible
fluctuations of velocity. This region, which may be less than a micrometer in
thickness, has frequently been called the laminar sub-layer, but the term viscous sub-
layer is now preferred. The viscous sub-layer plays a significant role in heat transfer
between a fluid body and a solid surface.
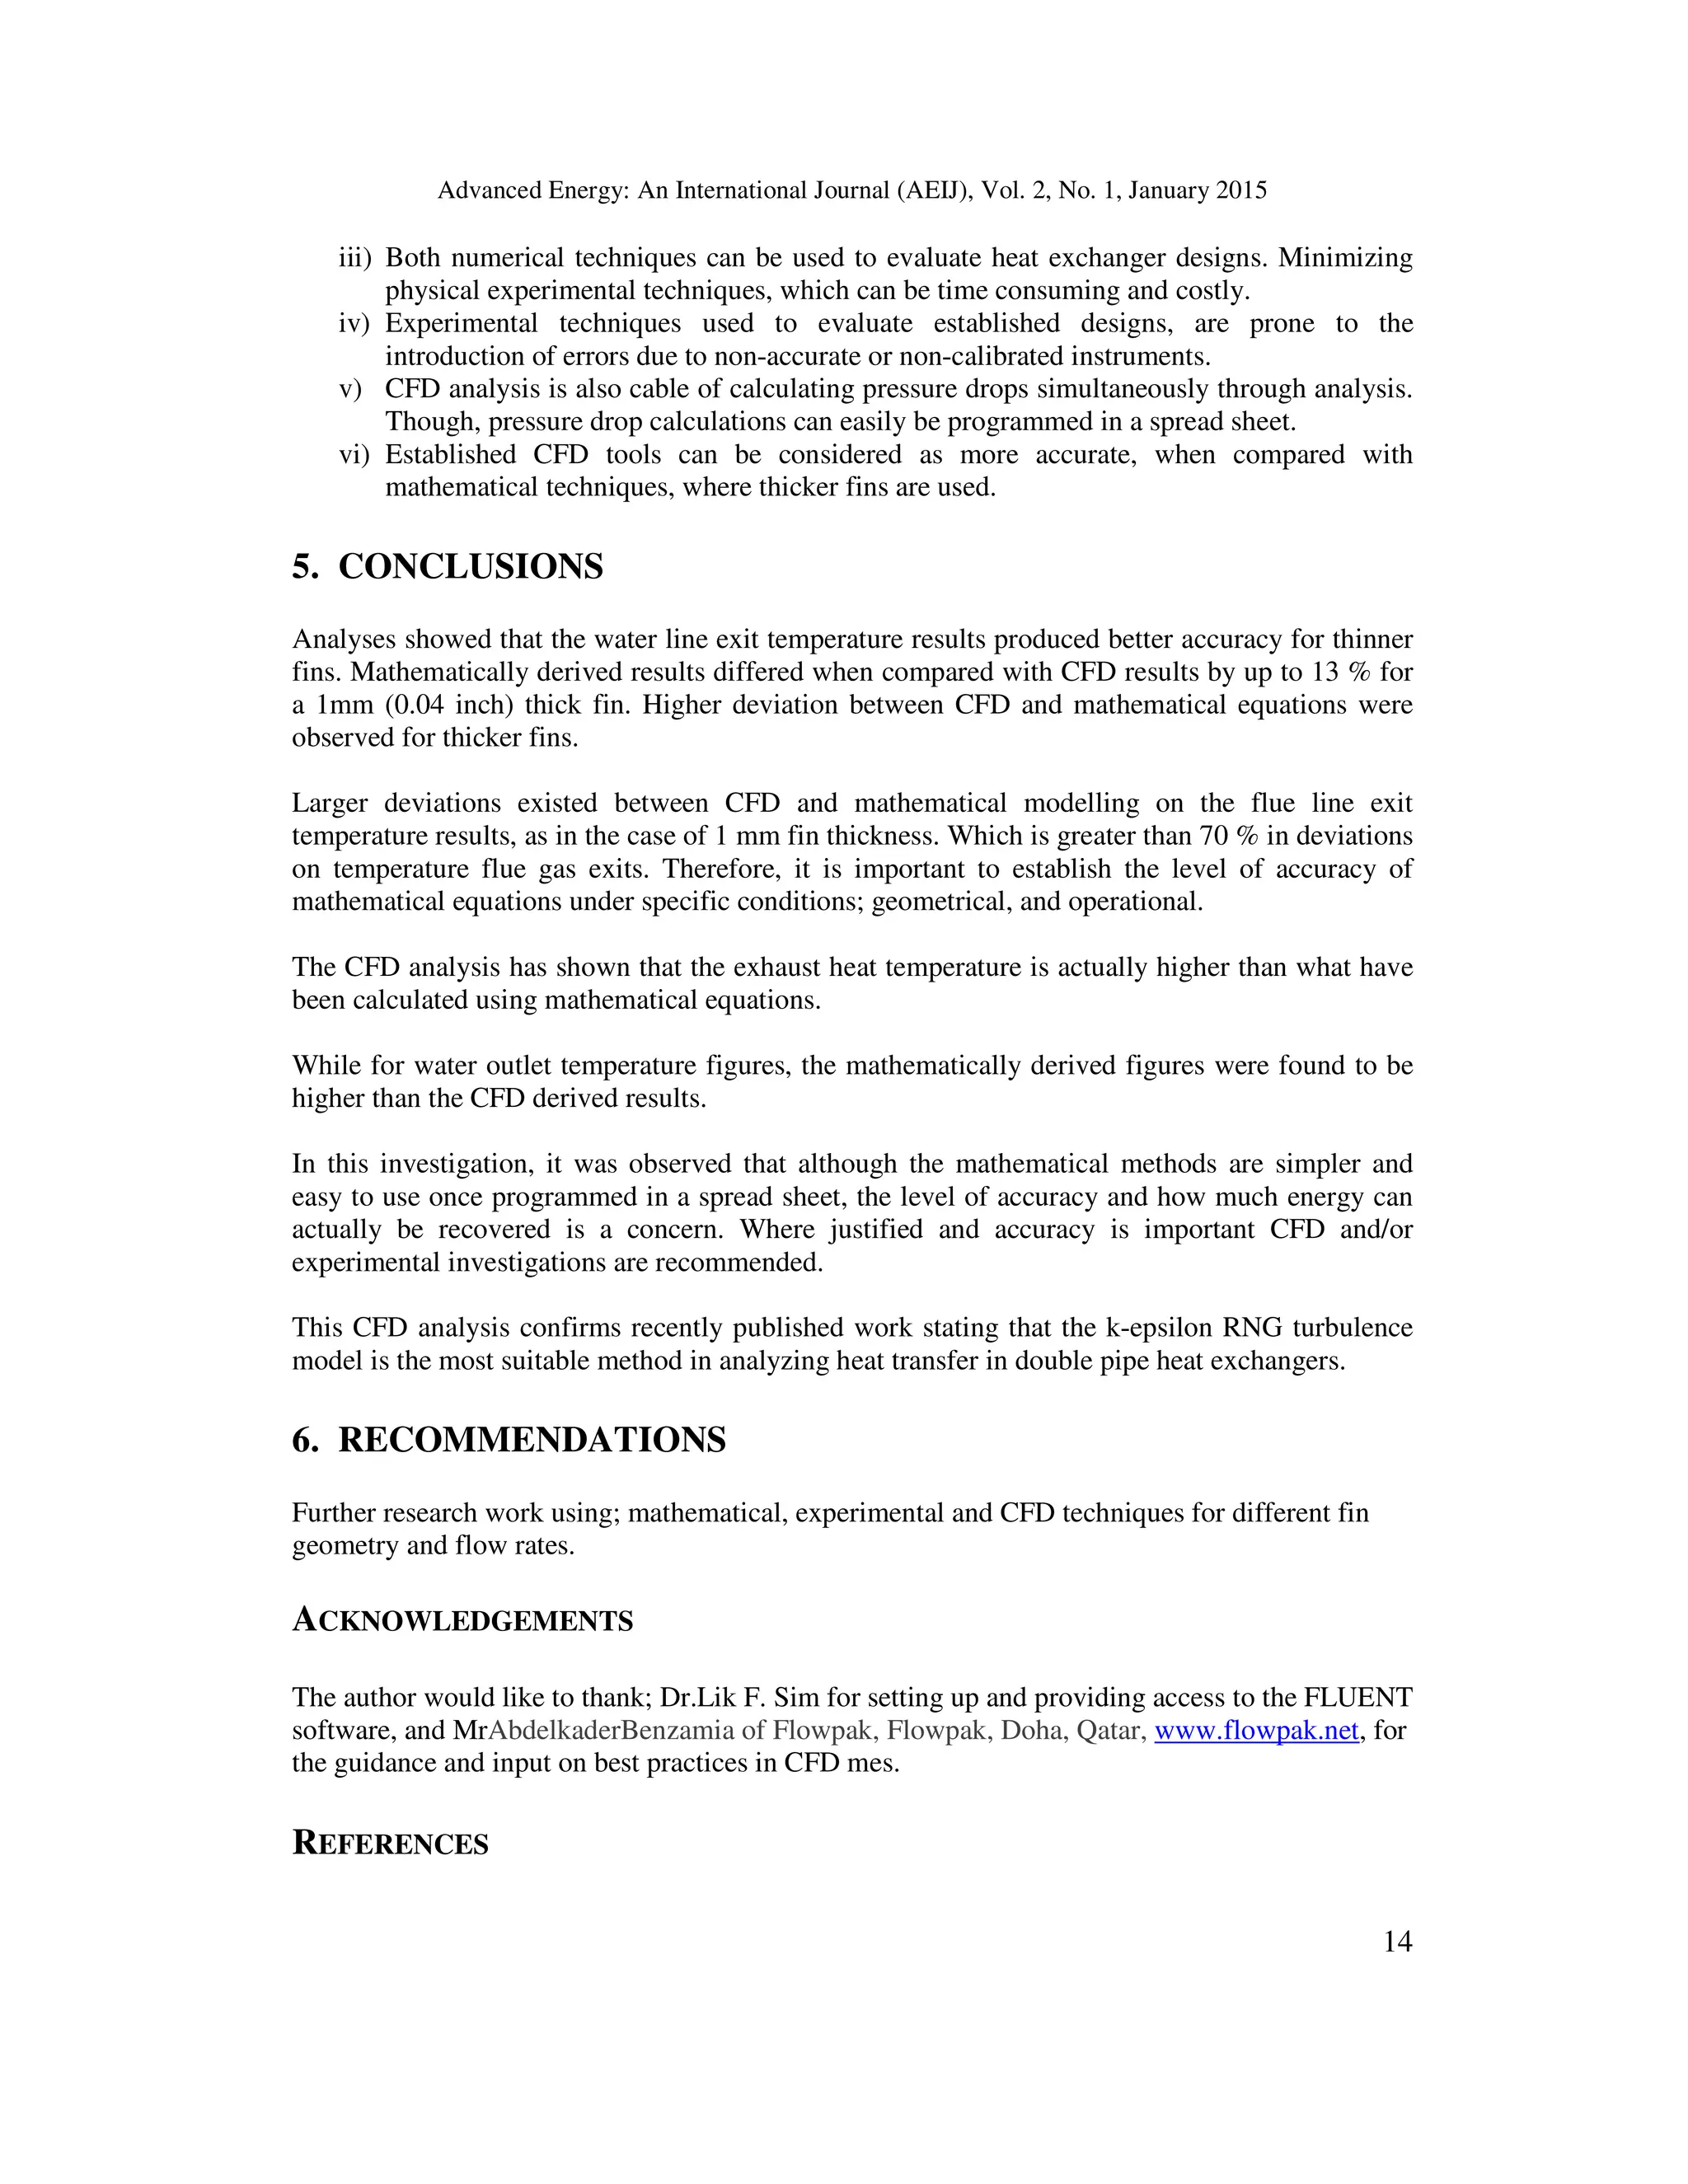
It is this low-Reynolds-number extension for near-wall turbulence catered for by the k-epsilon
RNG Near Wall Treatment function which makes the difference. The RNG Near Wall Treatment
was designed to work for coarse and fine mesh, however, for better accuracy, mesh layers were
inflated as shown in Fig 11.
4.2 Advantages disadvantages between the two techniques.
i) Spread sheets are relatively easier to program and do not require specialist trained
personnel to operate, unlike CFD tools.
ii) CFD techniques as in the example shown above show graphical results, not possible with
excel sheets.](https://image.slidesharecdn.com/08aeijpaper-230208082942-83bf44c9/75/EVALUATING-MATHEMATICAL-HEAT-TRANSFER-EFFECTIVENESS-EQUATIONS-USING-CFD-TECHNIQUES-FOR-A-FINNED-DOUBLE-PIPE-HEAT-EXCHANGER-13-2048.jpg)
![Advanced Energy: An International Journal (AEIJ), Vol. 2, No. 1, January 2015
15
[1] ASHRAE Fundamental. F4.22-2009.
[2] ASHRAE Fundamentals. F4.21: 2009.
[3] Author E Rathakrishnan, Title; Gas Dynamics. Fifth edition. Publisher PHI. Year 2004.
[4] Author, Fay C McQuiston. Title, Heating Ventilating and Air Conditioning – Analysis and Design.
Fifth edition. Published by John Wiley and sons, Inc USA. Pages 484 and 485. Year 2000.
[5] Paper by; M. Hatami, M. Jafaryar, D.D. Ganji and M. Gorji-Bandpy. Optimization of finned-tube
heat exchangers for diesel exhaust waste heat recovery using CFD and CCD techniques. International
Communications in Heat and Mass Transfer, Volume 57, October 2014, Pages 254–263.
[6] B.S. Massey, Title; Mechanics of Fluids. Fifth edition. Publisher Van Nostrand Reinhold (UK). Year
1982.
APPENDIX 1
Spreadsheet excel version 2010 was used in programming the equations shown below given in ASHRAE
Fundamentals (2009) [2].
Assumptions:
a. Not heat losses on the outside pipe wall, insulated.
b. Starting with assumed properties of water and specific heat capacity of flue gas. At mean
temperatures. Requirement for iterations can be checked as discussed in section 1 above.
c. Counter flow conditions equation. C ≠ 1, ASHRAE Fundamentals.
Table 3. Shows data entered in a spreadsheet programmed with the equations mentioned in steps 1
to 4.
Description Abbreviation Input Units
Water in pipe tci 40
ºC
Water Velocity vc 0.5 m/s
Gas enters thi 200 ºC
Mass flow rate h 0.12 kg/s
Length of heat exchanger Ltube 5
m
diameter of inner tube d 0.04 m
Fin radial height L 0.06 m
Fin thickness t 0.001 m
Number of fins N 16
Convective heat transfer
coefficient on water side hi
Gas side heat transfer coefficient ho 115 W/(m2
K)
Surface effectiveness øs 0.641964
Fin efficiency ø
Surface are of non-finned surface Auf 0.5484 m2
Fin surface area Af 9.6 m2
Auf +
Af Ao 10.1484 m2
πdLtube Ai 0.6284 m2
(104 ºF)
(1.64 ft/s)
(392 ºF)
(0.264 lb/s)
(16.4 ft)
(0.1312 ft)
(0.1968 ft)
(0.00328 ft)](https://image.slidesharecdn.com/08aeijpaper-230208082942-83bf44c9/75/EVALUATING-MATHEMATICAL-HEAT-TRANSFER-EFFECTIVENESS-EQUATIONS-USING-CFD-TECHNIQUES-FOR-A-FINNED-DOUBLE-PIPE-HEAT-EXCHANGER-15-2048.jpg)
![Advanced Energy: An International Journal (AEIJ), Vol. 2, No. 1, January 2015
16
Density of water ρ 990.4 kg/m3
Specific heat capacity of water cpc 4183 J/(kg.K)
Dynamic viscosity µ 5.96E-04 (N.s)/ m2
Thermal conductivity water side k 0.6376 W/(m.K)
Prandtl Number Pr 3.91
Gas specific heat - assumed
figures for air cph 1018 J/(kg.K)
ε= 0.984714
the= 42.44 C
tce= 47.39 C
the = temperature of gas leaving system, tce = temperature of water leaving system.
Step 1
Re= ρ vcd / µ
fs/2 =[ [1.58ln(Re)-3.28]^-2
]/2 = 0.00288
Nud= [0.00288×(33213-1000) ×3.91] ÷ [1+12.7×(0.00288)^0.5
×(3.91^2/3
-1) = 180.4
hf= (180.4×0.6376)/0.04 = 2876 W/(m2
K)
Step 2
Calculating fin efficiency ø and surface effectiveness øs. For a rectangular fin with the end of the fin not
exposed.
Ø = [tanh (mL)] / mL
For copper k = 401W/(mK)
mL= (2ho/kt)1/2L = [(2 115)/(401 0.001)]1/2(0.06) = 1.44
Ø = 0.62
Øs= (Auf +ØAf)/A0 = (0.548 + 0.62 × 9.6)/10.15 = 0.64
Step 3
Find heat exchanger effectiveness. For air at an assumed mean temperature
of 175°C, cph= 1018 J/(kg·K).
Ch= cph= 0.12 1018 = 122.2 W/K
c = ρvcπd2/4 = (990.4 × 0.5 × π × 0.042
)/4 = 0.6223 kg/s
Cc = cpc= 0.6223 × 4181 = 2602 W/K
cr= Cmin/Cmax= 122.2/2602 = 0.04696
UA = [1/(0.64 × 115 × 10.15) + 1/(2876 × 0.628)]–1 = 528.5 W/K
NTU = UA/Cmin= 528.5/122.2 = 4.32
ε = 1-exp[-N(1-cr)] ÷ [1-crexp[-N(1-cr)]
ε = 0.983
Step 4
qmax= Cmin× (thi– tci) = 122.2 × (200 – 40) = 19 552 W
q = εqmax= 0.985 × 19 552 = 19 255 W
Step 5
the = thi – q/Ch = 200 – (19255/122.2) = 42.2 C (107.9 F)
tce = tci + q/Cc = 40 + (19255/2602) 47.4 C (117.32 F)
(108.4 °F)
(117.3 °F)](https://image.slidesharecdn.com/08aeijpaper-230208082942-83bf44c9/75/EVALUATING-MATHEMATICAL-HEAT-TRANSFER-EFFECTIVENESS-EQUATIONS-USING-CFD-TECHNIQUES-FOR-A-FINNED-DOUBLE-PIPE-HEAT-EXCHANGER-16-2048.jpg)
![Advanced Energy: An International Journal (AEIJ), Vol. 2, No. 1, January 2015
17
APPENDIX 2
This section provides a description of the turbulence model equations used in this CFD analysis, boundary
inlet outlet conditions, and details of specific settings used in this CFD analysis. A graphical presentation
showing the quality of mesh used can be seen in Fig 11.
k-epsilon RNG
Unlike other turbulence models, the k-epsilon RNG also known as k-ε RNG model focuses on the
mechanisms that affect the turbulent kinetic energy. This model is a development on the standard k-ε
model. A description of this model given in a paper by M Hatami (2014) [5];
RNG k–ε model thermal effect is considered in the enhanced wall treatment panel. Transport equations for
RNG k–ε model in general form are
and
where Gk represents the generation of turbulence kinetic energy due to the mean velocity gradients and Gb
is the generation of turbulence kinetic energy due to buoyancy and C1e=1.42, C2e=1.68 in RNG k–ε model.
In m Hatami’s [2014) [5] paper states that the k-ω SST also known k-omega SST, and k–ε RNG were
found most suitable in analyzing a double pipe heat exchanger, in comparison with experimentally derived
results. Also, quoted that the RNG model was found easier to converge. These statements were found
applicable in this CFD analysis.
The RNG model settings used in this paper were set at default with the exception of the following
selections; Select Enhanced Wall treatment, and then from the Enhanced Wall Treatment Effects, select
Pressure Gradient Effects and Thermal Effects items from the k–ε RNG model menu. These selections
allow the model to address heat transfer and viscous layers at boundary conditions, which are important in
this analysis.
For inlets and outlets boundary conditions, Intensity and Viscosity ratio model was used, with the following
Specification Methods settings;
• Water inlet, 1% turbulence intensity, and 10 for viscosity ratio.
• Water outlet, 10% turbulence intensity, and 10 for viscosity ratio.
• Gas inlet, 1% turbulence intensity, and 10 for viscosity ratio.
• Gas outlet, 10% turbulence intensity, and 10 for viscosity ratio.
AUTHORS
Ali Hasan, MSc Engineering 1993 from Sheffield Hallam University, Sheffield UK. Present employer KEO
Consulting Engineers, Qatar. Working mainly on HVAC, CFD, and Energy efficiency projects. Place of
birth Baghdad, Iraq. Date of birth 03-04-1963.](https://image.slidesharecdn.com/08aeijpaper-230208082942-83bf44c9/75/EVALUATING-MATHEMATICAL-HEAT-TRANSFER-EFFECTIVENESS-EQUATIONS-USING-CFD-TECHNIQUES-FOR-A-FINNED-DOUBLE-PIPE-HEAT-EXCHANGER-17-2048.jpg)


