Downloaded 24 times
![IJRET: International Journal of Research in Engineering and Technology eISSN: 2319-1163 | pISSN: 2321-7308
_______________________________________________________________________________________
Volume: 04 Issue: 06 | June-2015, Available @ http://www.ijret.org 526
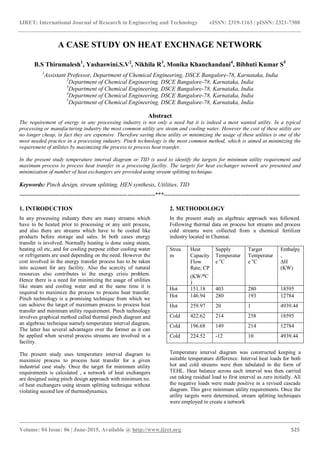
3. RESULTS AND DISCUSSION
3.1 Temperature Interval Diagram
In the Temperature Interval Diagram (TID), 8 intervals were
constructed based on data shown in Figure 1.
Fig 1: Temperature Interval Diagram (for 10⁰C)
In Table of Exchangeable heat loads, total loads for each
interval was summarized in Table 1 and Table 2 for both hot
and cold streams respectively.
Table 1: Table of Exchangeable Heat Loads (TEHL) for
Hot Side:
Interva
l
H1(KW) H2(KW) H3(KW) HHz(KW
)
1 18595.5 0 0 18595.5
2 0 1763.371 0 1763.371
3 0 6465.694 0 6465.694
4 0 4555.375 0 4555.375
5 0 0 0 0
6 0 0 0 0
7 0 0 4939.443 4939.443
8 0 0 0 0
Table 2: Table of Exchangeable Heat Loads (TEHL) for
Cold Side:
Interval C1(KW) C2(KW) C3(KW) HCz(KW)
1 0 0 0 0
2 0 0 0 0
3 18595.5 0 0 18595.5
4 0 6097.19 0 6097.19
5 0 6687.2 0 6687.2
6 0 0 0 0
7 0 0 4265.8 4265.8
8 0 0 673.56 673.56
Fig 2: Cascade and Revised Cascade Diagram
From the revised cascade diagram, the minimum hot utility
was found to be 0.007 KW and minimum cold utility was
found to be 0 KW for ∆Tmin 10⁰C.
It was the case of threshold problem. An increase in ∆Tmin
overcomes the threshold problems [2]. However heat
exchanger network synthesis can be done for threshold
problems also. For threshold problem a capital energy trade
off suggested that the optimum temperature difference was
below threshold value. In order to get a pinch point in such
cases, the capital energy trade off suggested that, the
optimum temperature be increased such that it is at or above
the threshold value.
3.2 Heat Exchange Network Synthesis
From the pinch analysis, it was found that the minimum cold
utility was 0 KW. Hence the most constrained part lies in
the no utility zone. This was considered to be “above the
pinch” problem.
3.3 Minimum Number of Heat Exchangers
CP inequality criteria and the ∆Tmin of 10⁰C between the
matched streams were maintained. Also the stream number
criteria, SH ≤ SC (above pinch) was followed wherein 3 hot
and cold streams were considered. Streams H3 and C3, H2
and C2, H3 and C3, H1 and C2, H1 and C2 were considered
to be the different heat exchangers. A hot utility at C2 was
found. Hence minimum number of heat exchangers was
found to be 6.](https://image.slidesharecdn.com/acasestudyonheatexchnagenetwork-160906061248/85/A-case-study-on-heat-exchnage-network-2-320.jpg)

![IJRET: International Journal of Research in Engineering and Technology eISSN: 2319-1163 | pISSN: 2321-7308
_______________________________________________________________________________________
Volume: 04 Issue: 06 | June-2015, Available @ http://www.ijret.org 528
and cold streams were considered. Streams H3 and C3, H2
and C2, H2 and C3, H2 and C2, H1 and C1 were considered
to be the different heat exchangers. A hot utility at C2 and
cold utility at H3 were found. Hence minimum number of
heat exchangers was found to be 7.
Fig 6: Pinch design (for ∆Tmin 15⁰C)
4. CONCLUSION
In order to overcome energy crisis in industry, heat
exchange network of different industries were studied.
In this case study which was taken from chemical fertilizer
industry, for ∆Tmin equal to 100
C, a threshold problem was
obtained with the cold utility equal to 0 KW.
At ∆Tmin equal to 15o
C, both utility requirements were found
to be 1122.6KW and for this a heat exchanger network
synthesis was done and it gave minimum of 7 heat
exchangers.
This study gave a network of heat exchangers with
maximum heat recovery among process streams there by
reducing the utility consumption. Here only one type of hot
utility and one type of cold utility was considered.
Even though initial ∆Tmin gave a threshold problem, a HEN
with heat recovery was synthesized. Thus an attempt was
made to understand the concept of threshold problems heat
exchange network synthesis and determination of minimum
number of heat exchangers, for an industrial problem.
REFERENCES
[1]. Process Integration: Mahmoud M.El-Halwagi
[2]. Chemical Process Design and Integration – Robin Smith
[3]. Beabu K. Piagbo1, American Journal of Engineering
Research (AJER) e-ISSN: 2320-0847 p -ISSN: 2320-0936
Volume-02, Issue-05, pp-11-18
[4]. Jackson Akpa, Journal of Emerging Trends in
Engineering and Applied Science, (JETEAS) 01/2012;
3(3):475-484.
[5]. John M. Joe, Journal of Power and Energy Engineering,
2013, 1, 47-52 http://dx.doi.org/10.4236/jpee.2013.15007
Published Online October 2013
[6]. Bodo Linnhoff†
and John R. Flower*
, Synthesis of Cost
Optimization Network, AIChE Journal Volume 24, Issue
4, pages 633– 642, July 1978
[7]. Linnhoff B, D.W. Townsend, D. Boland, G.F. Hewitt,
B.E.A. Thomas, A.R.Guy, and R.H. Marsland, “User Guide
on Process Integration for the Efficient Use of Energy”,
IChemE, Rugby, U.K. (1982).
[8]. Pinch Analysis Foundation Training Course, available
from Linnhoff March Ltd, UK.
[9]. “SuperTarget” pinch analysis software suite, available
from Linnhoff March Ltd, UK.
[10]. Townsend, D. W., and B. Linnhoff, “Heat and Power
Networks in Process Design, Part I: Criteria for Placement
of Heat Engines and Heat Pumps in Process Networks”,
AIChE J., 29(5), pp. 742-748 (May 1983). “Part II: Design
Procedure for Equipment Selection and Process Matching”,
AIChE J., 29(5), pp. 748-771 (May 1983).
BIOGRAPHIES
Mr. B.S Thirumalesh is currently
working as assistant Professor in the
Department of Chemical Engineering,
Dayananda Sagar College of
Engineering, Bangalore-78.His research
interest includes energy integration, Mass
Integration, Adsorption Studies etc.
Ms. Yashaswini S Vasisht is a chemical
engineer graduate from Dayananda Sagar
College of Engineering, Bangalore – 78.
Her research interest includes energy
integration, process design, heat transfer
etc.
Ms. Nikhila R is a chemical engineer
graduate from Dayananda Sagar College
of Engineering, Bangalore – 78. Her
research interest includes energy
integration, waste water treatment,
material science etc.
Ms. Monica Khanchandani is a chemical
Engineering graduate from Dayananda
Sagar College of Engineering, Bangalore
– 78. Her research interest includes
energy integration, computer applications,
java programming etc.
Mr. Bibhuti Kumar Singh is a chemical
engineer graduate from Dayananda Sagar
College of Engineering, Bangalore-78.
His research interest includes mass
integration, process integration etc.](https://image.slidesharecdn.com/acasestudyonheatexchnagenetwork-160906061248/85/A-case-study-on-heat-exchnage-network-4-320.jpg)

The document presents a case study on heat exchange network optimization in a chemical fertilizer industry using pinch technology and temperature interval diagrams. It outlines a methodology for minimizing utility requirements and maximizing heat transfer efficiency, and details results including the design of heat exchangers with specified constraints. The study demonstrates the importance of energy integration in industrial processes to reduce utility consumption and overcome energy crisis challenges.