Download as PDF, PPTX
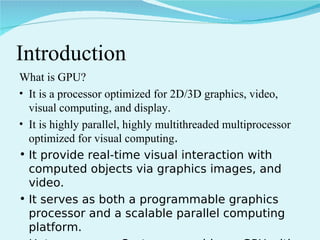
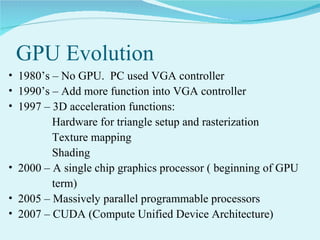
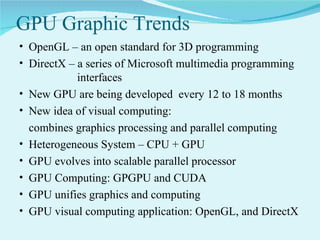
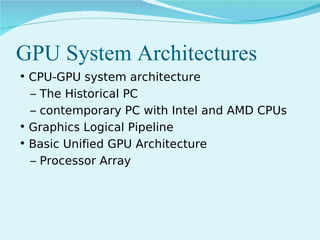
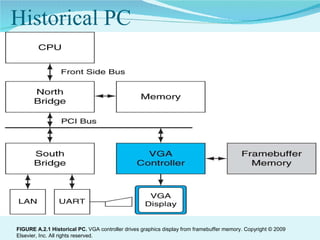
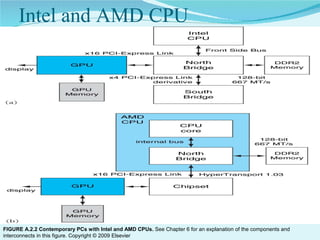
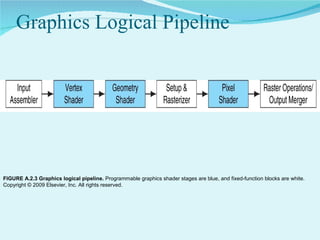
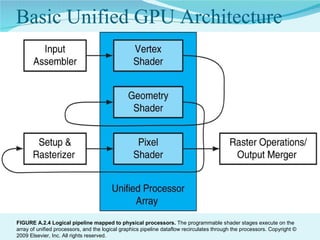
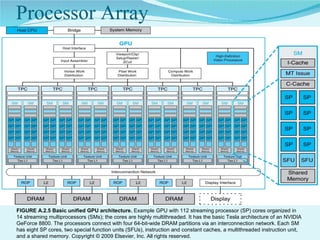

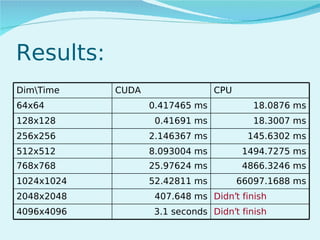
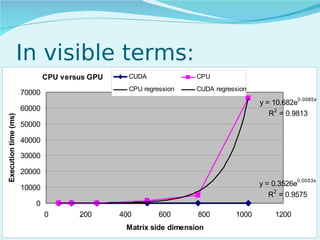


This document summarizes the evolution of GPUs and their advantages over CPUs for parallel processing. It discusses how GPUs have become highly parallel, multithreaded processors optimized for graphics and visual computing. The document outlines the key stages in GPU development from basic graphics controllers to massively parallel programmable processors. It provides examples of GPU architectures and how tasks like matrix operations that are well-suited to parallelism can be offloaded from CPUs to GPUs using CUDA to achieve significant performance gains. Test results show GPUs outperforming CPUs for large matrix multiplications, with execution time increasing sublinearly with matrix size for GPUs but superlinearly for CPUs.