Download as PDF, PPTX


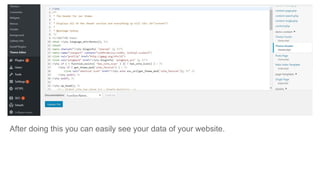


Google Analytics allows you to analyze insights from your website for marketing purposes. It provides details on users, including their locations, devices, sessions, and conversions. To use it, create a Google Analytics account, then add the tracking code to your website. This allows Google Analytics to collect data. The interface has four main sections: Home provides an overview of users and activity; Customization allows customizing reports; Reports show details on audiences, acquisitions, behavior, and conversions; and Admin manages accounts and properties. Key metrics include sessions, users, revenue, and conversion rate.


