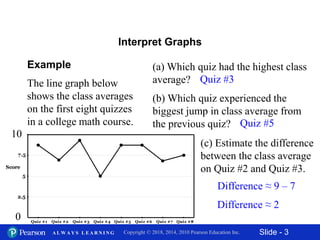
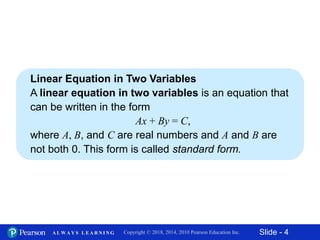
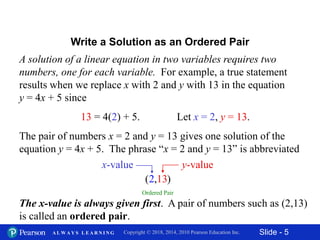
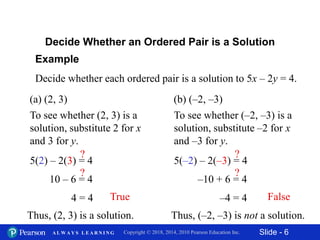
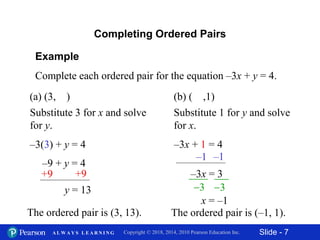
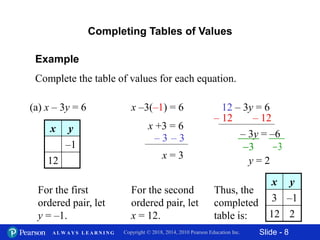
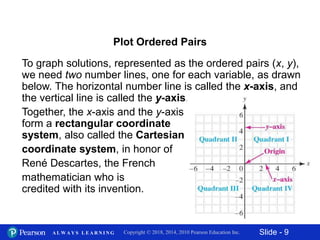
Slide - 1Copyright © 2018, 2014, 2010 Pearson Education Inc.A L W A Y S L E A R N I N G
2
Graphs of Linear
Equations and
Inequalities in Two
Variables
11
Slide - 2Copyright © 2018, 2014, 2010 Pearson Education Inc.A L W A Y S L E A R N I N G
1. Interpret graphs.
2. Write a solution as an ordered pair.
3. Decide whether a given ordered pair is a
solution of a given equation.
4. Complete ordered pairs for a given
equation.
5. Complete a table of values.
6. Plot ordered pairs.
Objectives
11.1 Linear Equations in Two Variables; The
Rectangular Coordinate System
Slide - 3Copyright © 2018, 2014, 2010 Pearson Education Inc.A L W A Y S L E A R N I N G
Interpret Graphs
Example
The line graph below
shows the class averages
on the first eight quizzes
in a college math course.
(a) Which quiz had the highest class
average?
(b) Which quiz experienced the
biggest jump in class average from
the previous quiz?
(c) Estimate the difference
between the class average
on Quiz #2 and Quiz #3.Score
Quiz #8Quiz #7Quiz #6Quiz #5Quiz #4Quiz #3Quiz #1 Quiz #2
2.5
5
7.5
10
Quiz #3
Quiz #5
Difference ≈ 9 – 7
Difference ≈ 2
0
10
Slide - 4Copyright © 2018, 2014, 2010 Pearson Education Inc.A L W A Y S L E A R N I N G
Linear Equation in Two Variables
A linear equation in two variables is an equation that
can be written in the form
Ax + By = C,
where A, B, and C are real numbers and A and B are
not both 0. This form is called standard form.
Slide - 5Copyright © 2018, 2014, 2010 Pearson Education Inc.A L W A Y S L E A R N I N G
A solution of a linear equation in two variables requires two
numbers, one for each variable. For example, a true statement
results when we replace x with 2 and y with 13 in the equation
y = 4x + 5 since
13 = 4(2) + 5. Let x = 2, y = 13.
The pair of numbers x = 2 and y = 13 gives one solution of the
equation y = 4x + 5. The phrase “x = 2 and y = 13” is abbreviated
The x-value is always given first. A pair of numbers such as (2,13)
is called an ordered pair.
Write a Solution as an Ordered Pair
Ordered Pair
1, 3( )2
y-valuex-value
Slide - 6Copyright © 2018, 2014, 2010 Pearson Education Inc.A L W A Y S L E A R N I N G
5(2) – 2(3) = 4
Example
Decide whether each ordered pair is a solution to 5x – 2y = 4.
(a) (2, 3)
Decide Whether an Ordered Pair is a Solution
To see whether (2, 3) is a
solution, substitute 2 for x
and 3 for y.
10 – 6 = 4
?
4 = 4 True
Thus, (2, 3) is a solution.
5(–2) – 2(–3) = 4
(b) (–2, –3)
To see whether (–2, –3) is a
solution, substitute –2 for x
and –3 for y.
–10 + 6 = 4
?
–4 = 4 False
Thus, (–2, –3) is not a solution.
? ?
Slide - 7Copyright © 2018, 2014, 2010 Pearson Education Inc.A L W A Y S L E A R N I N G
–3(3) + y = 4
Example
Complete each ordered pair for the equation –3x + y = 4.
(a) (3, )
Completing Ordered Pairs
Substitute 3 for x and solve
for y.
–9 + y = 4
y = 13
The ordered pair is (3, 13).
–3x + 1 = 4
(b) ( ,1)
–3x = 3
x = –1
The ordered pair is (–1, 1).
+9 +9
Substitute 1 for y and solve
for x.
–1 –1
3 3
Slide - 8Copyright © 2018, 2014, 2010 Pearson Education Inc.A L W A Y S L E A R N I N G
x –3(–1) = 6
Example
Complete the table of values for each equation.
(a) x – 3y = 6
Completing Tables of Values
For the first
ordered pair, let
y = –1.
x = 3
– 3 – 3
x y
–1
12
x +3 = 6
For the second
ordered pair, let
x = 12.
12 – 3y = 6
– 12 – 12
– 3y = –6
3 3
y = 2
Thus, the
completed
table is:
x y
3 –1
12 2
Slide - 9Copyright © 2018, 2014, 2010 Pearson Education Inc.A L W A Y S L E A R N I N G
Plot Ordered Pairs
To graph solutions, represented as the ordered pairs (x, y),
we need two number lines, one for each variable, as drawn
below. The horizontal number line is called the x-axis, and
the vertical line is called the y-axis.
Together, the x-axis and the y-axis
form a rectangular coordinate
system, also called the Cartesian
coordinate system, in honor of
René Descartes, the French
mathematician who is
credited with its invention.
Slide - 10Copyright © 2018, 2014, 2010 Pearson Education Inc.A L W A Y S L E A R N I N G
The coordinate system is divided into four regions, called
quadrants. These quadrants are numbered counter-
clockwise, as shown on the previous slide. Points on the
axes themselves are not in any quadrant. The point at
which the x-axis and the y-axis meet is called the origin.
The origin, which is labeled 0 in the previous figure, is the
point corresponding to (0,0).
Plot Ordered Pairs
The x-axis and y-axis determine a plane. By referring to the
two axes, every point in the plane can be associated with an
ordered pair. The numbers in the ordered pair are called the
coordinates of the point.
Slide - 11Copyright © 2018, 2014, 2010 Pearson Education Inc.A L W A Y S L E A R N I N G
For example, we locate the point associated with the ordered
pair (2, 3) by starting at the origin. Since the x-coordinate is 2,
we go 2 units to the right along the x-axis. Then, since the y-
coordinate is 3, we turn and go up 3 units on a line parallel to
the y-axis. Thus, the point (2, 3) is plotted.
Plot Ordered Pairs
Note
When we graph on a
number line, one number
corresponds to each point.
On a plane, however, both
numbers in an ordered
pair are needed to locate
a point. The ordered pair
is a name for the point.
Slide - 12Copyright © 2018, 2014, 2010 Pearson Education Inc.A L W A Y S L E A R N I N G
Example 6
Plot each ordered pair on a coordinate system.
(a) (1, 5)
(b) (–2, 3)
(c) (–1, –4)
(d) (3, –2)
(e)
(f) (5, 0)
(g) (0, –3)
Plotting Ordered Pairs
3
,2
2
 
 
 

11.1 linear equations in two variables

  • 1.
    Slide - 1Copyright© 2018, 2014, 2010 Pearson Education Inc.A L W A Y S L E A R N I N G 2 Graphs of Linear Equations and Inequalities in Two Variables 11
  • 2.
    Slide - 2Copyright© 2018, 2014, 2010 Pearson Education Inc.A L W A Y S L E A R N I N G 1. Interpret graphs. 2. Write a solution as an ordered pair. 3. Decide whether a given ordered pair is a solution of a given equation. 4. Complete ordered pairs for a given equation. 5. Complete a table of values. 6. Plot ordered pairs. Objectives 11.1 Linear Equations in Two Variables; The Rectangular Coordinate System
  • 3.
    Slide - 3Copyright© 2018, 2014, 2010 Pearson Education Inc.A L W A Y S L E A R N I N G Interpret Graphs Example The line graph below shows the class averages on the first eight quizzes in a college math course. (a) Which quiz had the highest class average? (b) Which quiz experienced the biggest jump in class average from the previous quiz? (c) Estimate the difference between the class average on Quiz #2 and Quiz #3.Score Quiz #8Quiz #7Quiz #6Quiz #5Quiz #4Quiz #3Quiz #1 Quiz #2 2.5 5 7.5 10 Quiz #3 Quiz #5 Difference ≈ 9 – 7 Difference ≈ 2 0 10
  • 4.
    Slide - 4Copyright© 2018, 2014, 2010 Pearson Education Inc.A L W A Y S L E A R N I N G Linear Equation in Two Variables A linear equation in two variables is an equation that can be written in the form Ax + By = C, where A, B, and C are real numbers and A and B are not both 0. This form is called standard form.
  • 5.
    Slide - 5Copyright© 2018, 2014, 2010 Pearson Education Inc.A L W A Y S L E A R N I N G A solution of a linear equation in two variables requires two numbers, one for each variable. For example, a true statement results when we replace x with 2 and y with 13 in the equation y = 4x + 5 since 13 = 4(2) + 5. Let x = 2, y = 13. The pair of numbers x = 2 and y = 13 gives one solution of the equation y = 4x + 5. The phrase “x = 2 and y = 13” is abbreviated The x-value is always given first. A pair of numbers such as (2,13) is called an ordered pair. Write a Solution as an Ordered Pair Ordered Pair 1, 3( )2 y-valuex-value
  • 6.
    Slide - 6Copyright© 2018, 2014, 2010 Pearson Education Inc.A L W A Y S L E A R N I N G 5(2) – 2(3) = 4 Example Decide whether each ordered pair is a solution to 5x – 2y = 4. (a) (2, 3) Decide Whether an Ordered Pair is a Solution To see whether (2, 3) is a solution, substitute 2 for x and 3 for y. 10 – 6 = 4 ? 4 = 4 True Thus, (2, 3) is a solution. 5(–2) – 2(–3) = 4 (b) (–2, –3) To see whether (–2, –3) is a solution, substitute –2 for x and –3 for y. –10 + 6 = 4 ? –4 = 4 False Thus, (–2, –3) is not a solution. ? ?
  • 7.
    Slide - 7Copyright© 2018, 2014, 2010 Pearson Education Inc.A L W A Y S L E A R N I N G –3(3) + y = 4 Example Complete each ordered pair for the equation –3x + y = 4. (a) (3, ) Completing Ordered Pairs Substitute 3 for x and solve for y. –9 + y = 4 y = 13 The ordered pair is (3, 13). –3x + 1 = 4 (b) ( ,1) –3x = 3 x = –1 The ordered pair is (–1, 1). +9 +9 Substitute 1 for y and solve for x. –1 –1 3 3
  • 8.
    Slide - 8Copyright© 2018, 2014, 2010 Pearson Education Inc.A L W A Y S L E A R N I N G x –3(–1) = 6 Example Complete the table of values for each equation. (a) x – 3y = 6 Completing Tables of Values For the first ordered pair, let y = –1. x = 3 – 3 – 3 x y –1 12 x +3 = 6 For the second ordered pair, let x = 12. 12 – 3y = 6 – 12 – 12 – 3y = –6 3 3 y = 2 Thus, the completed table is: x y 3 –1 12 2
  • 9.
    Slide - 9Copyright© 2018, 2014, 2010 Pearson Education Inc.A L W A Y S L E A R N I N G Plot Ordered Pairs To graph solutions, represented as the ordered pairs (x, y), we need two number lines, one for each variable, as drawn below. The horizontal number line is called the x-axis, and the vertical line is called the y-axis. Together, the x-axis and the y-axis form a rectangular coordinate system, also called the Cartesian coordinate system, in honor of René Descartes, the French mathematician who is credited with its invention.
  • 10.
    Slide - 10Copyright© 2018, 2014, 2010 Pearson Education Inc.A L W A Y S L E A R N I N G The coordinate system is divided into four regions, called quadrants. These quadrants are numbered counter- clockwise, as shown on the previous slide. Points on the axes themselves are not in any quadrant. The point at which the x-axis and the y-axis meet is called the origin. The origin, which is labeled 0 in the previous figure, is the point corresponding to (0,0). Plot Ordered Pairs The x-axis and y-axis determine a plane. By referring to the two axes, every point in the plane can be associated with an ordered pair. The numbers in the ordered pair are called the coordinates of the point.
  • 11.
    Slide - 11Copyright© 2018, 2014, 2010 Pearson Education Inc.A L W A Y S L E A R N I N G For example, we locate the point associated with the ordered pair (2, 3) by starting at the origin. Since the x-coordinate is 2, we go 2 units to the right along the x-axis. Then, since the y- coordinate is 3, we turn and go up 3 units on a line parallel to the y-axis. Thus, the point (2, 3) is plotted. Plot Ordered Pairs Note When we graph on a number line, one number corresponds to each point. On a plane, however, both numbers in an ordered pair are needed to locate a point. The ordered pair is a name for the point.
  • 12.
    Slide - 12Copyright© 2018, 2014, 2010 Pearson Education Inc.A L W A Y S L E A R N I N G Example 6 Plot each ordered pair on a coordinate system. (a) (1, 5) (b) (–2, 3) (c) (–1, –4) (d) (3, –2) (e) (f) (5, 0) (g) (0, –3) Plotting Ordered Pairs 3 ,2 2      