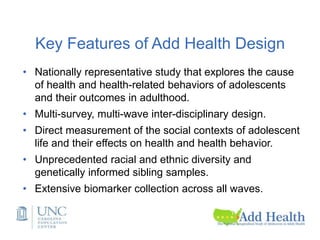
The document discusses the Add Health study, a national longitudinal study aimed at understanding adolescent health and its social contexts, initiated in 1994 by the NIH. It details various aspects of the study's design, including unique network data collection methods, main IRB issues, and data security protocols to protect respondents' identities and ensure confidentiality. Additionally, it highlights the study's successes in producing significant research outputs and ongoing challenges related to data security and participant confidentiality.
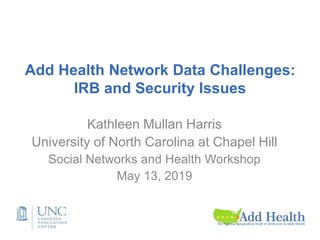

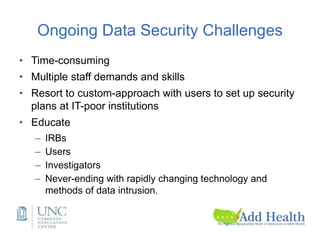
![Unique Network Data
• Nominations of 5 best male and 5 best female friends
during in-school administration;
• Nomination of sexual and romantic partners in Wave I in-
home interview;
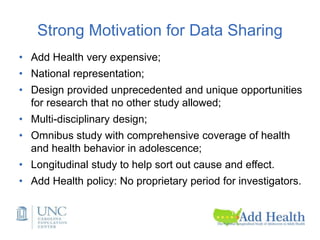
• Nomination of best friend in Wave I and Wave II in-home
interview;
• Nomination of 5 best male and female friends, sexual and
romantic partners in Wave I in-home interview in saturated
samples (N~3,000).
• 1,500 couple sample at Wave III.
• Contact with [potential] Wave I (1995) friends at Wave III
(2001-02) (asked of 7th and 8th graders from Wave I).](https://image.slidesharecdn.com/dukenetworkworkshopmay2019-190927194721/85/01-Add-Health-Network-Data-Challenges-IRB-and-Security-Issues-8-320.jpg)
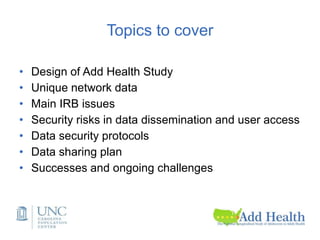
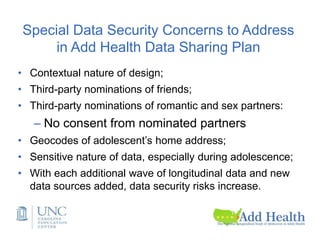
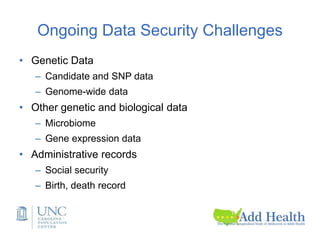
![Wave I Friendship nominations
• Version A: [For R’s asked to nominate up to 5 male
and 5 female friends.]
• First, please tell me the name of your 5 best male
friends, starting with your best male friend. (If R is
female, add: If you have a boyfriend, list him first. If
not, begin with your best male friend.)
• Version B: [For R’s asked to nominate 1 male and 1
female friends.]
• The next questions are about your friends. First,
please think of your best male friend. What is his
name?](https://image.slidesharecdn.com/dukenetworkworkshopmay2019-190927194721/85/01-Add-Health-Network-Data-Challenges-IRB-and-Security-Issues-9-320.jpg)
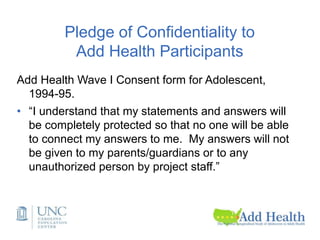
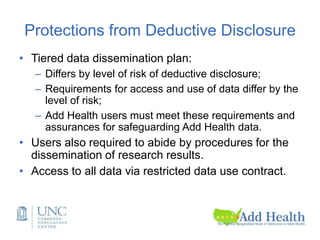
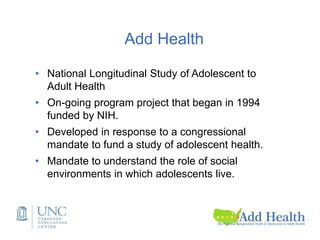
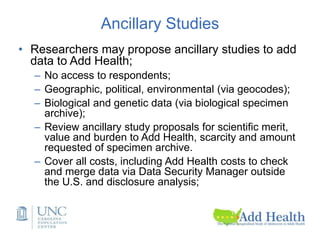
![Four tier data dissemination
according to disclosure risks
• Public-use data (no friendship or romantic pairs
linkages)
• Restricted-use data (no romantic pairs, HIV)
• High-security restricted data
• Secure data facility for analyzing high school
transcript data and for using geocodes to link
contextual data.
• [Secure server for access to genome-wide data.]](https://image.slidesharecdn.com/dukenetworkworkshopmay2019-190927194721/85/01-Add-Health-Network-Data-Challenges-IRB-and-Security-Issues-24-320.jpg)


![Polymer [ बहुलक ] Chemistry Notes PDF - Irfanullah Mehar - JJ Sir Chemistry.pdf](https://cdn.slidesharecdn.com/ss_thumbnails/polymerchemistrynotespdf-irfanullahmehar-jjsirchemistry-260210172118-3f9b37f7-thumbnail.jpg?width=640&height=640&fit=bounds)


