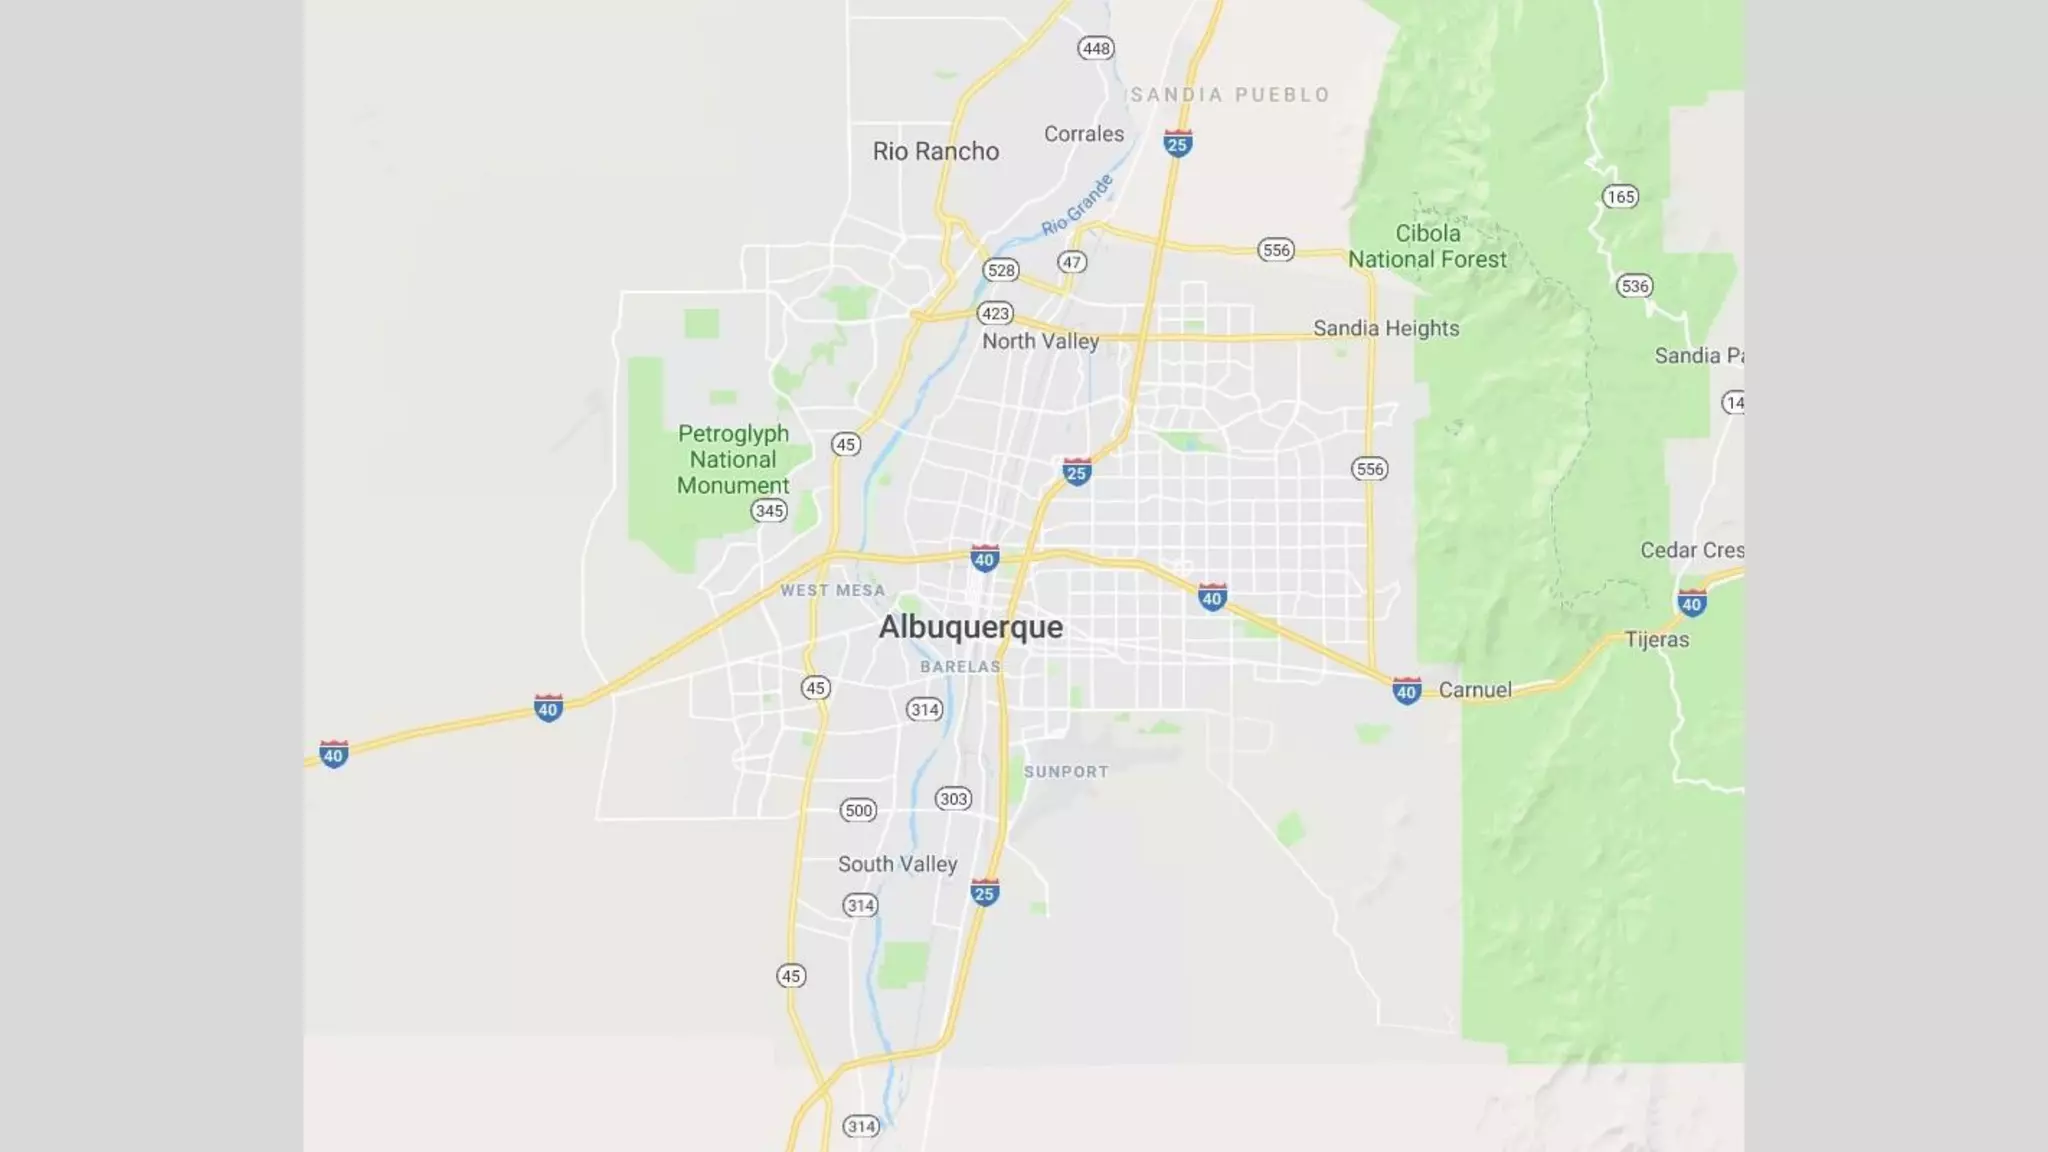
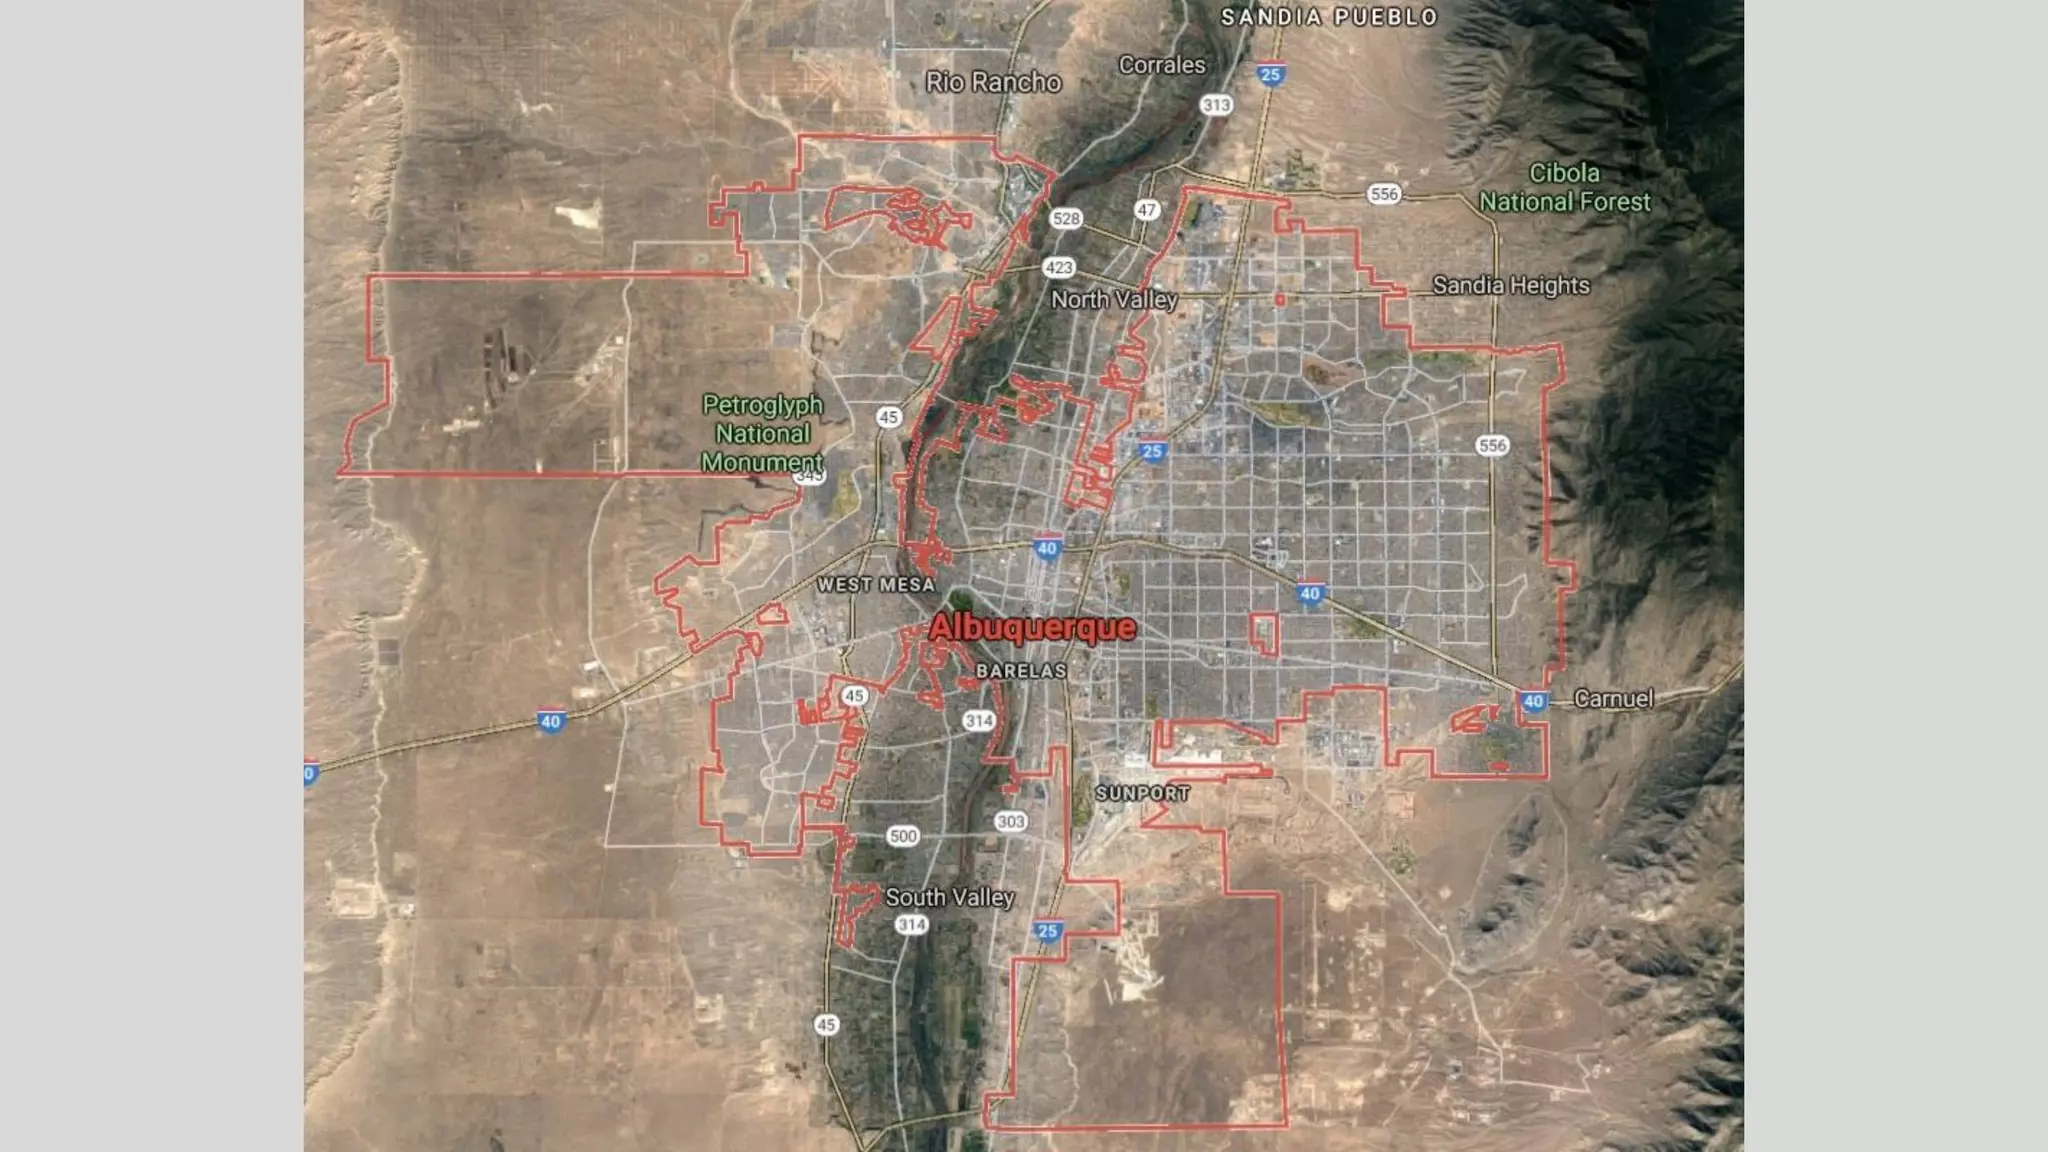
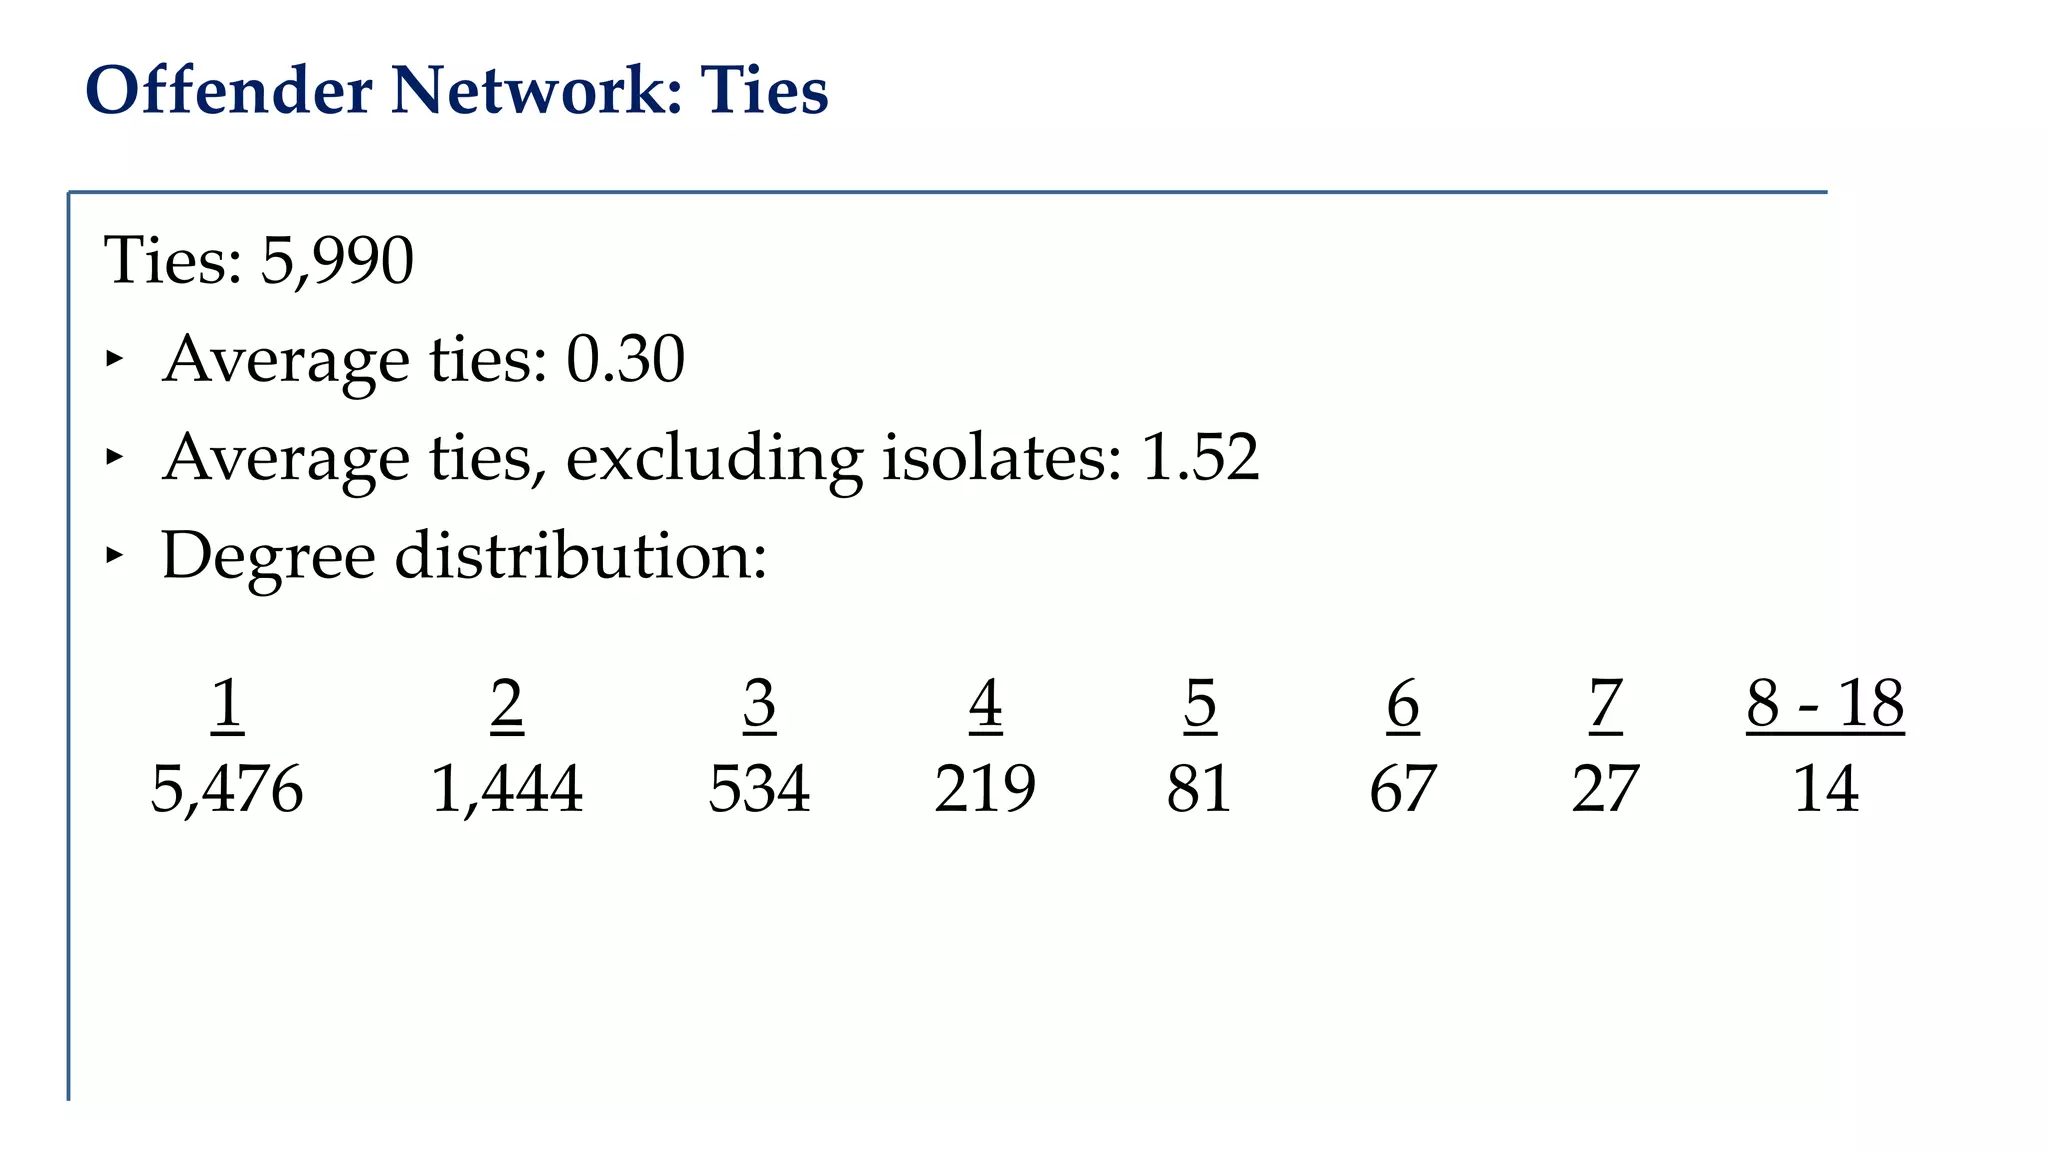
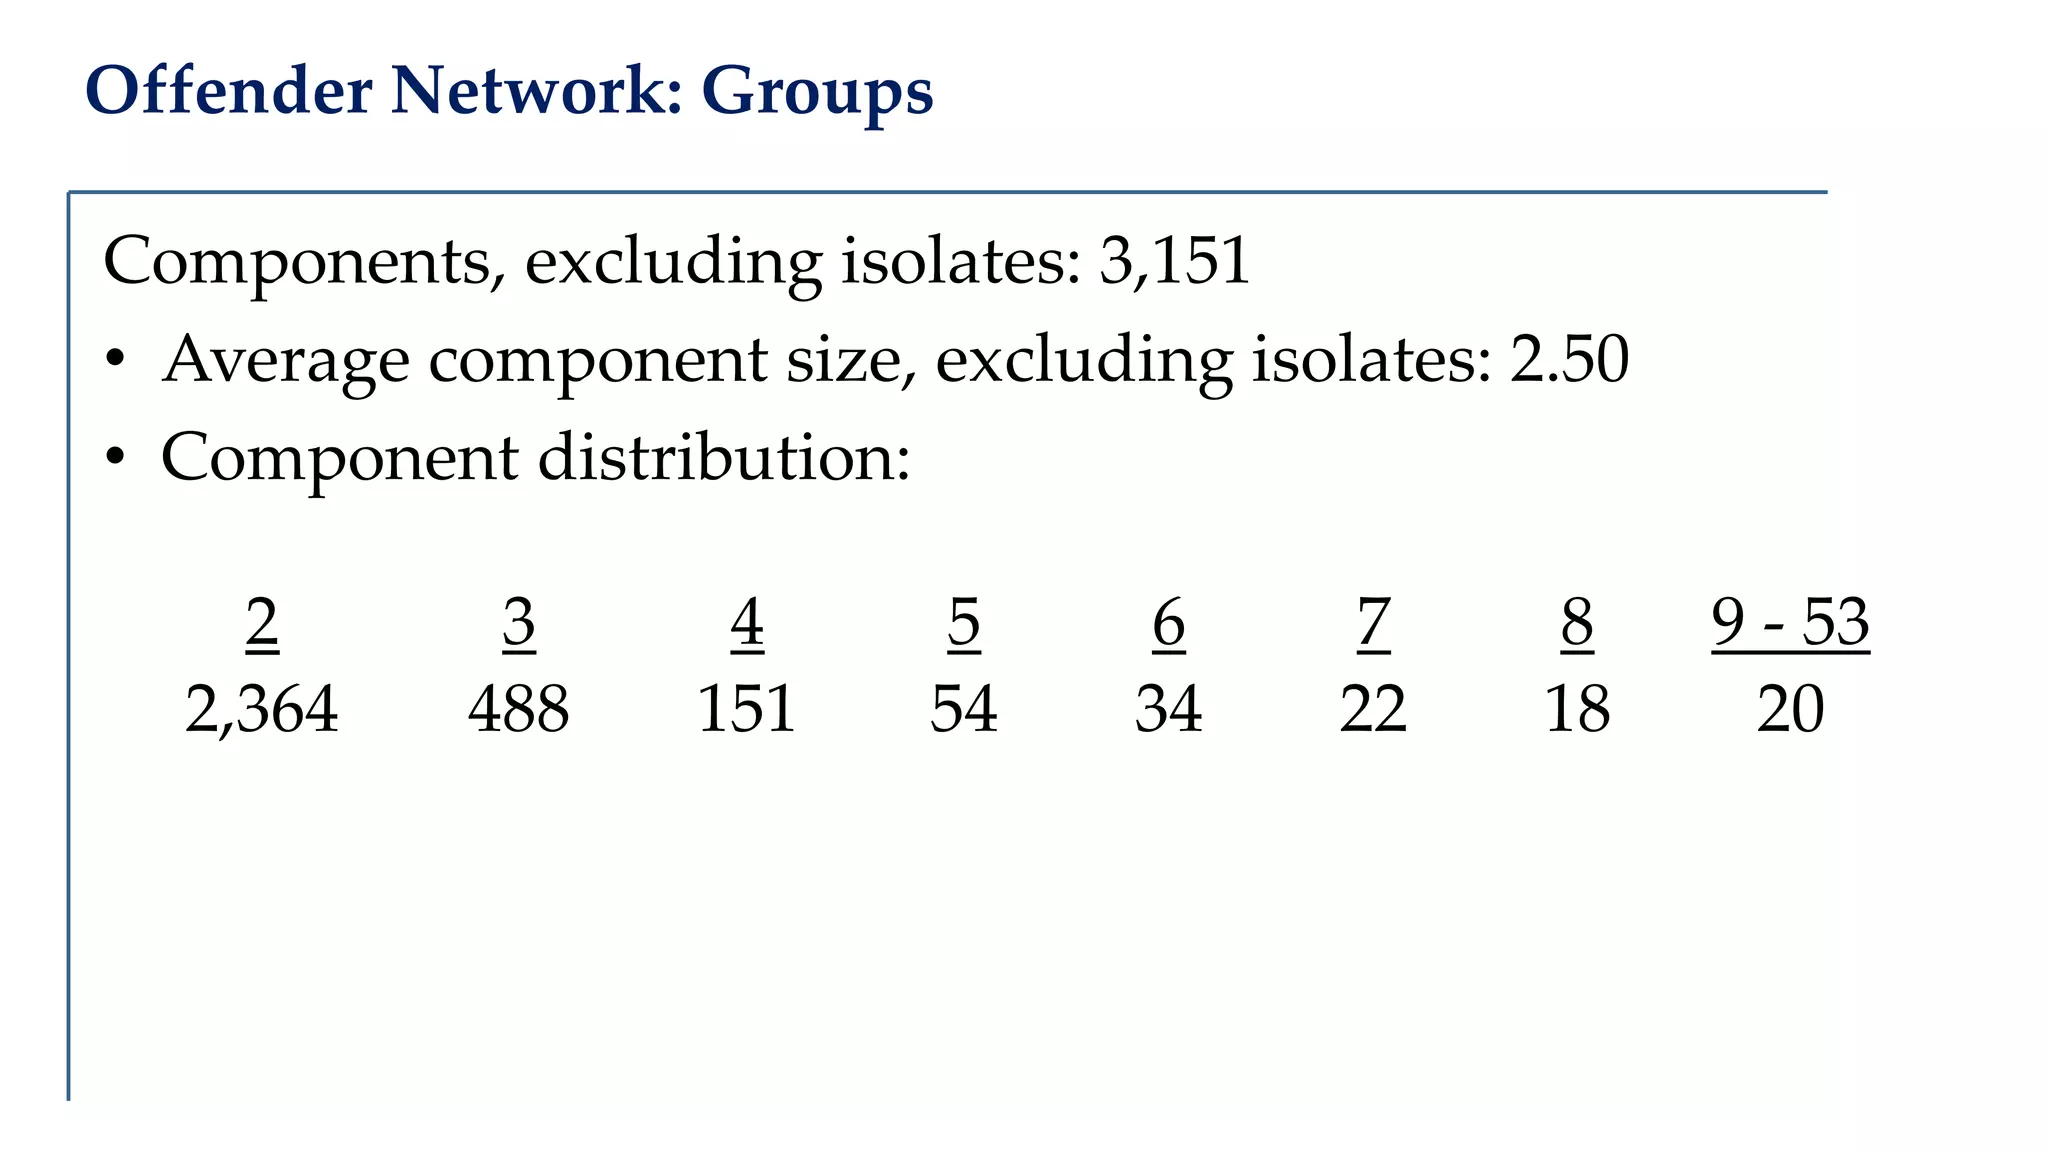
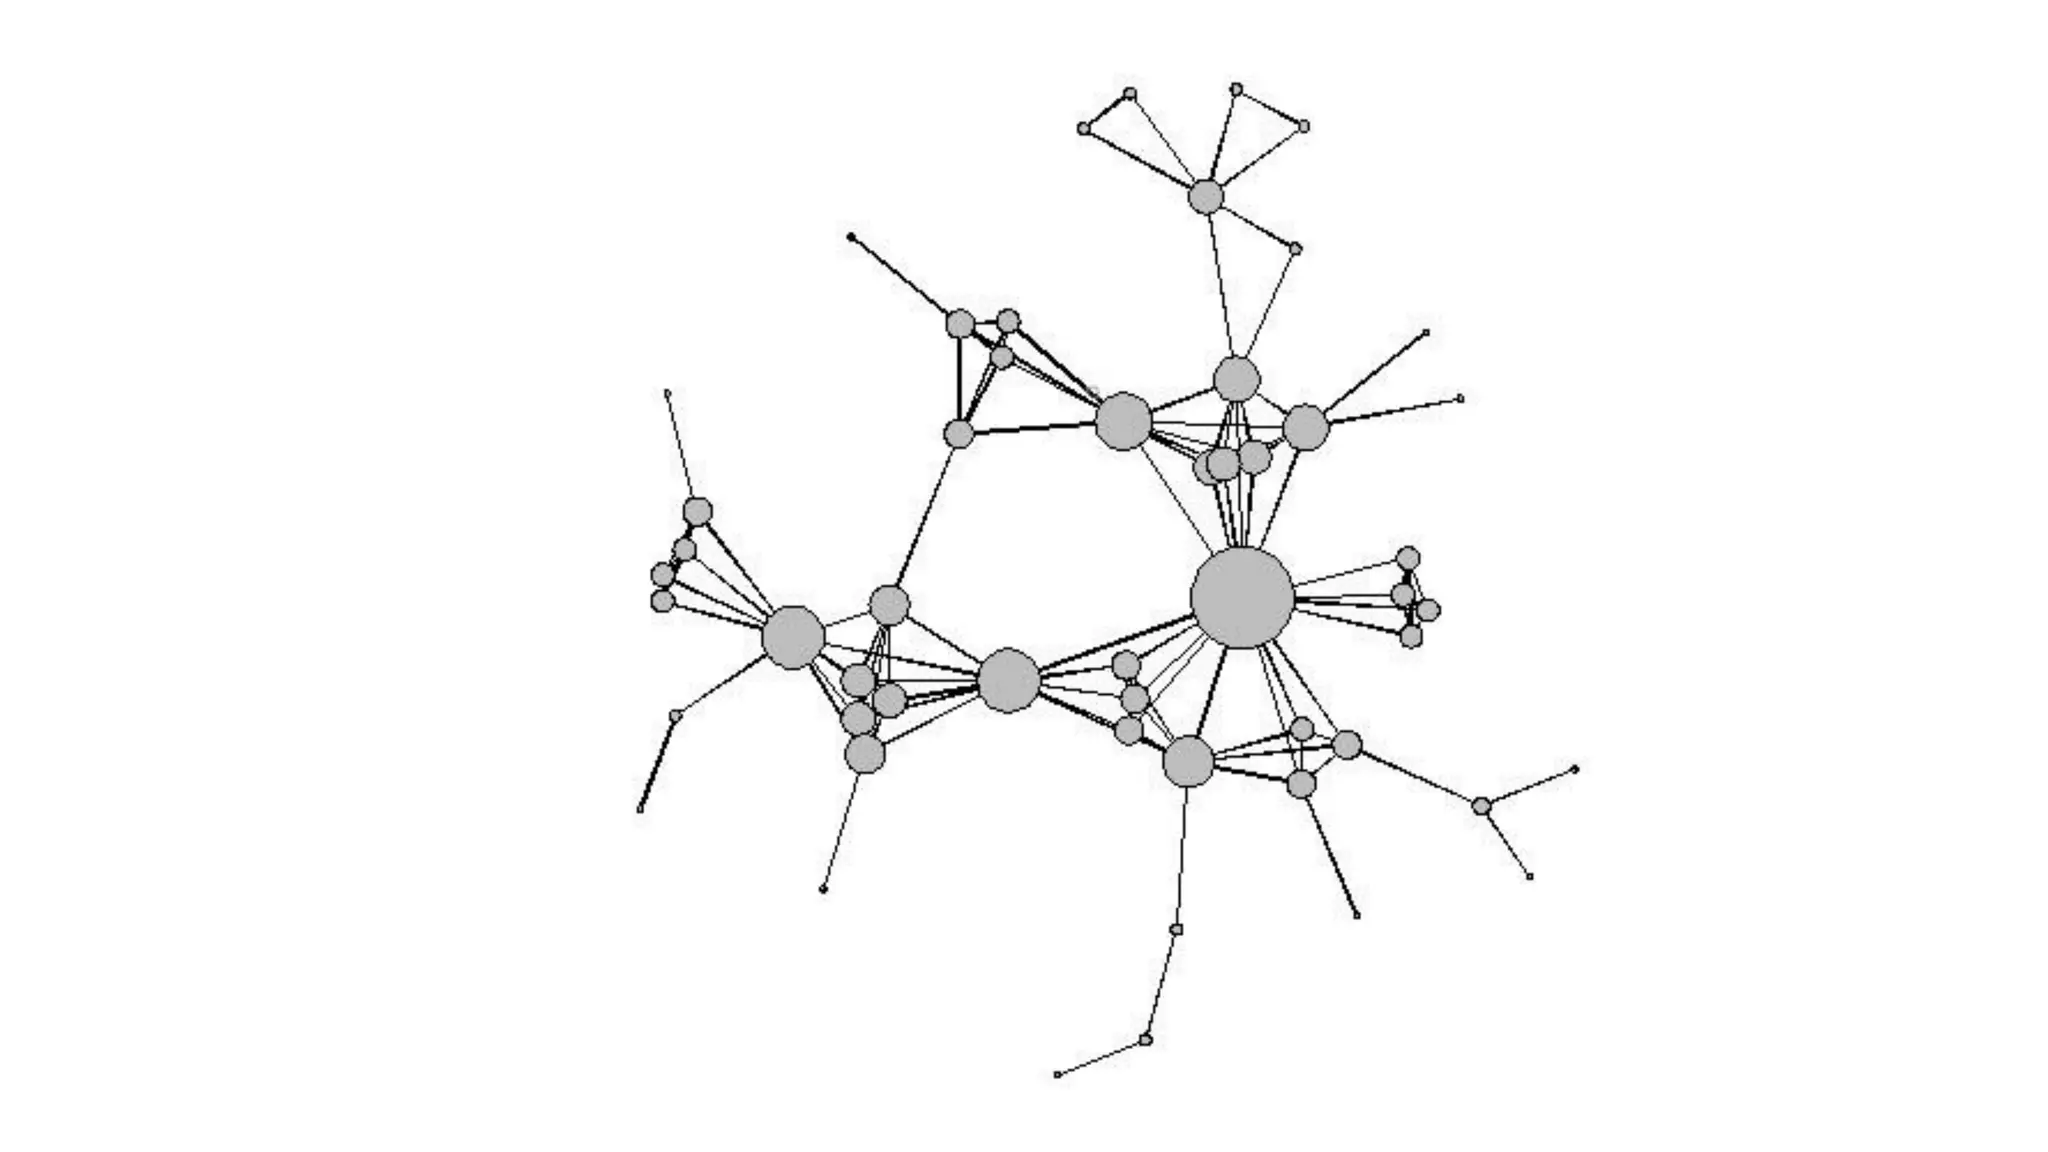
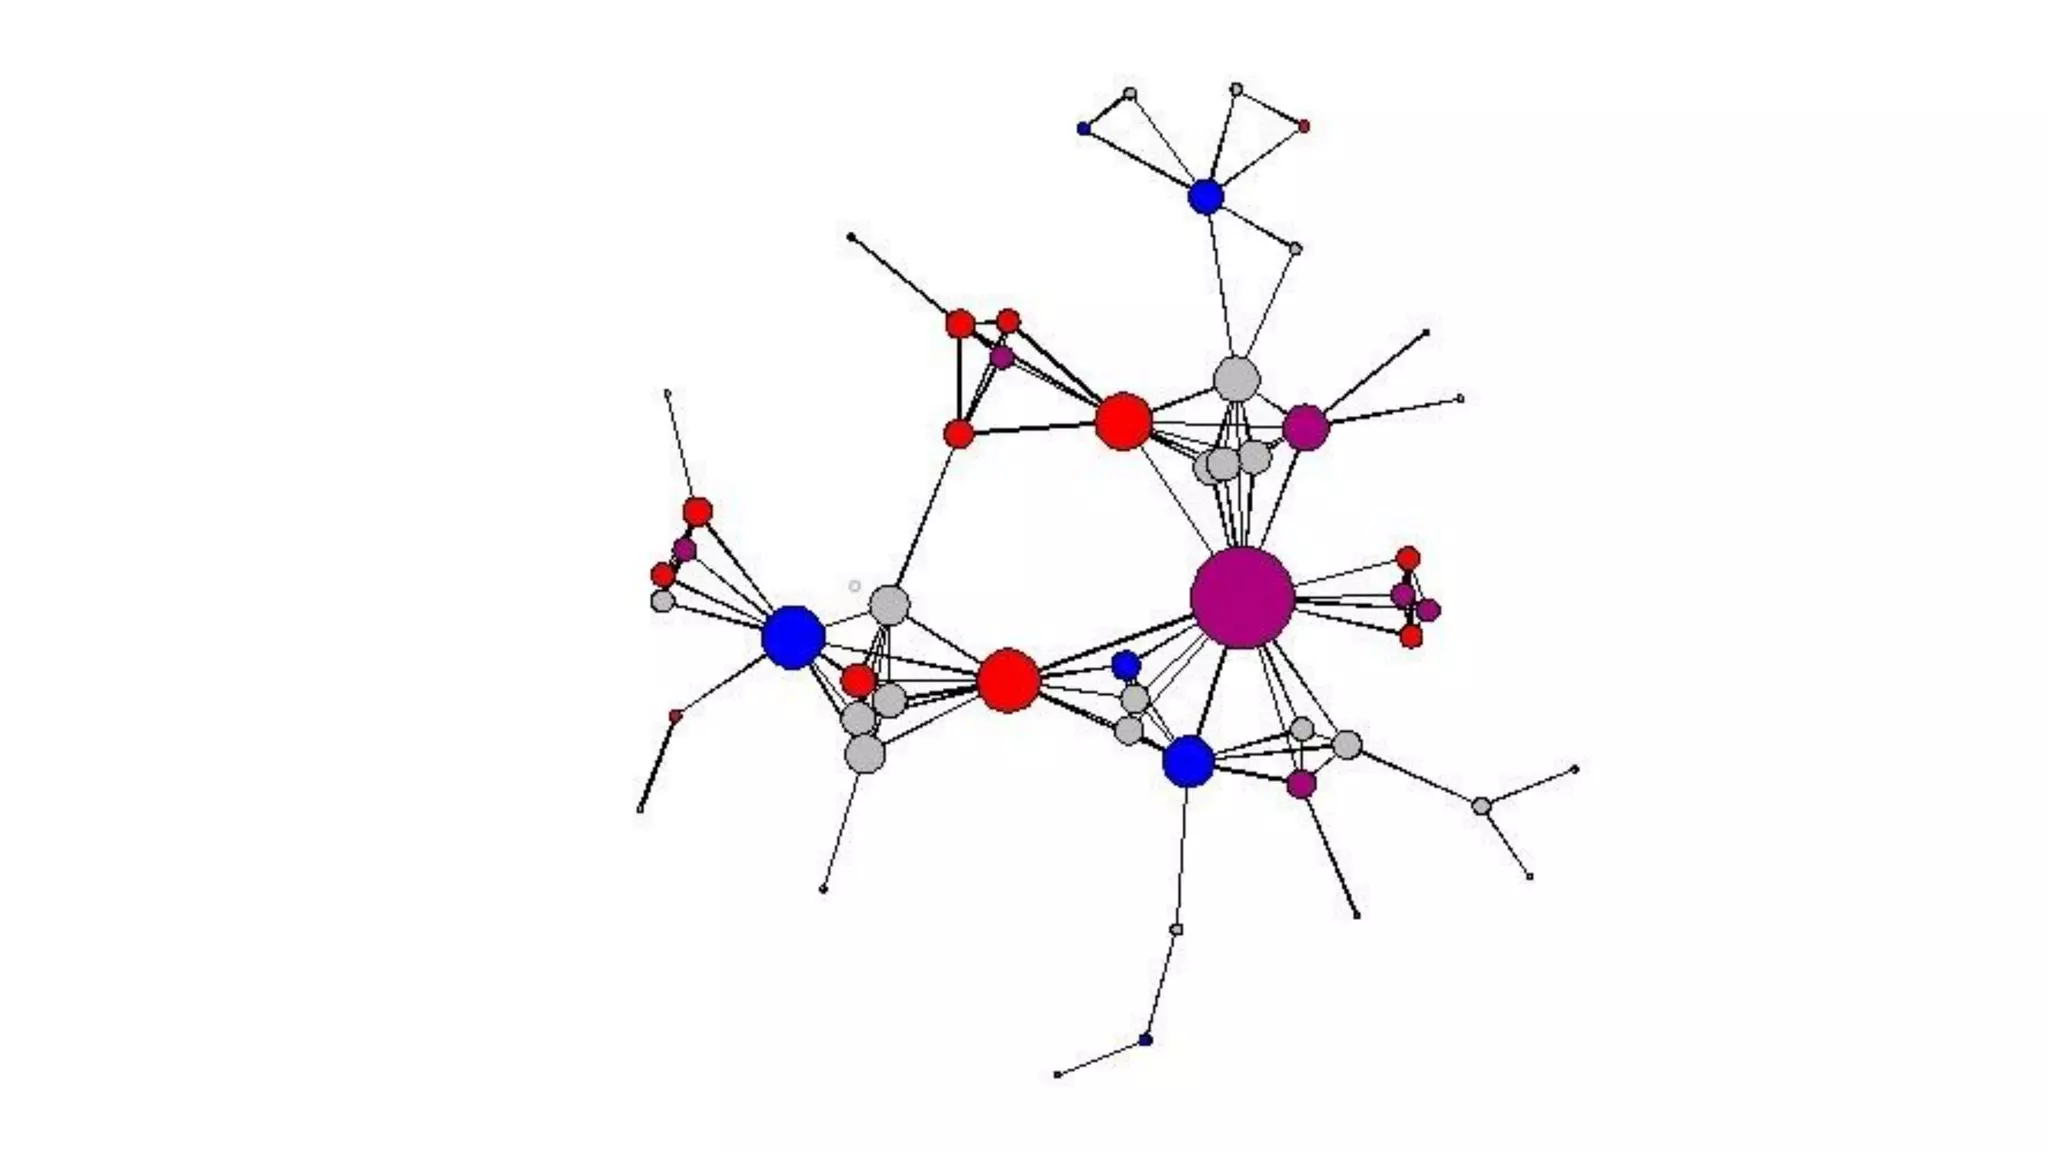
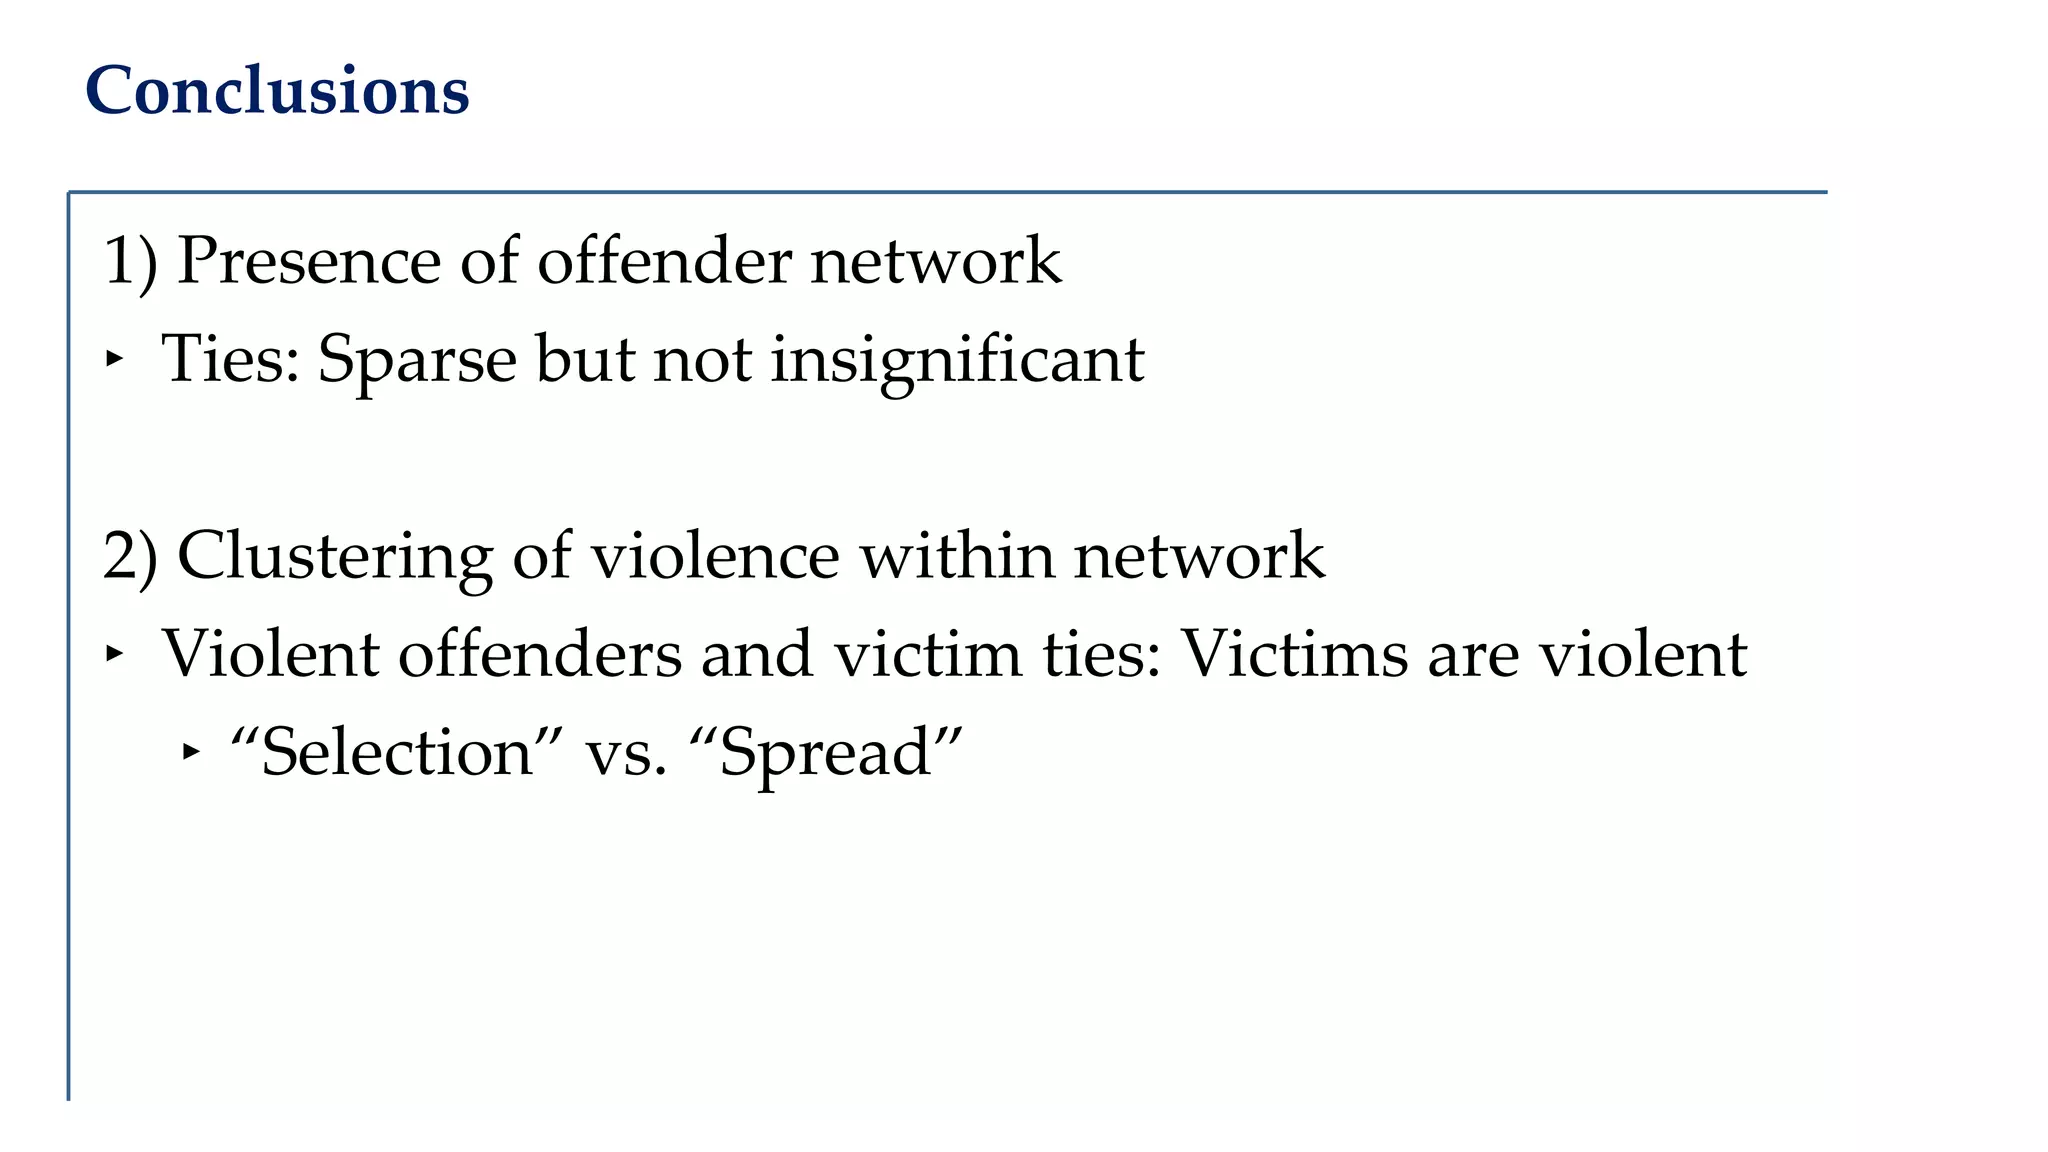
Arrest Networks
and the
Spread of Violent Victimization
DANIEL T. RAGAN
UNIVERSITY OF NEW MEXICO
Other Team Members
Lisa Broidy
University of New Mexico
Brian Soller
University of Maryland, Baltimore County
Background
Violent victimization:
‣ As a health outcome
‣ Not randomly distributed
‣ Importance of social ties
Prior Research
Violent victimization: Predicted by arrest with other victims
‣ Exposure to similar risk factors
Gunshot and homicide victimization
‣ Generalizability to more common types of violence?
Chicago, IL; Boston, MA; Newark, NJ
‣ Generalizability to different geographic locations?
Our Goal: Network Approach to Violent Victimization
Primary data
‣ Law enforcement
Supplementary data
‣ Criminal courts
‣ State criminal history databases
‣ Emergency room visits
‣ U.S. Census
Pilot Project
Violent victimization in criminal networks
‣ Approximately three years of crime-related data
‣ Information on both offenders and victims
‣ Albuquerque, New Mexico
Current Goals
1) What can we learn about violence in criminal networks?
‣ Do offending networks link violent offenders and victims?
2) Assess feasibility of a larger project
‣ Do these data support a network approach?
Data: Overview
‣ Criminal event data
‣ Case numbers
‣ Suspects, arrestees, and victims: Unique identifiers
‣ Approximately three years of coverage
‣ 2011 into 2014
‣ Albuquerque, New Mexico
Albuquerque
‣ Population size
‣ Mobility
‣ City borders & Law enforcement jurisdiction
Data at a Glance: Cases
Records (case/person combination): 155,906
‣ Cases: 120,675
‣ Single offender: 45,348
‣ Multiple offenders: 4,150
Data at a Glance: People
Unique person identifiers: 120,345
‣ Offenders (suspects/arrestees): 40,858
‣ Multiple cases: 8,441
‣ Victims: 86,677
‣ Both offender and victim: 7,190
Violent Offenses: Examples
Battery/Aggravated battery/Aggravated assault
‣ 8,946 cases
Robbery/Commercial armed robbery/Auto car jacking
‣ 552 cases
Forcible rape/Attempted rape/Sexual assault with an object
‣ 490 cases
Murder and nonnegligent manslaughter/Justifiable homicide
‣ 83 cases
Building the Network
Offenders: Linked through crimes
‣ One-mode projection from two-mode data
‣ Assumption: Co-offending signifies social connection
‣ Case removal: > 10 offenders
‣ Case removal: Individual is both offender and victim
‣ Time dimension collapsed: Cross-sectional
Offender Network: Offenders
Offenders: 40,499
‣ Isolates: 32,637
‣ Connected offenders: 7,862
Offender Network: Ties
Ties: 5,990
‣ Average ties: 0.30
‣ Average ties, excluding isolates: 1.52
‣ Degree distribution:
1 2 3 4 5 6 7 8 - 18
5,476 1,444 534 219 81 67 27 14
Offender Network: Groups
Components, excluding isolates: 3,151
• Average component size, excluding isolates: 2.50
• Component distribution:
2 3 4 5 6 7 8 9 - 53
2,364 488 151 54 34 22 18 20
How are different offender-types connected?
Do victims of violence have ties to violent offenders?
‣ Do links within offending network suggest “spread”?
How are different offender-types connected?
Non-victim Victim
Non-violent
offender
Non-violent offender,
non-victim1
Non-violent offender,
victim3
Violent offender Violent offender,
non-victim2
Violent offender,
victim4
Non-violent offender,
non-victim1
Violent offender,
non-victim2
Non-violent offender,
victim3
Violent offender,
victim4
Non-violent offender,
non-victim1
001001 001102 001013 001114
Violent offender,
non-victim2
102001 102102 102013 102114
Non-violent offender,
victim3
013001 013102 013013 013114
Violent offender,
victim4
114001 114102 114013 114114
Non-violent offender,
non-victim1
Violent offender,
non-victim2
Non-violent offender,
victim3
Violent offender,
victim4
Non-violent offender,
non-victim1
0
Violent offender,
non-victim2
0 0
Non-violent offender,
victim3
0 013102 0
Violent offender,
victim4
0 114102 114013 114114
Exponential Random Graph Models
Y: Random variable for state of network
g(y): Vector of network statistics for model
𝜃: Vector of parameters
k: Normalizing constant
Conditional log-odds of a single tie between two actors:
𝑝 𝑌 = 𝑦 =
𝑒𝑥𝑝(𝜃′
𝑔 𝑦 )
𝑘 𝜃
𝑙𝑜𝑔𝑖𝑡(𝑌𝑖𝑗 = 1|𝑦𝑖𝑗
𝑐
) = 𝜃′𝛿(𝑦𝑖𝑗)
Exponential Random Graph Models
Parameter Estimate Std. Error
Edges -9.891*** 0.032
Isolates 1.695*** 0.027
Actor covariate: Number offenses 0.159*** 0.004
Attributes mixes: Offender type
Non-violent offender, victim3
x Violent offender, victim4 0.205 0.147
Violent offender, non-victim2
x Non-violent offender, victim3 -0.626*** 0.111
Violent offender, non-victim2
x Violent offender, victim4 0.617*** 0.070
Violent offender, victim4
x Violent offender, victim4 1.138*** 0.146
Non-violent offender,
non-victim1
Violent offender,
non-victim2
Non-violent offender,
victim3
Violent offender,
victim4
Non-violent offender,
non-victim1
0
Violent offender,
non-victim2
0 0
Non-violent offender,
victim3
0 — 0
Violent offender,
victim4
0 + n.s. +
Conclusions
1) Presence of offender network
‣ Ties: Sparse but not insignificant
2) Clustering of violence within network
‣ Violent offenders and victim ties: Victims are violent
‣ “Selection” vs. “Spread”
Next Steps
1) Continuing work: ERGMs
‣ Model specification & Goodness of fit
2) Pilot project: Future directions
‣ Projection of crime network
3) Larger project feasibility
‣ Current mood: “Cautiously optimistic”

00 Arrest Networks and the Spread of Violent Victimization

  • 1.
    Arrest Networks and the Spreadof Violent Victimization DANIEL T. RAGAN UNIVERSITY OF NEW MEXICO
  • 2.
    Other Team Members LisaBroidy University of New Mexico Brian Soller University of Maryland, Baltimore County
  • 3.
    Background Violent victimization: ‣ Asa health outcome ‣ Not randomly distributed ‣ Importance of social ties
  • 4.
    Prior Research Violent victimization:Predicted by arrest with other victims ‣ Exposure to similar risk factors Gunshot and homicide victimization ‣ Generalizability to more common types of violence? Chicago, IL; Boston, MA; Newark, NJ ‣ Generalizability to different geographic locations?
  • 5.
    Our Goal: NetworkApproach to Violent Victimization Primary data ‣ Law enforcement Supplementary data ‣ Criminal courts ‣ State criminal history databases ‣ Emergency room visits ‣ U.S. Census
  • 6.
    Pilot Project Violent victimizationin criminal networks ‣ Approximately three years of crime-related data ‣ Information on both offenders and victims ‣ Albuquerque, New Mexico
  • 7.
    Current Goals 1) Whatcan we learn about violence in criminal networks? ‣ Do offending networks link violent offenders and victims? 2) Assess feasibility of a larger project ‣ Do these data support a network approach?
  • 8.
    Data: Overview ‣ Criminalevent data ‣ Case numbers ‣ Suspects, arrestees, and victims: Unique identifiers ‣ Approximately three years of coverage ‣ 2011 into 2014 ‣ Albuquerque, New Mexico
  • 9.
    Albuquerque ‣ Population size ‣Mobility ‣ City borders & Law enforcement jurisdiction
  • 12.
    Data at aGlance: Cases Records (case/person combination): 155,906 ‣ Cases: 120,675 ‣ Single offender: 45,348 ‣ Multiple offenders: 4,150
  • 13.
    Data at aGlance: People Unique person identifiers: 120,345 ‣ Offenders (suspects/arrestees): 40,858 ‣ Multiple cases: 8,441 ‣ Victims: 86,677 ‣ Both offender and victim: 7,190
  • 14.
    Violent Offenses: Examples Battery/Aggravatedbattery/Aggravated assault ‣ 8,946 cases Robbery/Commercial armed robbery/Auto car jacking ‣ 552 cases Forcible rape/Attempted rape/Sexual assault with an object ‣ 490 cases Murder and nonnegligent manslaughter/Justifiable homicide ‣ 83 cases
  • 15.
    Building the Network Offenders:Linked through crimes ‣ One-mode projection from two-mode data ‣ Assumption: Co-offending signifies social connection ‣ Case removal: > 10 offenders ‣ Case removal: Individual is both offender and victim ‣ Time dimension collapsed: Cross-sectional
  • 16.
    Offender Network: Offenders Offenders:40,499 ‣ Isolates: 32,637 ‣ Connected offenders: 7,862
  • 17.
    Offender Network: Ties Ties:5,990 ‣ Average ties: 0.30 ‣ Average ties, excluding isolates: 1.52 ‣ Degree distribution: 1 2 3 4 5 6 7 8 - 18 5,476 1,444 534 219 81 67 27 14
  • 18.
    Offender Network: Groups Components,excluding isolates: 3,151 • Average component size, excluding isolates: 2.50 • Component distribution: 2 3 4 5 6 7 8 9 - 53 2,364 488 151 54 34 22 18 20
  • 20.
    How are differentoffender-types connected? Do victims of violence have ties to violent offenders? ‣ Do links within offending network suggest “spread”?
  • 21.
    How are differentoffender-types connected? Non-victim Victim Non-violent offender Non-violent offender, non-victim1 Non-violent offender, victim3 Violent offender Violent offender, non-victim2 Violent offender, victim4
  • 22.
    Non-violent offender, non-victim1 Violent offender, non-victim2 Non-violentoffender, victim3 Violent offender, victim4 Non-violent offender, non-victim1 001001 001102 001013 001114 Violent offender, non-victim2 102001 102102 102013 102114 Non-violent offender, victim3 013001 013102 013013 013114 Violent offender, victim4 114001 114102 114013 114114
  • 23.
    Non-violent offender, non-victim1 Violent offender, non-victim2 Non-violentoffender, victim3 Violent offender, victim4 Non-violent offender, non-victim1 0 Violent offender, non-victim2 0 0 Non-violent offender, victim3 0 013102 0 Violent offender, victim4 0 114102 114013 114114
  • 26.
    Exponential Random GraphModels Y: Random variable for state of network g(y): Vector of network statistics for model 𝜃: Vector of parameters k: Normalizing constant Conditional log-odds of a single tie between two actors: 𝑝 𝑌 = 𝑦 = 𝑒𝑥𝑝(𝜃′ 𝑔 𝑦 ) 𝑘 𝜃 𝑙𝑜𝑔𝑖𝑡(𝑌𝑖𝑗 = 1|𝑦𝑖𝑗 𝑐 ) = 𝜃′𝛿(𝑦𝑖𝑗)
  • 27.
    Exponential Random GraphModels Parameter Estimate Std. Error Edges -9.891*** 0.032 Isolates 1.695*** 0.027 Actor covariate: Number offenses 0.159*** 0.004 Attributes mixes: Offender type Non-violent offender, victim3 x Violent offender, victim4 0.205 0.147 Violent offender, non-victim2 x Non-violent offender, victim3 -0.626*** 0.111 Violent offender, non-victim2 x Violent offender, victim4 0.617*** 0.070 Violent offender, victim4 x Violent offender, victim4 1.138*** 0.146
  • 28.
    Non-violent offender, non-victim1 Violent offender, non-victim2 Non-violentoffender, victim3 Violent offender, victim4 Non-violent offender, non-victim1 0 Violent offender, non-victim2 0 0 Non-violent offender, victim3 0 — 0 Violent offender, victim4 0 + n.s. +
  • 29.
    Conclusions 1) Presence ofoffender network ‣ Ties: Sparse but not insignificant 2) Clustering of violence within network ‣ Violent offenders and victim ties: Victims are violent ‣ “Selection” vs. “Spread”
  • 30.
    Next Steps 1) Continuingwork: ERGMs ‣ Model specification & Goodness of fit 2) Pilot project: Future directions ‣ Projection of crime network 3) Larger project feasibility ‣ Current mood: “Cautiously optimistic”