Download to read offline


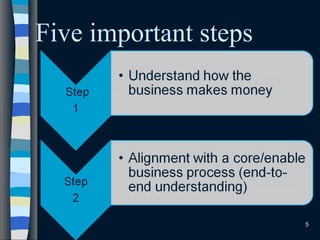


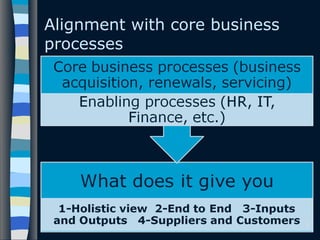
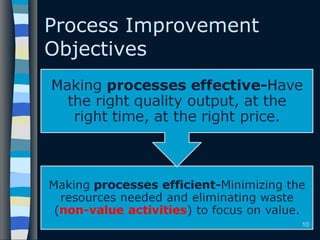
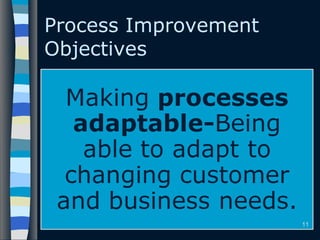


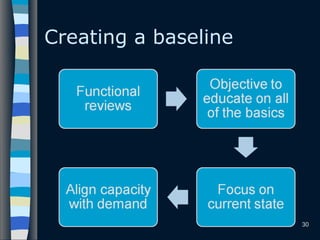
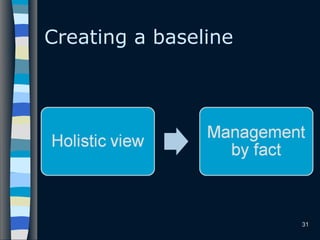
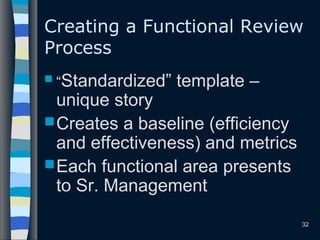
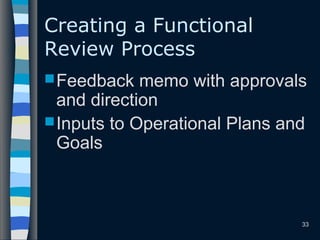

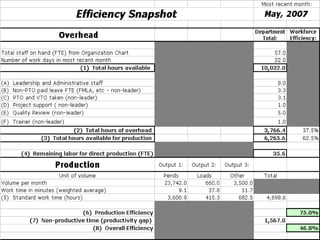
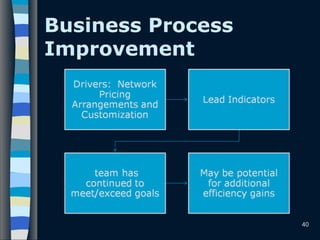
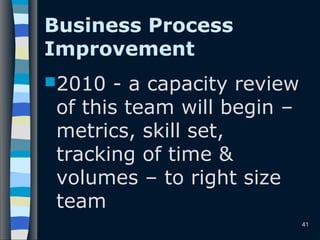


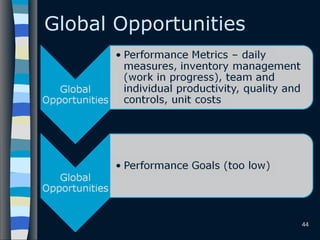
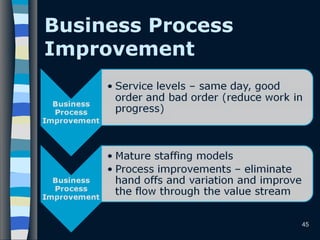
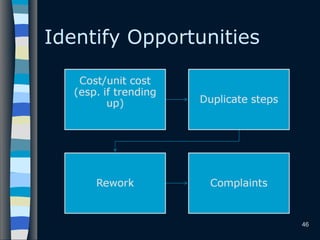
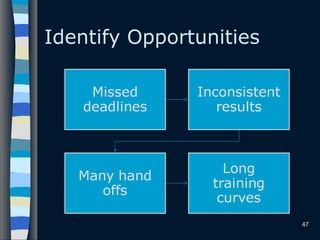

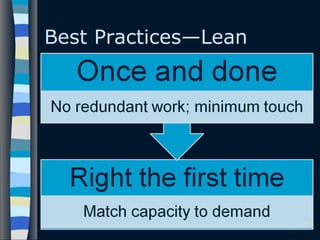
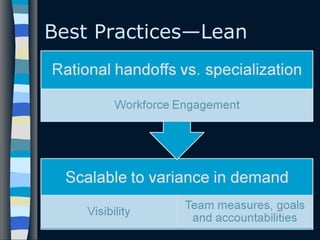

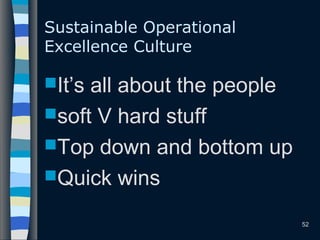
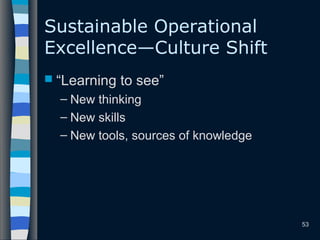
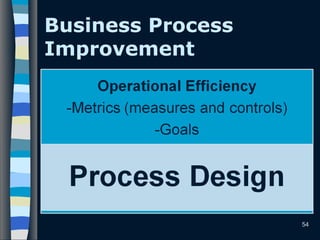
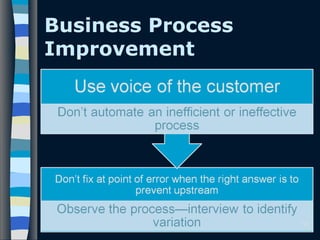

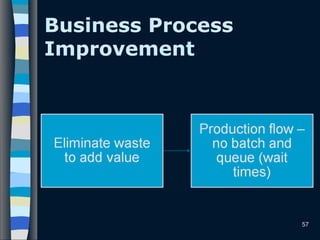


This document discusses business process improvement as a strategy for productivity and competitiveness. It outlines key steps in business process improvement including understanding how the business makes money, aligning processes with business objectives, creating baselines to measure current performance, identifying opportunities for improvement, and emphasizing a culture of continuous learning and engagement. The ultimate goals of business process improvement are to enable better decision making, improve operations, enhance production flow, and drive sustainable excellence.