Downloaded 3,704 times

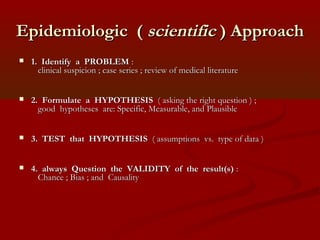
![Epidemiology is...
"The science of long division....
I'=[(480)(log2)(10E6)]/[(9.1)(0.955po)
+0.45n]"
Statistician](https://image.slidesharecdn.com/de-101104083656-phpapp01/85/DESCRIPTIVE-EPIDEMIOLOGY-6-320.jpg)
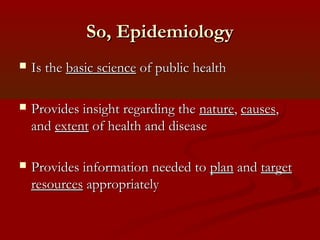
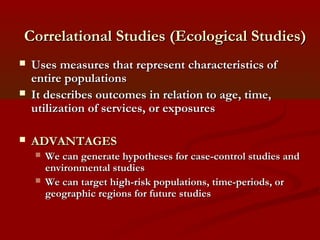
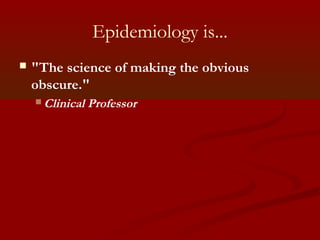
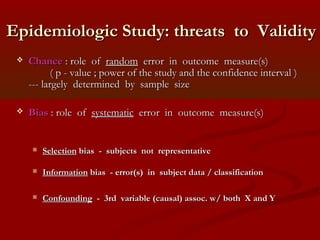
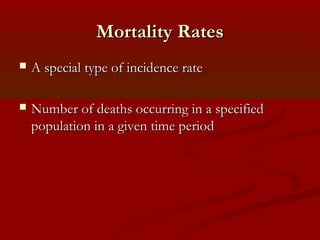
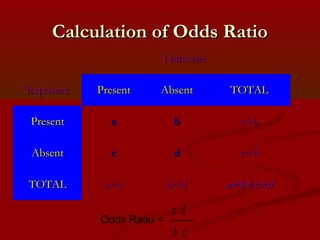
![Patterns of disease Occurrence :Patterns of disease Occurrence :
CorrelationCorrelation ofof PopulationPopulation statisticsstatistics
EcologicEcologic (( correlationcorrelation ) studies) studies
Used as first step in determining associationUsed as first step in determining association
plotplot :: disease (population) burden [ Y axis ]disease (population) burden [ Y axis ]
vs.vs. prevalence of “risk factor” [ X axis ]prevalence of “risk factor” [ X axis ]
e.g. smoking vs. lung cancere.g. smoking vs. lung cancer
-- correlation coefficient : r ; + 1 to -1-- correlation coefficient : r ; + 1 to -1
Quantifies linear relationship between exposure & diseaseQuantifies linear relationship between exposure & disease](https://image.slidesharecdn.com/de-101104083656-phpapp01/85/DESCRIPTIVE-EPIDEMIOLOGY-22-320.jpg)
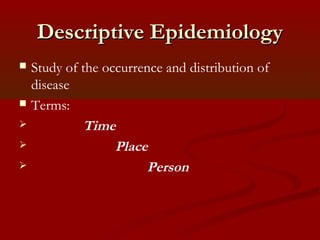
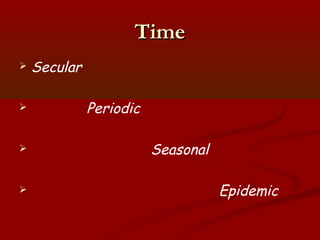
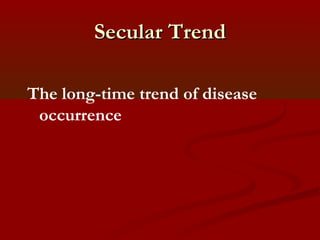
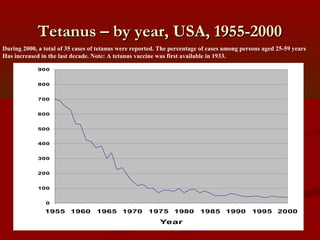
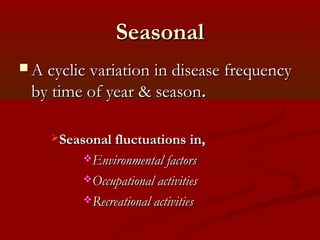
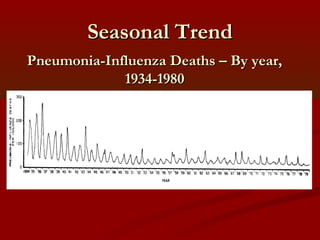
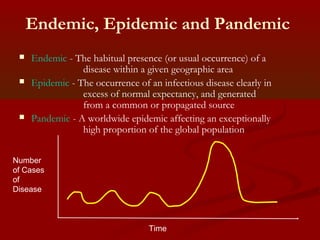
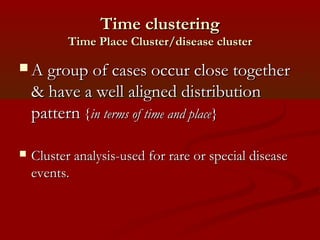
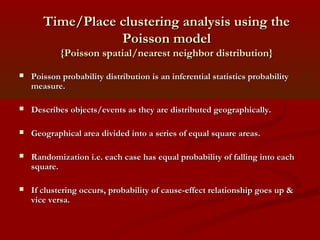
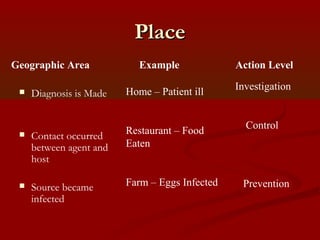
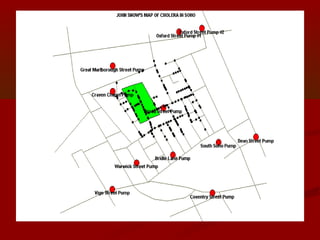
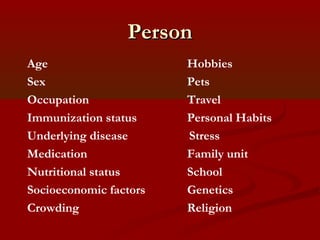
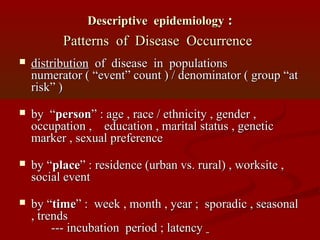

The document discusses descriptive epidemiology and provides definitions and examples. Descriptive epidemiology studies the occurrence and distribution of disease. It describes the who, where, and when of diseases. Key terms discussed include: - Time trends which can be secular (long-term), periodic (interruptions to secular trends), or seasonal (cyclical yearly variations). - Place patterns looking at geographic distributions of disease. - Person characteristics of those affected such as age, sex, occupation. Descriptive studies are the first step in understanding diseases and include case reports, case series, and cross-sectional prevalence studies.