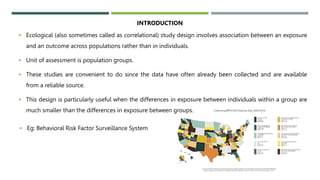
Seminar no: 7
CONTENTS
 Introduction
 Types of ecological studies
 Types of measurement in ecological studies
 Classification of ecological data
 Analysis of ecological data
 Uses of ecologic studies
 Limitations of ecologic studies
 Summary
Source: Ballini A, Capodiferro S, Toia M, Cantore S, Favia G, De Frenza G, Grassi FR. Evidence-based dentistry: what's new?. International journal of
medical sciences. 2007;4(3):174.
 Ecological (also sometimes called as correlational) study design involves association between an exposure
and an outcome across populations rather than in individuals.
 Unit of assessment is population groups.
 These studies are convenient to do since the data have often already been collected and are available
from a reliable source.
 This design is particularly useful when the differences in exposure between individuals within a group are
much smaller than the differences in exposure between groups.
INTRODUCTION
 Eg: Behavioral Risk Factor Surveillance System
 Ecological studies are often used to measure prevalence and incidence of disease, particularly when
disease is rare.
 They are inexpensive and easy to carry out, using routinely collected data, but they are prone to bias.
 Also, because they are area-level studies, care must be taken when extrapolating either to individuals
within the area level of measurement, or to a higher population level.
 Although other study designs are generally considered more reliable, particularly in the inference of
causation, the population context of individual characteristics has been shown to be a stronger
determinant of disease at population level than individual level risk factors.
 Geographical; This type of study compares one geography with another by assessing the health
of the population of each. Exposures for geographies may also be measured and included in
analysis as well as other potential confounding variables such as demographic and socioeconomic
information.
 Longitudinal; A population is monitored to assess changes in disease over time. Again,
confounding factors are often included in analysis.
 Migration; Data of migrant populations are collected and analysed. The unit of interest is neither
time nor place, but population type.
TYPES OF ECOLOGICAL STUDIES
In ecological studies health outcomes are aggregates of individual health data, eg: prevalence,
incidence, rate of disease. Ecological risk or exposure data takes the form of one or more of the
following:
 Aggregate measures; the data are summaries of individual level data eg, mean dmft, percentage of
children with no caries, area-level deprivation indices
 Environmental measures; equivalent individual level data are conceivable eg, mean annual
exposure to fluoridation
 Global measures; there are no equivalent individual level data eg, number of dental practices,
population density.
TYPES OF MEASUREMENT IN ECOLOGICAL STUDIES
Ecologic study designs may be classified on two dimensions:
A. the method of exposure measurement, and
B. the method of grouping
A. Regarding the First dimension (Exposure measurement)
• An ecologic design is called “Exploratory”, if there is no specific exposure of interest or the
exposure of potential interest is not measured
• An ecologic design is called “Etiologic”, if the primary exposure variable is measured and
included in the analysis
B. Regarding the Second dimension (Grouping)
The groups of an ecologic study may be identified by;
i. Place (Multiple-group design)
ii. Time (Time-trend design)
iii. Combination of Place and Time (Mixed design)
Place or Multiple Group
Design
a.a. Exploratory study a.b. Etiologic study
i. Place or Multiple Group Design
b. Etiologic Study (Etiologic multiple design):
• Assessment of the ecologic association between the average exposure level or prevalence and the rate
of disease among many groups
• This ecological design is the most common;
• The unit of analysis is a geopolitical region
a. Exploratory Study (Exploratory multiple design):
Comparison of rate of disease among many regions during the same period. Purpose is to search for
spatial patterns that might suggest an environmental etiology or more specific etiological hypothesis
The relation between male obesity and income inequality in 21 rich countries. The relation between female obesity and income inequality in 21 rich
countries.
Example:
Time or Time Trend
Design
a.a. Exploratory study a.b. Etiologic study
ii. Time or Time Trend Design:
a. Exploratory Study (Exploratory Time Trend or Time Series):
Involves a comparison of the disease rates over time in one geographically defined population. In addition
to providing graphical displays of temporal trends, time series data can also be used to forecast future
rates and trends.
• The special type of Exploratory Time Trend Analysis that is often used by Epidemiologist is ‘Age-Period-
Cohort analysis’ or simply ‘Cohort analysis’
• This approach typically involves the collection of retrospective data from a large population over the
period of 20 or more years
• Through graphical or tabular displays, the objective is to estimate the separate effect of three time-
related variables on the rate of disease;
o Age
o Period (Calendar time), and,
o Birth Cohort (Year of birth)
• By describing the occurrence of disease in this way, the investigator attempts to gain insight about
temporal trends, which might lead to new hypotheses
b. Etiologic Study (Etiologic Time Trend):
• Assessment of the ecologic association between change in average exposure level or prevalence and
change in disease rate in one geographically defined populations
• As with exploratory design, this type of assessment can be done by simple graphical displays or by
time-series regression modeling
iii. Combination of Place and Time or Mixed Design:
Combination of Place and
Time or Mixed Design
a.a. Exploratory study a.b. Etiologic study
a. Exploratory Study (Exploratory Mixed Design):
• Combines the basic features of the exploratory multiple- group study and the exploratory time-
trend study
• Time-series or age-period-cohort analysis can be used to describe or predict trends in the disease
rate for multiple populations
b. Etiologic Study (Etiologic Mixed Design):
• Assessment of the association between change in average exposure level or prevalence and
change in disease rate among many groups
• Thus, the interpretation of estimated effect is enhanced because two type of comparisons are
made simultaneously;
o Change over time within groups, and,
o Difference among groups
An ecological study design is used when;
 the purpose of the study is to monitor population health so that public health strategies may be
developed and directed;
 the purpose of the study is to make large-scale comparisons, eg, comparisons between countries;
 the purpose of the study is to study the relationship between population-level exposure to risk
factors and disease, or in order to look at the contextual effect of risk factors on the population;
 measurements at individual level are not available, eg. confidentiality might require that individuals
are anonymized by aggregation of data to small area level; or
 the disease under investigation is rare, requiring aggregation of data for any analysis to be carried
out.
USES OF ECOLOGIC STUDIES
 First, an association between exposure and outcome at the group level may not be true at the
individual level (a phenomenon also referred to as “ecological fallacy”).
 Second, the association may be related to a third factor which in turn is related to both the
exposure and the outcome, the so-called “confounding”.
 Third, migration of people between regions with different exposure levels may also introduce an
error.
 A fourth consideration may be the use of differing definitions for exposure, outcome or both in
different populations.
LIMITATIONS OF ECOLOGIC STUDIES
 As with all observational studies, in order to overcome confounding, regression analysis is advisable.
 Multilevel modelling techniques have been developed, where analysis includes both individual and
population level data, thus overcoming the ecological fallacy and enabling examination of contextual
effects.
 Dental data are suited to multilevel modelling due to the clustered nature of disease, within surfaces,
teeth, individuals, as well as group clusters such as schools, dental practices and geographical areas.
 Where individual level data are not known, for example where data are only available in an
aggregated form, care must be taken in making causal inferences due to aggregation bias and the
ecological fallacy.
ANALYSIS OF ECOLOGICAL DATA
DIFFERENCES BETWEEN ECOLOGICAL, CROSS- SECTIONAL AND COHORT STUDIES
Directionality Non- Directional Always forward Non or backward
Used when
Establishing association
in summary statistics
Exposure rare, outcome
frequent, retrospective
for rare disease, long
induction
Outcome and exposure
frequent, study factor not
changing over time ,
incidence can be
established elsewhere
Features Ecological Cohort Cross-Sectional
Study type Descriptive Observational Observational
Features Aggregate measures
Exposure or non
exposure known for all
participants
Outcome and study
factor studies
simultaneously
Sampling
None- measures entire
population
Eg: countries
Diverse, Large
Ideally a random sample
of target population
DIFFERENCES BETWEEN ECOLOGICAL, CROSS- SECTIONAL AND COHORT STUDIES
Problems/ Bias
Ecological fallacy
Information bias
Loss of participants
Selection bias-dropouts
Information bias-
Recall bias
(retrospective)
Cannot use for rare
outcome and diseases
with short durations
Selection bias
Information bias-
Recall bias
Cost Low, if data available
High and time
consuming
Low
Features Ecological Cohort Cross-Sectional
Determining
the causality
Not possible Possible Not possible
Strength of
study
Low (as not at
individual level)
Most powerful
observational study
Weakest observational
study but useful for
prevalence
An ecological study correlated per capita alcohol consumption to death rates from coronary heart
disease (CHD) in different countries, and it appeared that there was a fairly striking negative correlation
as shown in the graph below.
Example:
However, a cohort study with data on alcohol consumption in individual subjects showed that there was a
J-shaped relationship. People who drank modestly had a lower mortality rates than those who did not
drink at all, but among higher levels of individual consumption there was a striking linear increase in
mortality, as shown in the graph below.
Source: Adapted from AR Dyer et al. Alcohol consumption and 17-year mortality in the Chicago Western Electric Company Study. Prev. Med. 1980;
9(1):78-90.
The misleading conclusion from the ecologic study is an example of the ecologic
Results of an ecological study Results from a cohort study
Example:
• The higher the average chocolate consumption for a
country, the higher the number of Nobel laureates per
capita.
• Switzerland has the highest number of Nobel laureates
per capita and the highest average consumption of
chocolate.
• We do not know whether the individuals who won Nobel
Prize in that country actually had a high chocolate intake.
• Average values of chocolate consumption and the
number of Nobel laureates per capita for each country is
given.
Exposure: Country’s chocolate consumption
Outcome: Number of Nobel Laureates
No account is taken of variability between individuals in that country with regard to chocolate
consumption-- ecologic fallacy (we may be ascribing to members of a group some characteristic that
they in fact do not possess as individuals. )
Exposure: Community Risk Indicators
(CRI)
Outcome: Dental Caries
• For Grades 4-6 (n = 64), age and fs ; dfs ratio were positively associated with caries scores, while
population density, population ; dentist ratio, and years of natural fluoride exposure were negative.
• CRI for both models, when compared to individual models, explained a substantial portion of the
variation in caries prevalence, 31% for Grades K-3 and 51% for Grades 4-6.
• Results suggest that a risk assessment model based on community rather than individual variables is
feasible and further refinement may reveal factors useful in identifying high risk communities.
Example:
• For Grades K-3 (n=108), population density,
parental education, and coastal residence
were negatively associated with caries scores,
while age, and medical and dental Medicaid
expenditures were positive.
Example:
• Representative samples of 11- and 13-
year-old schoolchildren were drawn
from participating countries and
aggregated by the direct age
standardization method.
• The cross-regional variation of DMFT were 26.3%, in the proportion of children who reported regular
toothbrushing.
• Low rates of regular toothbrushing and high rates of sweets consumption were related with higher DMFT
while high rates of drinking of soft drinks were related with lower DMFT. Consumption of fruits and
vegetables had no significant impact. Altogether, factors of this model explained 51.2% of the total DMFT
variation across countries.
• Conclusion: The findings of the study demonstrate that different oral health behaviour profiles among
young people across European countries, Israel, Canada, and the USA significantly contribute to the
Statistical analysis was performed using multiple linear regression.
SUMMARY
• Ecological study is a convenient, cheap and simple study.
• Unit of study is the aggregate data not individual level.
• It is usually conducted as the first step in study for research.
• The result is difficult to interpret because of confounding and bias.
• In contemporary epidemiology, the "ecologic fallacy" reflects the failure of the investigator to
recognize the need for biologic inference and thus for individual-level data.
• Levin KA. Study design VI-ecological studies. Evidence-based dentistry. 2006 Dec;7(4):108.
• Morgenstern H. Ecologic studies in epidemiology: concepts, principles, and methods. Annual
review of public health. 1995 May;16(1):61-81.
• Rothman KJ, Greenland S, Lash TL. Modern epidemiology. Philadelphia: Wolters Kluwer
Health/Lippincott Williams & Wilkins; 2008 Sep 20.
• Celentano, David D.,, M Szklo, and Leon Gordis. Gordis Epidemiology. 6th edition. Philadelphia, PA:
Elsevier, 2019.
• https://sphweb.bumc.bu.edu/otlt/MPH-Modules/PH717-QuantCore/PH717-Module1B-
DescriptiveStudies_and_Statistics/PH717-Module1B-DescriptiveStudies_and_Statistics6.html
• Ballini A, Capodiferro S, Toia M, Cantore S, Favia G, De Frenza G, Grassi FR. Evidence-based
dentistry: what's new?. International journal of medical sciences. 2007;4(3):174.
REFERENCES

ECOLOGICAL STUDY

  • 1.
  • 2.
    CONTENTS  Introduction  Typesof ecological studies  Types of measurement in ecological studies  Classification of ecological data  Analysis of ecological data  Uses of ecologic studies  Limitations of ecologic studies  Summary
  • 5.
    Source: Ballini A,Capodiferro S, Toia M, Cantore S, Favia G, De Frenza G, Grassi FR. Evidence-based dentistry: what's new?. International journal of medical sciences. 2007;4(3):174.
  • 6.
     Ecological (alsosometimes called as correlational) study design involves association between an exposure and an outcome across populations rather than in individuals.  Unit of assessment is population groups.  These studies are convenient to do since the data have often already been collected and are available from a reliable source.  This design is particularly useful when the differences in exposure between individuals within a group are much smaller than the differences in exposure between groups. INTRODUCTION  Eg: Behavioral Risk Factor Surveillance System
  • 7.
     Ecological studiesare often used to measure prevalence and incidence of disease, particularly when disease is rare.  They are inexpensive and easy to carry out, using routinely collected data, but they are prone to bias.  Also, because they are area-level studies, care must be taken when extrapolating either to individuals within the area level of measurement, or to a higher population level.  Although other study designs are generally considered more reliable, particularly in the inference of causation, the population context of individual characteristics has been shown to be a stronger determinant of disease at population level than individual level risk factors.
  • 8.
     Geographical; Thistype of study compares one geography with another by assessing the health of the population of each. Exposures for geographies may also be measured and included in analysis as well as other potential confounding variables such as demographic and socioeconomic information.  Longitudinal; A population is monitored to assess changes in disease over time. Again, confounding factors are often included in analysis.  Migration; Data of migrant populations are collected and analysed. The unit of interest is neither time nor place, but population type. TYPES OF ECOLOGICAL STUDIES
  • 9.
    In ecological studieshealth outcomes are aggregates of individual health data, eg: prevalence, incidence, rate of disease. Ecological risk or exposure data takes the form of one or more of the following:  Aggregate measures; the data are summaries of individual level data eg, mean dmft, percentage of children with no caries, area-level deprivation indices  Environmental measures; equivalent individual level data are conceivable eg, mean annual exposure to fluoridation  Global measures; there are no equivalent individual level data eg, number of dental practices, population density. TYPES OF MEASUREMENT IN ECOLOGICAL STUDIES
  • 10.
    Ecologic study designsmay be classified on two dimensions: A. the method of exposure measurement, and B. the method of grouping A. Regarding the First dimension (Exposure measurement) • An ecologic design is called “Exploratory”, if there is no specific exposure of interest or the exposure of potential interest is not measured • An ecologic design is called “Etiologic”, if the primary exposure variable is measured and included in the analysis B. Regarding the Second dimension (Grouping) The groups of an ecologic study may be identified by; i. Place (Multiple-group design) ii. Time (Time-trend design) iii. Combination of Place and Time (Mixed design)
  • 11.
    Place or MultipleGroup Design a.a. Exploratory study a.b. Etiologic study i. Place or Multiple Group Design
  • 12.
    b. Etiologic Study(Etiologic multiple design): • Assessment of the ecologic association between the average exposure level or prevalence and the rate of disease among many groups • This ecological design is the most common; • The unit of analysis is a geopolitical region a. Exploratory Study (Exploratory multiple design): Comparison of rate of disease among many regions during the same period. Purpose is to search for spatial patterns that might suggest an environmental etiology or more specific etiological hypothesis
  • 13.
    The relation betweenmale obesity and income inequality in 21 rich countries. The relation between female obesity and income inequality in 21 rich countries. Example:
  • 14.
    Time or TimeTrend Design a.a. Exploratory study a.b. Etiologic study ii. Time or Time Trend Design:
  • 15.
    a. Exploratory Study(Exploratory Time Trend or Time Series): Involves a comparison of the disease rates over time in one geographically defined population. In addition to providing graphical displays of temporal trends, time series data can also be used to forecast future rates and trends. • The special type of Exploratory Time Trend Analysis that is often used by Epidemiologist is ‘Age-Period- Cohort analysis’ or simply ‘Cohort analysis’ • This approach typically involves the collection of retrospective data from a large population over the period of 20 or more years • Through graphical or tabular displays, the objective is to estimate the separate effect of three time- related variables on the rate of disease; o Age o Period (Calendar time), and, o Birth Cohort (Year of birth) • By describing the occurrence of disease in this way, the investigator attempts to gain insight about temporal trends, which might lead to new hypotheses
  • 16.
    b. Etiologic Study(Etiologic Time Trend): • Assessment of the ecologic association between change in average exposure level or prevalence and change in disease rate in one geographically defined populations • As with exploratory design, this type of assessment can be done by simple graphical displays or by time-series regression modeling
  • 17.
    iii. Combination ofPlace and Time or Mixed Design: Combination of Place and Time or Mixed Design a.a. Exploratory study a.b. Etiologic study
  • 18.
    a. Exploratory Study(Exploratory Mixed Design): • Combines the basic features of the exploratory multiple- group study and the exploratory time- trend study • Time-series or age-period-cohort analysis can be used to describe or predict trends in the disease rate for multiple populations b. Etiologic Study (Etiologic Mixed Design): • Assessment of the association between change in average exposure level or prevalence and change in disease rate among many groups • Thus, the interpretation of estimated effect is enhanced because two type of comparisons are made simultaneously; o Change over time within groups, and, o Difference among groups
  • 19.
    An ecological studydesign is used when;  the purpose of the study is to monitor population health so that public health strategies may be developed and directed;  the purpose of the study is to make large-scale comparisons, eg, comparisons between countries;  the purpose of the study is to study the relationship between population-level exposure to risk factors and disease, or in order to look at the contextual effect of risk factors on the population;  measurements at individual level are not available, eg. confidentiality might require that individuals are anonymized by aggregation of data to small area level; or  the disease under investigation is rare, requiring aggregation of data for any analysis to be carried out. USES OF ECOLOGIC STUDIES
  • 20.
     First, anassociation between exposure and outcome at the group level may not be true at the individual level (a phenomenon also referred to as “ecological fallacy”).  Second, the association may be related to a third factor which in turn is related to both the exposure and the outcome, the so-called “confounding”.  Third, migration of people between regions with different exposure levels may also introduce an error.  A fourth consideration may be the use of differing definitions for exposure, outcome or both in different populations. LIMITATIONS OF ECOLOGIC STUDIES
  • 21.
     As withall observational studies, in order to overcome confounding, regression analysis is advisable.  Multilevel modelling techniques have been developed, where analysis includes both individual and population level data, thus overcoming the ecological fallacy and enabling examination of contextual effects.  Dental data are suited to multilevel modelling due to the clustered nature of disease, within surfaces, teeth, individuals, as well as group clusters such as schools, dental practices and geographical areas.  Where individual level data are not known, for example where data are only available in an aggregated form, care must be taken in making causal inferences due to aggregation bias and the ecological fallacy. ANALYSIS OF ECOLOGICAL DATA
  • 22.
    DIFFERENCES BETWEEN ECOLOGICAL,CROSS- SECTIONAL AND COHORT STUDIES Directionality Non- Directional Always forward Non or backward Used when Establishing association in summary statistics Exposure rare, outcome frequent, retrospective for rare disease, long induction Outcome and exposure frequent, study factor not changing over time , incidence can be established elsewhere Features Ecological Cohort Cross-Sectional Study type Descriptive Observational Observational Features Aggregate measures Exposure or non exposure known for all participants Outcome and study factor studies simultaneously Sampling None- measures entire population Eg: countries Diverse, Large Ideally a random sample of target population
  • 23.
    DIFFERENCES BETWEEN ECOLOGICAL,CROSS- SECTIONAL AND COHORT STUDIES Problems/ Bias Ecological fallacy Information bias Loss of participants Selection bias-dropouts Information bias- Recall bias (retrospective) Cannot use for rare outcome and diseases with short durations Selection bias Information bias- Recall bias Cost Low, if data available High and time consuming Low Features Ecological Cohort Cross-Sectional Determining the causality Not possible Possible Not possible Strength of study Low (as not at individual level) Most powerful observational study Weakest observational study but useful for prevalence
  • 24.
    An ecological studycorrelated per capita alcohol consumption to death rates from coronary heart disease (CHD) in different countries, and it appeared that there was a fairly striking negative correlation as shown in the graph below. Example:
  • 25.
    However, a cohortstudy with data on alcohol consumption in individual subjects showed that there was a J-shaped relationship. People who drank modestly had a lower mortality rates than those who did not drink at all, but among higher levels of individual consumption there was a striking linear increase in mortality, as shown in the graph below. Source: Adapted from AR Dyer et al. Alcohol consumption and 17-year mortality in the Chicago Western Electric Company Study. Prev. Med. 1980; 9(1):78-90. The misleading conclusion from the ecologic study is an example of the ecologic Results of an ecological study Results from a cohort study
  • 26.
    Example: • The higherthe average chocolate consumption for a country, the higher the number of Nobel laureates per capita. • Switzerland has the highest number of Nobel laureates per capita and the highest average consumption of chocolate. • We do not know whether the individuals who won Nobel Prize in that country actually had a high chocolate intake. • Average values of chocolate consumption and the number of Nobel laureates per capita for each country is given. Exposure: Country’s chocolate consumption Outcome: Number of Nobel Laureates No account is taken of variability between individuals in that country with regard to chocolate consumption-- ecologic fallacy (we may be ascribing to members of a group some characteristic that they in fact do not possess as individuals. )
  • 27.
    Exposure: Community RiskIndicators (CRI) Outcome: Dental Caries • For Grades 4-6 (n = 64), age and fs ; dfs ratio were positively associated with caries scores, while population density, population ; dentist ratio, and years of natural fluoride exposure were negative. • CRI for both models, when compared to individual models, explained a substantial portion of the variation in caries prevalence, 31% for Grades K-3 and 51% for Grades 4-6. • Results suggest that a risk assessment model based on community rather than individual variables is feasible and further refinement may reveal factors useful in identifying high risk communities. Example: • For Grades K-3 (n=108), population density, parental education, and coastal residence were negatively associated with caries scores, while age, and medical and dental Medicaid expenditures were positive.
  • 28.
    Example: • Representative samplesof 11- and 13- year-old schoolchildren were drawn from participating countries and aggregated by the direct age standardization method. • The cross-regional variation of DMFT were 26.3%, in the proportion of children who reported regular toothbrushing. • Low rates of regular toothbrushing and high rates of sweets consumption were related with higher DMFT while high rates of drinking of soft drinks were related with lower DMFT. Consumption of fruits and vegetables had no significant impact. Altogether, factors of this model explained 51.2% of the total DMFT variation across countries. • Conclusion: The findings of the study demonstrate that different oral health behaviour profiles among young people across European countries, Israel, Canada, and the USA significantly contribute to the Statistical analysis was performed using multiple linear regression.
  • 29.
    SUMMARY • Ecological studyis a convenient, cheap and simple study. • Unit of study is the aggregate data not individual level. • It is usually conducted as the first step in study for research. • The result is difficult to interpret because of confounding and bias. • In contemporary epidemiology, the "ecologic fallacy" reflects the failure of the investigator to recognize the need for biologic inference and thus for individual-level data.
  • 30.
    • Levin KA.Study design VI-ecological studies. Evidence-based dentistry. 2006 Dec;7(4):108. • Morgenstern H. Ecologic studies in epidemiology: concepts, principles, and methods. Annual review of public health. 1995 May;16(1):61-81. • Rothman KJ, Greenland S, Lash TL. Modern epidemiology. Philadelphia: Wolters Kluwer Health/Lippincott Williams & Wilkins; 2008 Sep 20. • Celentano, David D.,, M Szklo, and Leon Gordis. Gordis Epidemiology. 6th edition. Philadelphia, PA: Elsevier, 2019. • https://sphweb.bumc.bu.edu/otlt/MPH-Modules/PH717-QuantCore/PH717-Module1B- DescriptiveStudies_and_Statistics/PH717-Module1B-DescriptiveStudies_and_Statistics6.html • Ballini A, Capodiferro S, Toia M, Cantore S, Favia G, De Frenza G, Grassi FR. Evidence-based dentistry: what's new?. International journal of medical sciences. 2007;4(3):174. REFERENCES

Editor's Notes

  • #3 An ecological study is an observational study defined by the level at which data are analyzed, namely at the population or group level, rather than individual level.
  • #4 An ecological study is an observational study at the population or group level, rather than individual level.
  • #9 Geographcal , longitudinal and migration
  • #14 Adjusting for gross national per capita income, income inequality was positively correlated with the percentage of obese men (r = 0.48, p = 0.03), the percentage of obese women (r = 0.62, p = 0.003), diabetes mortality rates per 1 million people (r = 0.46, p = 0.04), and average calories per capita per day (r = 0.50, p = 0.02). Correlations were stronger if analyses were weighted for population size. The effect of income inequality on female obesity was independent of average calorie intake. Obesity, diabetes mortality, and calorie consumption were associated with income inequality in developed countries. Increased nutritional problems may be a consequence of the psychosocial impact of living in a more hierarchical society.
  • #27 This problem arises in an ecologic study because data are only available for groups; we do not have exposure and outcome data for each individual in the population.