Download as PDF, PPTX

![3
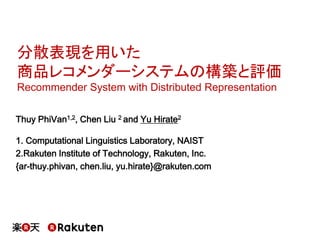
Distributed Representations for Words
• Distributed representations for words
• Similar words are projected into similar vectors.
• Relationship between words can be expressed
as a simple vector calculation.
[T.Mikolov et al. NIPS 2013]
• Analogy
• v(“woman”) – v(”man”) + v(”king”) = v(“queen”)](https://image.slidesharecdn.com/20151125hiratewebdb2015-151127073513-lva1-app6891/85/Recommender-System-with-Distributed-Representation-3-320.jpg)

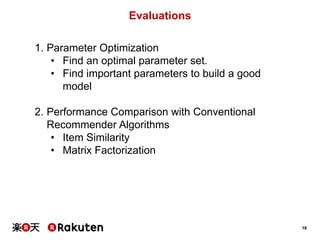
![6
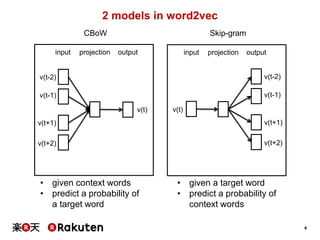
Doc2Vec(Paragraph2Vec) [Q.Le et al. ICML2014]
input projection output input projection output
v(doc)
v(t-1)
v(t+1)
v(t)
v(t-2)
v(t-1)
v(t)
v(t+1)
v(doc)
PV-DM PV-DBoW
v(t-2)
• Assign a “Document Vector” to each document
• Document vector can be used for
• feature of the document
• similarity of documents](https://image.slidesharecdn.com/20151125hiratewebdb2015-151127073513-lva1-app6891/85/Recommender-System-with-Distributed-Representation-6-320.jpg)
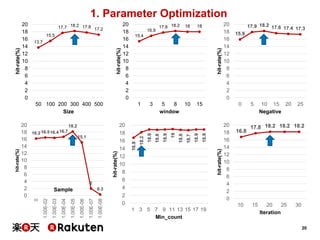
![7
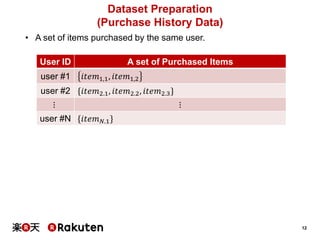
Category2Vec [Marui et al. NLP2015]
https://github.com/rakuten-nlp/category2vec
• Assign “Category Vector” to each category.
• Each document has its own category information.
input projection output
input projection output
v(doc)
v(t-1)
v(t+1)
v(t)
v(t-2)
v(t-1)
v(t)
v(t+1)
v(doc)
CV-DM CV-DBoW
v(t-2)
v(cat)
v(cat)](https://image.slidesharecdn.com/20151125hiratewebdb2015-151127073513-lva1-app6891/85/Recommender-System-with-Distributed-Representation-7-320.jpg)


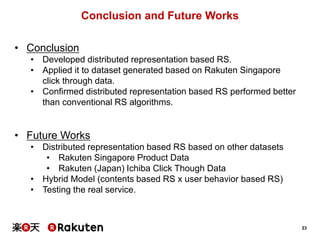
![19
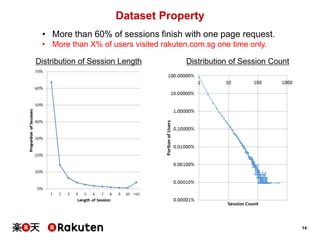
1. Parameter Optimization
Parameter Values Explanation
Size
[50, 100, 200, 300,
400, 500]
Dimensionality of the vectors
Window [1, 3, 5, 8, 10, 15]
Maximum number items of context
that the training algorithm take into account
Negative [0, 5, 10, 15, 20, 25]
Number of “noise words” should be drawn
(usually between 5-20)
Sample
[0, 1e-2, 1e-3, 1e-4,
1e-5, 1e-6, 1e-7, 1e-8]
Sub-sampling of frequent words
Min-count [1, ..., 20]
Items appear less than this min-count
value is ignored
Iteration [10,15, 20, 25, 30] Number of iteration for building model
• Best setting for parameters
Size Window Negative Sample min_count Iteration hit-rate
300 8 10 1e-5 3 20 0.1821](https://image.slidesharecdn.com/20151125hiratewebdb2015-151127073513-lva1-app6891/85/Recommender-System-with-Distributed-Representation-19-320.jpg)


The document discusses the development and evaluation of a recommender system using distributed representation techniques, particularly through models like Word2Vec and Doc2Vec. It details the dataset used, consisting of click-through and purchase history data from Rakuten Singapore, and emphasizes the system's superior performance compared to conventional algorithms like item similarity and matrix factorization. Future work is proposed to enhance the model's capabilities and application to different datasets.


![[Phd Thesis Defense] CHAMELEON: A Deep Learning Meta-Architecture for News Re...](https://cdn.slidesharecdn.com/ss_thumbnails/chameleondefesadoutorado1-191209202516-thumbnail.jpg?width=640&height=640&fit=bounds)