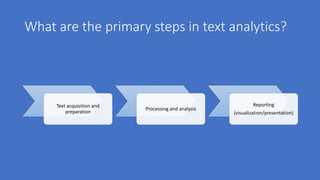
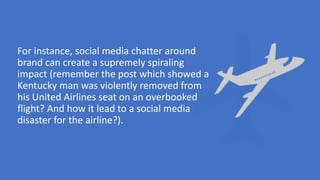
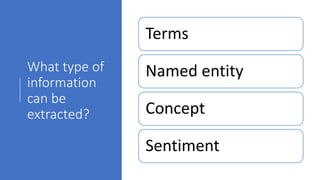
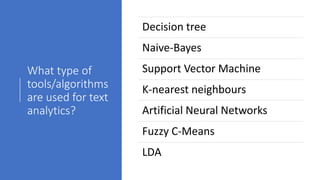
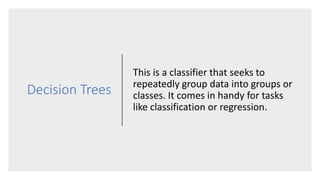
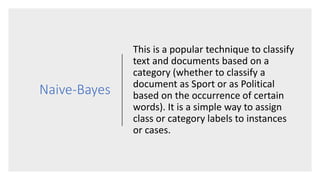
Text analytics is used to extract structured data from unstructured text sources like social media posts, reviews, emails and call center notes. It involves acquiring and preparing text data, processing and analyzing it using algorithms like decision trees, naive bayes, support vector machines and k-nearest neighbors to extract terms, entities, concepts and sentiment. The results are then visualized to support data-driven decision making for applications like measuring customer opinions and providing search capabilities. Popular tools for text analytics include RapidMiner, KNIME, SPSS and R.
This is an introduction to text analytics for advanced business users and IT professionals with limited programming expertise. The presentation will go through different areas of text analytics as well as provide some real work examples that help to make the subject matter a little more relatable. We will cover topics like search engine building, categorization (supervised and unsupervised), clustering, NLP, and social media analysis.
This video will give you an idea about Data science for beginners.
Also explain Data Science Process , Data Science Job Roles , Stages in Data Science Project
Data Science - Part I - Sustaining Predictive Analytics CapabilitiesDerek Kane
This is the first lecture in a series of data analytics topics and geared to individuals and business professionals who have no understand of building modern analytics approaches. This lecture provides an overview of the models and techniques we will address throughout the lecture series, we will discuss Business Intelligence topics, predictive analytics, and big data technologies. Finally, we will walk through a simple yet effective example which showcases the potential of predictive analytics in a business context.
YouTube Link: https://youtu.be/aGu0fbkHhek
** Data Science Master Program: https://www.edureka.co/masters-program/data-scientist-certification **
This Edureka PPT on "Data Science Full Course" provides an end to end, detailed and comprehensive knowledge on Data Science. This Data Science PPT will start with basics of Statistics and Probability and then moves to Machine Learning and Finally ends the journey with Deep Learning and AI. For Data-sets and Codes discussed in this PPT, drop a comment.
Follow us to never miss an update in the future.
YouTube: https://www.youtube.com/user/edurekaIN
Instagram: https://www.instagram.com/edureka_learning/
Facebook: https://www.facebook.com/edurekaIN/
Twitter: https://twitter.com/edurekain
LinkedIn: https://www.linkedin.com/company/edureka
Data Science Training | Data Science For Beginners | Data Science With Python...Simplilearn
This Data Science presentation will help you understand what is Data Science, who is a Data Scientist, what does a Data Scientist do and also how Python is used for Data Science. Data science is an interdisciplinary field of scientific methods, processes, algorithms and systems to extract knowledge or insights from data in various forms, either structured or unstructured, similar to data mining. This Data Science tutorial will help you establish your skills at analytical techniques using Python. With this Data Science video, you’ll learn the essential concepts of Data Science with Python programming and also understand how data acquisition, data preparation, data mining, model building & testing, data visualization is done. This Data Science tutorial is ideal for beginners who aspire to become a Data Scientist.
This Data Science presentation will cover the following topics:
1. What is Data Science?
2. Who is a Data Scientist?
3. What does a Data Scientist do?
This Data Science with Python course will establish your mastery of data science and analytics techniques using Python. With this Python for Data Science Course, you’ll learn the essential concepts of Python programming and become an expert in data analytics, machine learning, data visualization, web scraping and natural language processing. Python is a required skill for many data science positions, so jumpstart your career with this interactive, hands-on course.
Why learn Data Science?
Data Scientists are being deployed in all kinds of industries, creating a huge demand for skilled professionals. A data scientist is the pinnacle rank in an analytics organization. Glassdoor has ranked data scientist first in the 25 Best Jobs for 2016, and good data scientists are scarce and in great demand. As a data you will be required to understand the business problem, design the analysis, collect and format the required data, apply algorithms or techniques using the correct tools, and finally make recommendations backed by data.
You can gain in-depth knowledge of Data Science by taking our Data Science with python certification training course. With Simplilearn’s Data Science certification training course, you will prepare for a career as a Data Scientist as you master all the concepts and techniques. Those who complete the course will be able to:
1. Gain an in-depth understanding of data science processes, data wrangling, data exploration, data visualization, hypothesis building, and testing. You will also learn the basics of statistics.
Install the required Python environment and other auxiliary tools and libraries
2. Understand the essential concepts of Python programming such as data types, tuples, lists, dicts, basic operators and functions
3. Perform high-level mathematical computing using the NumPy package and its largelibrary of mathematical functions.
Learn more at: https://www.simplilearn.com
Applications of Data Science in Drug Discovery, Financial Services, Project Management, Human Resources and Marketing.
By Dr. Laila Alabidi at the JOSA Data Science Meetup on 17/8/2019.
Module 9: Natural Language Processing Part 2Sara Hooker
Delta Analytics is a 501(c)3 non-profit in the Bay Area. We believe that data is powerful, and that anybody should be able to harness it for change. Our teaching fellows partner with schools and organizations worldwide to work with students excited about the power of data to do good.
Welcome to the course! These modules will teach you the fundamental building blocks and the theory necessary to be a responsible machine learning practitioner in your own community. Each module focuses on accessible examples designed to teach you about good practices and the powerful (yet surprisingly simple) algorithms we use to model data.
To learn more about our mission or provide feedback, take a look at www.deltanalytics.org. If you would like to use this material to further our mission of improving access to machine learning. Education please reach out to inquiry@deltanalytics.org .
A set of ideas on the use of artificial intelligence for data curation that has been presented at the Pharma-IT conference (London, 2017), in the artificial intelligence track.
It begins with some broad discussion about semantic web, knowledge representation, machine learning and artificial intelligence. It the focus on how a "data curation" problem can be framed and hints at some possible examples.
If you are curious what is ML all about, this is a gentle introduction to Machine Learning and Deep Learning. This includes questions such as why ML/Data Analytics/Deep Learning ? Intuitive Understanding o how they work and some models in detail. At last I share some useful resources to get started.
1. Introduction and how to get into Data
2. Data Engineering and skills needed
3. Comparison of Data Analytics for statistic and real time streaming data
4. Bayesian Reasoning for Data
Module 1 introduction to machine learningSara Hooker
We believe in building technical capacity all over the world.
We are building and teaching an accessible introduction to machine learning for students passionate about the power of data to do good.
Welcome to the course! These modules will teach you the fundamental building blocks and the theory necessary to be a responsible machine learning practitioner in your own community. Each module focuses on accessible examples designed to teach you about good practices and the powerful (yet surprisingly simple) algorithms we use to model data.
To learn more about our work, visit www.deltanalytics.org
Introduction to Data Science and AnalyticsSrinath Perera
This webinar serves as an introduction to WSO2 Summer School. It will discuss how to build a pipeline for your organization and for each use case, and the technology and tooling choices that need to be made for the same.
This session will explore analytics under four themes:
Hindsight (what happened)
Oversight (what is happening)
Insight (why is it happening)
Foresight (what will happen)
Recording http://t.co/WcMFEAJHok
Pattern recognition involves the identification of recurring trends or structures within a given dataset, enabling us to recognize similarities and make predictions. They provide insights into underlying concepts and facilitate informed decision-making based on observed regularities. In machine learning, pattern recognition employs advanced algorithms to detect and analyze regularities within data. This field has wide-ranging applications, particularly in technical domains such as computer vision, speech recognition, and face recognition. Pattern recognition utilizes statistical information, historical data, and the system’s memory to recognize and classify events or entities.
One key attribute of pattern recognition is the ability to learn from data. It leverages available data to improve its performance continually. ML adapts and refines its algorithms through training and iterative processes, enhancing the accuracy and efficiency of pattern recognition. For instance, in the context of recommending books or movies, if a user consistently prefers black comedies, machine learning algorithms can recognize this pattern and suggest similar genre preferences, avoiding suggestions that do not align with the established pattern.
EXPLORING DATA MINING TECHNIQUES AND ITS APPLICATIONSeditorijettcs
Dr.T.Hemalatha#1, Dr.G.Rashita Banu#2, Dr.Murtaza Ali#3
#1.Assisstant.Professor,VelsUniversity,Chennai
#2Assistant Professor,Department of HIM&T,JazanUniversity,Jasan
#3HOD, Department of HIM&T JazanUniversity,Jasan
EXPLORING DATA MINING TECHNIQUES AND ITS APPLICATIONSeditorijettcs
Dr.T.Hemalatha#1, Dr.G.Rashita Banu#2, Dr.Murtaza Ali#3
#1.Assisstant.Professor,VelsUniversity,Chennai
#2Assistant Professor,Department of HIM&T,JazanUniversity,Jasan
#3HOD, Department of HIM&T JazanUniversity,Jasan
Supervised learning is a machine learning approach that's defined by its use of labeled datasets. These datasets are designed to train or “supervise” algorithms into classifying data or predicting outcomes accurately.
Distributed Digital Artifacts on the Semantic WebEditor IJCATR
Distributed digital artifacts incorporate cryptographic hash values to URI called trusty URIs in a distributed environment
building good in quality, verifiable and unchangeable web resources to prevent the rising man in the middle attack. The greatest
challenge of a centralized system is that it gives users no possibility to check whether data have been modified and the communication
is limited to a single server. As a solution for this, is the distributed digital artifact system, where resources are distributed among
different domains to enable inter-domain communication. Due to the emerging developments in web, attacks have increased rapidly,
among which man in the middle attack (MIMA) is a serious issue, where user security is at its threat. This work tries to prevent MIMA
to an extent, by providing self reference and trusty URIs even when presented in a distributed environment. Any manipulation to the
data is efficiently identified and any further access to that data is blocked by informing user that the uniform location has been
changed. System uses self-reference to contain trusty URI for each resource, lineage algorithm for generating seed and SHA-512 hash
generation algorithm to ensure security. It is implemented on the semantic web, which is an extension to the world wide web, using
RDF (Resource Description Framework) to identify the resource. Hence the framework was developed to overcome existing
challenges by making the digital artifacts on the semantic web distributed to enable communication between different domains across
the network securely and thereby preventing MIMA.
In this paper, I develop a custom binary classifier of search queries for the makeup category using different Machine Learning techniques and models. An extensive exploration of shallow and Deep Learning models was performed using a cross-validation framework to identify the top three models, optimize them tuning their hyperparameters, and finally creating an ensemble of models with a custom decision threshold that outperforms all other models. The final classifier achieves an accuracy of 98.83% on a test set, making it ready for production.
Top 40 Data Science Interview Questions and Answers 2022.pdfSuraj Kumar
1 – What is F1 score?
F1 score is a measure of the accuracy of a model. It is defined as the harmonic mean of precision and recall.
F1 score is one of the most popular metrics for assessing how well a machine learning algorithm performs on predicting a target variable. F1 score ranges from 0 to 1, with higher values indicating better performance.
The F1 score is used to evaluate the performance of a machine learning algorithm by considering how many times it has classified correctly and how many times it has misclassified.
The higher the F1 score, the better the performance of an algorithm.
2 – What is pickling and unpickling?
Pickling is the process of converting an object into a string representation. It can be used to store the object in a file, send it over a network, or save it to disk.
Unpickling is the inverse process of pickling. It converts an object from its string representation back into an object.
Pickling and unpickling can be done with machine learning by using an algorithm that converts the input to the output.
3 – Difference between likelihood and probability?
Probability is a measure of the likelihood of an event happening under certain conditions. The event can be a machine learning algorithm predicting the probability that a person will buy a product or not.
Likelihood is the probability that an event will happen, based on evidence and knowledge about the world. For example, if you see someone who looks like they are going to rob you and you know that they have robbed other people in the past, your likelihood of being robbed is high.
4 – Which machine learning algorithm known as a lazy learner?
KNN is a machine learning algorithm known as a lazy learner. K-NN is a lazy learner because it doesn’t learn any machine learnt values or variables from the training data but dynamically calculates distance every time it wants to classify, hence memorizes the training dataset instead.
5 – How to fix multicollinearity?
Multicollinearity is a statistical problem that arises when two or more independent variables are highly correlated.
One way to fix multicollinearity is to use a different variable that has less correlation with the other variables. If there are not any other variables available, one can use a transformation on the original variable and then re-run the regression.
6 – Significance of gamma and Regularization in SVM?
The significance of gamma and regularization in SVM is that they are used to control the trade-off between the training error and the generalization error. In other words, these two parameters are used to balance the bias-variance trade-off.
Regularization is a technique to reduce overfitting by penalizing models with more complexity than necessary. The goal of regularization is to find a model that has good generalization performance, which means it can correctly predict new data points with high accuracy. On the other hand, gamma is a parameter that controls how much weight should be given to each training ex
Literature Survey: Clustering TechniqueEditor IJCATR
Clustering is a partition of data into the groups of similar or dissimilar objects. Clustering is unsupervised learning
technique helps to find out hidden patterns of Data Objects. These hidden patterns represent a data concept. Clustering is used in many
data mining applications for data analysis by finding data patterns. There is a number of clustering techniques and algorithms are
available to cluster the data object. According to the type of data object and structure appropriate clustering technique is selected. This
survey focuses on the clustering techniques for their input attribute data type, their input parameters and output. The main objective is
not to understand the actual working of clustering technique. Instead, the input data requirement and input parameters of clustering
technique are focused.
Anomaly detection is usually associate degree identification of associate degree odd or abnormal
information typically even known as as an outlier from a offer pattern of information. It involves machine learning
technique to be told the info and verify the outliers supported a likelihood condition. Machine learning, a branch
of AI plays a significant role in analyzing the info and identifies the outliers with a decent likelihood. The target of this
paper is to work out the outlier supported anomaly detection techniques and describe the quality standards of the actual
trade. We have a tendency to describe associate degree approach to analyzing anomalies in trade information
supported the identification of cluster outliers.
Introduction to feature subset selection methodIJSRD
Data Mining is a computational progression to ascertain patterns in hefty data sets. It has various important techniques and one of them is Classification which is receiving great attention recently in the database community. Classification technique can solve several problems in different fields like medicine, industry, business, science. PSO is based on social behaviour for optimization problem. Feature Selection (FS) is a solution that involves finding a subset of prominent features to improve predictive accuracy and to remove the redundant features. Rough Set Theory (RST) is a mathematical tool which deals with the uncertainty and vagueness of the decision systems.
SURVEY ON CLASSIFICATION ALGORITHMS USING BIG DATASETEditor IJMTER
Data mining environment produces a large amount of data that need to be analyzed.
Using traditional databases and architectures, it has become difficult to process, manage and analyze
patterns. To gain knowledge about the Big Data a proper architecture should be understood.
Classification is an important data mining technique with broad applications to classify the various
kinds of data used in nearly every field of our life. Classification is used to classify the item
according to the features of the item with respect to the predefined set of classes. This paper put a
light on various classification algorithms including j48, C4.5, Naive Bayes using large dataset.
Big Data’s Potential for the Real Estate Industry: 2021PromptCloud
Many real estate firms have long made decisions based on a combination of intuition and traditional, retrospective data. Today, a host of new variables make it possible to paint more vivid pictures of a location’s future risks and opportunities.
In this quickly technologizing industry, arming your team with the most robust data available and making important decisions based on the data is going to determine who wins and loses.Big data will become the key basis of competition and growth for individual firms, enhancing productivity and creating significant value for the world economy. In this white paper, we explore the real estate outlook for financial investment in 2021 and use cases demonstrating the power of data in transforming the real estate industry.
Looking for a similar tool like Octoparse? We have conducted thorough research on tools that can process web data to draw actionable insights. The results were amazing, as most of the web scraping tools that are available in the market offer unique value propositions for unique data requirements, differing from business to business. As you read further, you will be able to figure out the best Octoparse competitors & alternatives for your organizational data needs.
Most of the users use Octoparse to figure out how the market is functioning and to conduct data verification. However, conducting broad-level research might not always work for companies running in a niche domain. There are a lot of tools available today, offering value services like: easy usage, value for money, better user rating, getting structured data and etc, that could be a great fit for your business requirements. But first, let’s understand how Octoparse web scraping works.
How to Choose the Right Competitors & Alternatives of ParseHub Web Scraping Software?
Web scraping is generally used to understand the marketplaces and get visibility on the pricing structure of your competitors in the niche your company is invested in. Getting a fair understanding of various web scraping products and Parsehub competitors and alternatives will enable you to make informed decisions to grow your business. Read more to know how these tools work, scaling, delivery, target customers, and shortcomings. Read further, to take a look at companies offering data services according to industries, user rating, accessibility, deliverables, speed, interface, customer service, and technical challenges. But before we dive into this, let’s understand what web scraping is and how to access the ParseHub Web Scraping Software.
Product Visibility- What Is Seen First, Will ppt.pptxPromptCloud
Putting your products on multiple eCommerce websites may give you a broad reach, but might not be enough for them to be “visible”. Creating quality blogs or short videos on several themes could help you find a wider reach!You can partake in multiple activities like –
Talk about the USP of your products or highlight the star products.
Share a comparison of your products with your competitors.
Discuss topics related to the your product and services delivered by you. When users go to a product page, right after the images, they look at the heading and the description. Let’s take an example of a product listed on Amazon, to figure out how both headings and descriptions can increase the sales of your products.Read the complaints they have with similar products. Decide upon the size and quantity options that would suit the user base most. Understand the price point that is desired. And lo and behold you would have increased your product visibility!
Data plays a vital role in the fashion industry. It is used to drive decisions and strategy that generate sales, gain a better understanding of customers, and boost overall profit. Fashion designers and companies use data on a daily basis run a successful fashion business. However, the commonly perceived data used by fashion designers differ from the standard mathematical statistics commonly associated with the term “data”. Hence, data is not usually associated with the word fashion.
But, today’s top fashion houses are deploying several ways to use emerging analytical technologies in fashion retail today. We explore how the modern fashion industry uses data.
Data Standardization with Web Data Integration PromptCloud
Before analyzing data aggregated from multiple sources, it is essential to first standardize the datasets. At PromptCloud, we put special emphasis on this process and understand that as a web crawling company, our solution must enable our clients to integrate data efficiently.
Zipcode based price benchmarking for retailersPromptCloud
Here's our case study of a popular e-commerce platform based out of the United States, seeking data to be extracted from the web to enhance its pricing and product strategy.
Analyzing Positiveness in 160+ Holiday SongsPromptCloud
It is known that during any kind of celebration music is indispensable and the holiday season is no different. Since this time of the year brings positiveness, we decided to analyze the holiday songs to uncover some interesting insights related to musical features and positiveness in songs.
What a year 2018 has been for the data ecosystem! We believe the high-magnitude and rapid demand for alt-data (especially web data) from companies of various sizes across industries is a remarkable element of this year.
For PromptCloud, it has always been about moving the needle when it comes to democratization of web data access. We’re fortunate enough to have built a team that absolutely loves the ease of information flow offered by the internet and wants to share the same with the businesses across the globe.
We’re on a journey to make a dent in the alt-data space with laser-focused teams that are paranoid about the data quality delivered to our customers. In honor of our successful clients and their incredible growth powered by our talented data wizards, let’s spare a moment to celebrate PromptCloud’s year in review.
10 Mobile App Ideas that can be Fueled by Web ScrapingPromptCloud
We discuss various applications of web crawling and alternate data to fuel 10 potential mobile apps. The ideas range from reverse image search engine powered AI to voice of customer in ecommerce domain.
How Web Scraping Can Help Affiliate MarketersPromptCloud
This presentation discusses how web scraping services can be deployed to acquire trending ecommerce product data for better conversion in affiliate marketing.
In this study, we analyze the reviews for the top 10 most expensive and least expensive hotels based out of London to compare various aspects of the rating and review text.
Data Centers - Striving Within A Narrow Range - Research Report - MCG - May 2...pchutichetpong
M Capital Group (“MCG”) expects to see demand and the changing evolution of supply, facilitated through institutional investment rotation out of offices and into work from home (“WFH”), while the ever-expanding need for data storage as global internet usage expands, with experts predicting 5.3 billion users by 2023. These market factors will be underpinned by technological changes, such as progressing cloud services and edge sites, allowing the industry to see strong expected annual growth of 13% over the next 4 years.
Whilst competitive headwinds remain, represented through the recent second bankruptcy filing of Sungard, which blames “COVID-19 and other macroeconomic trends including delayed customer spending decisions, insourcing and reductions in IT spending, energy inflation and reduction in demand for certain services”, the industry has seen key adjustments, where MCG believes that engineering cost management and technological innovation will be paramount to success.
MCG reports that the more favorable market conditions expected over the next few years, helped by the winding down of pandemic restrictions and a hybrid working environment will be driving market momentum forward. The continuous injection of capital by alternative investment firms, as well as the growing infrastructural investment from cloud service providers and social media companies, whose revenues are expected to grow over 3.6x larger by value in 2026, will likely help propel center provision and innovation. These factors paint a promising picture for the industry players that offset rising input costs and adapt to new technologies.
According to M Capital Group: “Specifically, the long-term cost-saving opportunities available from the rise of remote managing will likely aid value growth for the industry. Through margin optimization and further availability of capital for reinvestment, strong players will maintain their competitive foothold, while weaker players exit the market to balance supply and demand.”
Chatty Kathy - UNC Bootcamp Final Project Presentation - Final Version - 5.23...John Andrews
SlideShare Description for "Chatty Kathy - UNC Bootcamp Final Project Presentation"
Title: Chatty Kathy: Enhancing Physical Activity Among Older Adults
Description:
Discover how Chatty Kathy, an innovative project developed at the UNC Bootcamp, aims to tackle the challenge of low physical activity among older adults. Our AI-driven solution uses peer interaction to boost and sustain exercise levels, significantly improving health outcomes. This presentation covers our problem statement, the rationale behind Chatty Kathy, synthetic data and persona creation, model performance metrics, a visual demonstration of the project, and potential future developments. Join us for an insightful Q&A session to explore the potential of this groundbreaking project.
Project Team: Jay Requarth, Jana Avery, John Andrews, Dr. Dick Davis II, Nee Buntoum, Nam Yeongjin & Mat Nicholas
Show drafts
volume_up
Empowering the Data Analytics Ecosystem: A Laser Focus on Value
The data analytics ecosystem thrives when every component functions at its peak, unlocking the true potential of data. Here's a laser focus on key areas for an empowered ecosystem:
1. Democratize Access, Not Data:
Granular Access Controls: Provide users with self-service tools tailored to their specific needs, preventing data overload and misuse.
Data Catalogs: Implement robust data catalogs for easy discovery and understanding of available data sources.
2. Foster Collaboration with Clear Roles:
Data Mesh Architecture: Break down data silos by creating a distributed data ownership model with clear ownership and responsibilities.
Collaborative Workspaces: Utilize interactive platforms where data scientists, analysts, and domain experts can work seamlessly together.
3. Leverage Advanced Analytics Strategically:
AI-powered Automation: Automate repetitive tasks like data cleaning and feature engineering, freeing up data talent for higher-level analysis.
Right-Tool Selection: Strategically choose the most effective advanced analytics techniques (e.g., AI, ML) based on specific business problems.
4. Prioritize Data Quality with Automation:
Automated Data Validation: Implement automated data quality checks to identify and rectify errors at the source, minimizing downstream issues.
Data Lineage Tracking: Track the flow of data throughout the ecosystem, ensuring transparency and facilitating root cause analysis for errors.
5. Cultivate a Data-Driven Mindset:
Metrics-Driven Performance Management: Align KPIs and performance metrics with data-driven insights to ensure actionable decision making.
Data Storytelling Workshops: Equip stakeholders with the skills to translate complex data findings into compelling narratives that drive action.
Benefits of a Precise Ecosystem:
Sharpened Focus: Precise access and clear roles ensure everyone works with the most relevant data, maximizing efficiency.
Actionable Insights: Strategic analytics and automated quality checks lead to more reliable and actionable data insights.
Continuous Improvement: Data-driven performance management fosters a culture of learning and continuous improvement.
Sustainable Growth: Empowered by data, organizations can make informed decisions to drive sustainable growth and innovation.
By focusing on these precise actions, organizations can create an empowered data analytics ecosystem that delivers real value by driving data-driven decisions and maximizing the return on their data investment.
2. What is text analytics?
It is all about deriving high-quality structured
data for analysis from unstructured text.
3. Why is text analytics used?
It is used to measure customer opinions, product reviews,
feedback, to provide search facility, sentimental analysis and
entity modeling to support data-backed decision making.
4. What are the primary steps in text analytics?
Text acquisition and
preparation
Processing and analysis
Reporting
(visualization/presentation)
5. For instance, social media chatter around
brand can create a supremely spiraling
impact (remember the post which showed a
Kentucky man was violently removed from
his United Airlines seat on an overbooked
flight? And how it lead to a social media
disaster for the airline?).
6. In addition to social media data, other
examples include e-mail messages, call
center notes, and customer records.
7. In addition to social media data, other
examples include e-mail messages,
call center notes, and customer
records.
10. Named entities
These are extracted to answer the ‘who’, ‘what’, or
‘where’. Some instances include name, location,
timestamp, or product.
11. Concept
These are extracted to answer the ‘about’ of a piece of
content. It describes the idea behind the content.
12. Sentiment
These are extracted to gauge the overall feeling around a
brand at the moment. The above United Airlines
example will be (evidently) negative sentiment, denoting
unhappy customers, and potential business losses.
13. What type of
tools/algorithms
are used for text
analytics?
Decision tree
Naive-Bayes
Support Vector Machine
K-nearest neighbours
Artificial Neural Networks
Fuzzy C-Means
LDA
14. Decision Trees
This is a classifier that seeks to
repeatedly group data into groups or
classes. It comes in handy for tasks
like classification or regression.
15. Popular
algorithms in
Decision trees
ID3: Iternative Dichotomizer builds a decision tree
that splits data based on highest information gain
(and lowest entropy) till every group has
homogenous data.
C4.5: This algorithm too uses information gain and
entropy to classify data (just like ID3). Unlike ID3, it
accepts continuous and discrete features and
handles incomplete data too.
CART: Classification and Regression Tree works just
like C4.5. One notable difference is that CART uses
Gini impurity (to assess ‘purity’ or homogeneity of
the node) instead of information gain/entropy used
by C4.5
16. Naive-Bayes
This is a popular technique to classify
text and documents based on a
category (whether to classify a
document as Sport or as Political
based on the occurrence of certain
words). It is a simple way to assign
class or category labels to instances
or cases.
17. Naive-Bayes
Rather than being a single distinct algorithm, it is a set of algorithms that work on
one underlying principle -- “the value of a given feature is independent of the
value of any other feature”.
18. Support
Vector
Machines
This is a supervised machine learning
algorithm. It can be applied on
classification and regression
problems. Its essential component is
kernel trick which transforms linear
data into non-linear data by replacing
its features by a kernel function.
It is used in hypertext categorization,
classification of images, and facial
recognition applications.
19. Applications of SVM
It is used in hypertext categorization, classification of images,
and facial recognition applications.
20. K Nearest
Neighbors
k-NN is used is search items where
you are looking for something similar.
You determine similarity by creating
a vector representation of the items
and then compare how similar or
dissimilar they are using a distance
metric like Euclidean distance.
21. Applications of k-NN
The best example of k-NN’s prowess is an e-commerce site’s
product recommendation feature. You can also utilize k-NN to
do Concept Search (finding semantically similar documents).
22. Artificial
Neural
Networks
ANNs are primarily utilized for non-
linear boundaries- based
classification. Much like the working
of the human brain, ANN operates on
hidden states (which correspond to
the neurons in the brain).
24. Applications of ANN
Image compression, handwriting analysis, and stock exchange
movement prediction are some sectors where ANN comes in
useful.
25. Fuzzy
C-Means
This is a useful form of clustering that
can add value when there are items
that can be a part of more than one
cluster. It works on the principle that
after the clustering is over, all items
in a cluster are as similar as possible
to each other.
26. Steps in Fuzzy
C-Means
Pick
Pick a number
of clusters
where the
items can be
categorized
Assign
Assign
coefficient to
each data point
for being
present inside
the cluster
Repeat
Repeat till the
coefficients’
value updates
between two
iterations is not
more than the
pre-defined
sensitivity
threshold value
27. Applications of Fuzzy C-Means
Disciplines like Bioinformatics, healthcare, and economics
make use of fuzzy c-means with great success.
29. Primary steps
in LDA
01
Provide an
estimate of the
potential number
of topics
02
Algorithm assigns a
word to a topic
Algorithm will
check the accuracy
of topic assignment
in a loop
This helps in ensuring coherent topic clustering.
30. An example of LDA
Suppose there are three separate sentences.
1. I eat chicken and vegetables
2. Chicken are pets
3. My dog loves to eat chicken
With LDA, topic clustering for these 3 lines are done as follows –
• Sentence 1 = 100% Topic B
• Sentence 2 = 100% Topic A
• Sentence 3= 33% Topic A and 67% Topic B
Now we infer that there are two clusters for sentence classification –
Pets (Topic A) and Food (Topic B).
31. A pioneer is custom and large-scale web data extraction.
www.promptcloud.com | sales@promptcloud.com