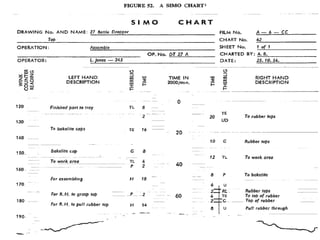
by
Prof. R.C.Meshram
A   chart may be a diagram, a picture or a graph
  which gives an overall view of the situation, say a
  process. a process chart records graphically or
  diagrammatically in sequence the operations
  connected with a process.
 All the details about the existing method/ process
  are recorded and represent in chart. This is done by
  directly observing the work.
 Symbols   are used to represent the activities like
  operation, inspection, transport, storage and delay.
 Therecording of the facts about the job or operation
 in a process chart is done by using standard
 symbols.
1. Operation
 A large circle indicates operation.
 An operation takes place when there is a change in physical
   or chemical characteristics of an object. An assembly or
   disassembly is also an operation.
 When information is given or received or when planning or
   calculating takes place it is also called operation.
 Example: Reducing the diameter of an object in a lathe.
   Hardening the surface of an object by heat treatment.
2. Inspection
 A square indicates inspection. Inspection is checking an
  object for its quality, quantity or identifications.
 Example: Checking the diameter of a rod. Counting the
  number of products produced. of an object by heat
  treatment.
3. Transport
 An arrow indicates transport. This refers to the movement
  of an object or operator or equipment from one place to
  another. When the movement takes place during an
  operation, it is not called transport.
 Example: Moving the material by a trolley Operator going
  to the stores to get some tool.
4. Delay or temporary storage
 A large capital letter D indicates delay. This is also called
  as temporary storage. Delay occurs when an object or
  operator is waiting for the next activity.
 Example: An operator waiting to get a tool in the stores.
  Work pieces stocked near the machine before the next
  operation.
5. Permanent storage
 An equilateral triangle standing on its vertex represents
  storage. Storage takes place when an object is stored
  and protected against unauthorized removal.
 Example: Raw material in the store room.
 An  outline process chart is a process chart giving an over-all
  picture by recording in sequence only the main operations and
  inspections.
 An operation process chart is a graphic representation of the
  sequence of all operations and inspections taking place in a
  process.
 It gives   a bird‘s eye view of the overall activities.
 Entrypoints of all material, the sequence of all operations and
  inspection associated with the process are noted in the chart.
1. Write title at the top of the chart.
2. Begin the chart from the right hand side top
      corner.
3. Represent the main component at the right
      extreme.
4. Represent the sequence of operations and
      inspections by their symbols. Connect them
      by vertical flow lines.
5. Record the brief description of the activity to the
      right side of the symbols.
6. Note down the time for each activity to the left of
  the symbol.
7. Number all operations in one serial order. Start
  from the right hand top (from number 1).
8. Similarly number all inspections in another serial
  order (starting from 1).
9. Continue numbering, till the entry of the second
  component.
10. Show the entry of purchased parts by horizontal
 lines.
7   1

    4
A   flow process chart is a graphical representation of the
  sequence of all the activities (operation, inspection,
  transport, delay and storage) taking place in a process.
 It is the detail version of outline process chart recording
  all the event.
 Process chart symbols are used here to represent the
  activities.
1. The details must be obtained by direct observation—charts must
   not be based on memory.
2. All the facts must be correctly recorded.
3. No assumptions should be made.
4. Make it easy for future reference.
5. All charts must have the following details:
   (a) Name of the product, material or equipment that is observed.
   (b) Starting point and ending point.
   (c) The location where the activities take place.
   (d) The chart reference number, sheet number and number of
   total sheets.
   (e) Key to the symbols used must be stated.
 Set out sequence of flow of events occurring in the
  process.
 To study the event in a systematic way.
   To improve the layout.
   To improve material handling.
   To reduce delays.
   To eliminate, combine or rearrange the events in a
    systematic way.
 To  compare between two or more alternative
  methods.
 To select operations for detailed study.
1. Man/ Worker type flow process chart.
  This flow process chart records what the worker
  does.
2. Material type flow process chart.
  This flow process chart records how the material is
  handled or treated.
3. Equipment type flow process chart
  This flow process chart records how the equipment
  or machine is used.
  It is the process chart in which the activities of two
  hands of the operator are recorded.
 Motions of both hands of worker are Right hand-Left
  hand chart recorded independently.
 It shows whether the two hands of the operator are
  idle or moving in relation to one another, in a
  timescale.
 It is generally used for repetitive operations.
  Operation: Represents the activities grasp, position, use,
  release etc. of a tool, component or material.
 Transport: Represents the movement of the hand or limb to or
  from the work or a tool or material.
 Delay: Refers to the time when the hand or limb is idle.
 Storage (Hold): The term ‘hold’ is used here instead of storage.
  This refers to the time when the work is held by hand.
 The activity ‘inspection’ by hand is considered as an operation.
  Hence, the symbol for inspection is not used in this chart.
 Two-handed process chart can be used for assembly, machining
  and clerical jobs.
1. Provide all information about the job in the chart.
2. Study the operation cycle a few times before
  starting to record.
3. Record one hand at a time.
4. First record the activities of the hand which starts
  the work first.
5. Do not combine the different activities like
  operations, transport etc.
 Multiple Activity Chart
 Simo Chart
 P.M.T.S. Chart
A   man-machine/ Multiple Activity Chart chart is a chart in
  which the activities of more than one worker or machine
  are recorded.
 Activities are recorded on a common time scale to show
  the inter-relationship.
 It is used when a worker operates a number of machines
  at a time. It is also used when a number of workers jointly
  do a job.
 The chart shows the idle time of the worker or machine
  during the process.
 Work    load is evenly distributed among the workers or
  machines by this the idle time of worker or machine is
  reduced. Multiple activity chart is very useful in planning
  team work in production or maintenance.
 Only two symbols are used in man-machine/ Multiple
  Activity Chart :

                      Working                 Idle
 Types of   Multiple Activity Chart :
     Man – Machine Chart
     Man – Multimachine Chart
     Multi – Man Chart
     Multi – Man machine Chart
 To  detect the idle time on machine and workers
 To optimize work distribution between workers and
  machines.
 To decide no. of workers in a group.
 To balance the work team
 To examine the activities.
 It is used for recording the complex movements of
  material or men.
 Used to find out the most economical route.
 Plant repair & maintenance.
 Job construction.
 Planning team work.
 It is used to check whether the work station is correctly
  located.
 Only  one recording technique of micromotion study will be
  described here briefly, namely the Simultaneous Motion
  Cycle Chart (SIMO Chart),
 A simo chart is a chart, often based on film analysis, used
  to record simultaneously on a common time scale the
  therbligs or groups of therbligs performed by different parts
  of the body of one or more workers.
 The simo chart is the micromotion form of the man type
  flow process chart. Because simo charts are used primarily
  for operations of short duration, often performed with
  extreme rapidity, it is generally necessary to compile them
  from films made of the operation which can be stopped at
  any point or projected in slow motion.
 Itwill be seen from the chart illustrated in figure that the
  movements are recorded against time measured in "winks"
  (1 wink = 1/2000 minute).
 These are recorded by a "wink counter" placed in such a
  position that it can be seen rotating during the filming.
 Some simo charts are drawn up listing the fingers used,
  wrist, lower and upper arms.
Lecture 2 process charts work study

Lecture 2 process charts work study

  • 1.
  • 2.
    A chart may be a diagram, a picture or a graph which gives an overall view of the situation, say a process. a process chart records graphically or diagrammatically in sequence the operations connected with a process.  All the details about the existing method/ process are recorded and represent in chart. This is done by directly observing the work.  Symbols are used to represent the activities like operation, inspection, transport, storage and delay.
  • 3.
     Therecording ofthe facts about the job or operation in a process chart is done by using standard symbols.
  • 4.
    1. Operation  Alarge circle indicates operation.  An operation takes place when there is a change in physical or chemical characteristics of an object. An assembly or disassembly is also an operation.  When information is given or received or when planning or calculating takes place it is also called operation.  Example: Reducing the diameter of an object in a lathe. Hardening the surface of an object by heat treatment.
  • 5.
    2. Inspection  Asquare indicates inspection. Inspection is checking an object for its quality, quantity or identifications.  Example: Checking the diameter of a rod. Counting the number of products produced. of an object by heat treatment.
  • 6.
    3. Transport  Anarrow indicates transport. This refers to the movement of an object or operator or equipment from one place to another. When the movement takes place during an operation, it is not called transport.  Example: Moving the material by a trolley Operator going to the stores to get some tool.
  • 7.
    4. Delay ortemporary storage  A large capital letter D indicates delay. This is also called as temporary storage. Delay occurs when an object or operator is waiting for the next activity.  Example: An operator waiting to get a tool in the stores. Work pieces stocked near the machine before the next operation.
  • 8.
    5. Permanent storage An equilateral triangle standing on its vertex represents storage. Storage takes place when an object is stored and protected against unauthorized removal.  Example: Raw material in the store room.
  • 9.
     An outline process chart is a process chart giving an over-all picture by recording in sequence only the main operations and inspections.  An operation process chart is a graphic representation of the sequence of all operations and inspections taking place in a process.  It gives a bird‘s eye view of the overall activities.  Entrypoints of all material, the sequence of all operations and inspection associated with the process are noted in the chart.
  • 10.
    1. Write titleat the top of the chart. 2. Begin the chart from the right hand side top corner. 3. Represent the main component at the right extreme. 4. Represent the sequence of operations and inspections by their symbols. Connect them by vertical flow lines. 5. Record the brief description of the activity to the right side of the symbols.
  • 11.
    6. Note downthe time for each activity to the left of the symbol. 7. Number all operations in one serial order. Start from the right hand top (from number 1). 8. Similarly number all inspections in another serial order (starting from 1). 9. Continue numbering, till the entry of the second component. 10. Show the entry of purchased parts by horizontal lines.
  • 12.
    7 1 4
  • 15.
    A flow process chart is a graphical representation of the sequence of all the activities (operation, inspection, transport, delay and storage) taking place in a process.  It is the detail version of outline process chart recording all the event.  Process chart symbols are used here to represent the activities.
  • 16.
    1. The detailsmust be obtained by direct observation—charts must not be based on memory. 2. All the facts must be correctly recorded. 3. No assumptions should be made. 4. Make it easy for future reference. 5. All charts must have the following details: (a) Name of the product, material or equipment that is observed. (b) Starting point and ending point. (c) The location where the activities take place. (d) The chart reference number, sheet number and number of total sheets. (e) Key to the symbols used must be stated.
  • 17.
     Set outsequence of flow of events occurring in the process.  To study the event in a systematic way.  To improve the layout.  To improve material handling.  To reduce delays.  To eliminate, combine or rearrange the events in a systematic way.  To compare between two or more alternative methods.  To select operations for detailed study.
  • 18.
    1. Man/ Workertype flow process chart. This flow process chart records what the worker does. 2. Material type flow process chart. This flow process chart records how the material is handled or treated. 3. Equipment type flow process chart This flow process chart records how the equipment or machine is used.
  • 21.
     Itis the process chart in which the activities of two hands of the operator are recorded.  Motions of both hands of worker are Right hand-Left hand chart recorded independently.  It shows whether the two hands of the operator are idle or moving in relation to one another, in a timescale.  It is generally used for repetitive operations.
  • 22.
     Operation:Represents the activities grasp, position, use, release etc. of a tool, component or material.  Transport: Represents the movement of the hand or limb to or from the work or a tool or material.  Delay: Refers to the time when the hand or limb is idle.  Storage (Hold): The term ‘hold’ is used here instead of storage. This refers to the time when the work is held by hand.  The activity ‘inspection’ by hand is considered as an operation. Hence, the symbol for inspection is not used in this chart.  Two-handed process chart can be used for assembly, machining and clerical jobs.
  • 23.
    1. Provide allinformation about the job in the chart. 2. Study the operation cycle a few times before starting to record. 3. Record one hand at a time. 4. First record the activities of the hand which starts the work first. 5. Do not combine the different activities like operations, transport etc.
  • 25.
     Multiple ActivityChart  Simo Chart  P.M.T.S. Chart
  • 26.
    A man-machine/ Multiple Activity Chart chart is a chart in which the activities of more than one worker or machine are recorded.  Activities are recorded on a common time scale to show the inter-relationship.  It is used when a worker operates a number of machines at a time. It is also used when a number of workers jointly do a job.  The chart shows the idle time of the worker or machine during the process.
  • 27.
     Work load is evenly distributed among the workers or machines by this the idle time of worker or machine is reduced. Multiple activity chart is very useful in planning team work in production or maintenance.  Only two symbols are used in man-machine/ Multiple Activity Chart : Working Idle  Types of Multiple Activity Chart :  Man – Machine Chart  Man – Multimachine Chart  Multi – Man Chart  Multi – Man machine Chart
  • 28.
     To detect the idle time on machine and workers  To optimize work distribution between workers and machines.  To decide no. of workers in a group.  To balance the work team  To examine the activities.  It is used for recording the complex movements of material or men.  Used to find out the most economical route.
  • 29.
     Plant repair& maintenance.  Job construction.  Planning team work.  It is used to check whether the work station is correctly located.
  • 30.
     Only one recording technique of micromotion study will be described here briefly, namely the Simultaneous Motion Cycle Chart (SIMO Chart),  A simo chart is a chart, often based on film analysis, used to record simultaneously on a common time scale the therbligs or groups of therbligs performed by different parts of the body of one or more workers.  The simo chart is the micromotion form of the man type flow process chart. Because simo charts are used primarily for operations of short duration, often performed with extreme rapidity, it is generally necessary to compile them from films made of the operation which can be stopped at any point or projected in slow motion.
  • 31.
     Itwill beseen from the chart illustrated in figure that the movements are recorded against time measured in "winks" (1 wink = 1/2000 minute).  These are recorded by a "wink counter" placed in such a position that it can be seen rotating during the filming.  Some simo charts are drawn up listing the fingers used, wrist, lower and upper arms.

Editor's Notes

  • #26 Example of a two-handed process chart is shown in figure 1.4. Here the assembly of a nut and washer over a bolt is recorded. The work place layout is shown in the right hand corner. The activities of left hand are recorded at left half of the chart. The activities of the right hand are recorded at the right half of the chart. The horizontal lines represent the time scale. Activities of left hand and right hand shown in the same line occur at the same moment. Summary of the number of each activity can be tabulated at the bottom of the chart. The chart is first drawn for the existing method. This chart is analyzed and if it is found that one hand is over loaded than the other, modification are done in the layout of the workplace or in the sequence of activities. Then a new chart is made for the proposed cycle.