More Related Content
Similar to Market Dynamics Report Shows Housing Trends
Similar to Market Dynamics Report Shows Housing Trends (20)
More from Prudential Fox & Roach, Realtors
More from Prudential Fox & Roach, Realtors (20)
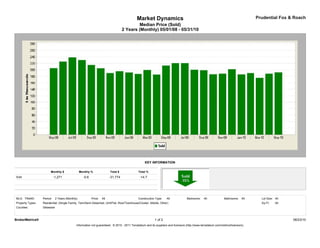
Market Dynamics Report Shows Housing Trends
- 1. Market Dynamics Prudential Fox & Roach
Median Price (Sold)
2 Years (Monthly) 05/01/08 - 05/31/10
KEY INFORMATION
Monthly $ Monthly % Total $ Total %
Sold -1,271 -0.6 -31,774 -14.7
MLS: TReND Period: 2 Years (Monthly) Price: All Construction Type: All Bedrooms: All Bathrooms: All Lot Size: All
Property Types: Residential: (Single Family, Twin/Semi-Detached, Unit/Flat, Row/Townhouse/Cluster, Mobile, Other) Sq Ft: All
Counties: Delaware
BrokerMetrics® 1 of 2 06/23/10
Information not guaranteed. © 2010 - 2011 Terradatum and its suppliers and licensors (http://www.terradatum.com/metrics/licensors).
- 2. Market Dynamics Prudential Fox & Roach
Median Price (Sold)
2 Years (Monthly) 05/01/08 - 05/31/10
FOR SALE UNDER CONTRACT SOLD EXPIRED NEW LISTINGS
Time Period Median $ # Properties Median $ # Properties Median $ # Properties Median $ # Properties Median $ # Properties
May-10 220,000 4,362 214,700 316 192,000 507 214,000 389 219,900 815
Apr-10 215,000 4,705 188,000 797 188,000 467 219,000 361 219,900 1,220
Mar-10 212,000 4,477 208,500 654 175,000 377 179,900 338 219,000 1,179
Feb-10 204,900 3,961 189,900 365 189,950 236 197,000 298 214,900 709
Jan-10 200,000 3,886 199,900 343 185,750 250 219,900 291 192,500 767
Dec-09 200,000 3,811 199,900 255 202,000 335 178,000 437 174,900 411
Nov-09 210,000 4,025 211,000 314 188,000 577 218,900 311 180,950 556
Oct-09 215,000 4,307 199,500 505 186,000 515 229,900 333 198,000 741
Sep-09 215,000 4,439 194,900 511 198,500 431 221,950 362 200,000 909
Aug-09 216,900 4,309 207,200 468 199,900 514 210,000 311 179,900 732
Jul-09 224,900 4,375 200,000 475 220,000 570 254,900 323 207,950 788
Jun-09 224,900 4,415 199,900 495 220,000 569 227,000 333 214,900 748
May-09 225,000 4,517 224,950 552 212,750 402 229,900 298 222,900 827
Apr-09 228,600 4,478 219,900 498 185,450 360 246,950 290 229,427 959
Mar-09 225,000 4,217 224,900 413 198,900 337 219,500 285 224,950 874
Feb-09 224,900 3,981 199,919 393 187,000 233 225,000 245 229,900 742
Jan-09 219,900 3,921 189,900 316 191,500 236 225,000 366 199,900 640
Dec-08 224,500 3,935 199,900 252 195,250 350 220,000 402 179,250 402
Nov-08 224,972 4,173 193,750 256 190,000 286 223,400 384 205,000 505
Oct-08 225,900 4,393 200,000 307 204,500 392 242,400 418 218,950 706
Sep-08 225,000 4,551 189,900 362 215,000 421 224,900 502 224,900 934
Aug-08 224,900 4,380 214,900 383 229,900 514 219,000 380 199,900 739
Jul-08 229,500 4,509 220,000 462 238,000 503 232,450 406 219,395 904
Jun-08 235,000 4,556 234,950 498 225,000 594 249,900 453 224,900 1,005
May-08 239,000 4,452 229,900 509 205,000 517 234,250 392 234,900 999
BrokerMetrics® 2 of 2 06/23/10
Information not guaranteed. © 2010 - 2011 Terradatum and its suppliers and licensors (http://www.terradatum.com/metrics/licensors).