2010 February Chester County Basic Supply And Demand
•
0 likes•55 views


Recommended
Recommended
More Related Content
What's hot
What's hot (15)
Similar to 2010 February Chester County Basic Supply And Demand
Similar to 2010 February Chester County Basic Supply And Demand (16)
More from Prudential Fox & Roach, Realtors
More from Prudential Fox & Roach, Realtors (20)
Recently uploaded
Recently uploaded (20)
2010 February Chester County Basic Supply And Demand
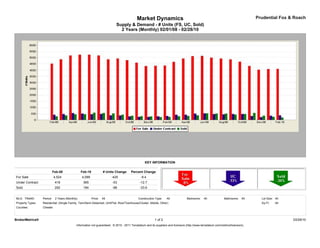
- 1. Market Dynamics Prudential Fox & Roach Supply & Demand - # Units (FS, UC, Sold) 2 Years (Monthly) 02/01/08 - 02/28/10 KEY INFORMATION Feb-08 Feb-10 # Units Change Percent Change For Sale 4,524 4,099 -425 -9.4 Under Contract 418 365 -53 -12.7 Sold 292 194 -98 -33.6 MLS: TReND Period: 2 Years (Monthly) Price: All Construction Type: All Bedrooms: All Bathrooms: All Lot Size: All Property Types: Residential: (Single Family, Twin/Semi-Detached, Unit/Flat, Row/Townhouse/Cluster, Mobile, Other) Sq Ft: All Counties: Chester BrokerMetrics® 1 of 2 03/29/10 Information not guaranteed. © 2010 - 2011 Terradatum and its suppliers and licensors (http://www.terradatum.com/metrics/licensors).
- 2. Market Dynamics Prudential Fox & Roach Supply & Demand - # Units (FS, UC, Sold) 2 Years (Monthly) 02/01/08 - 02/28/10 FOR SALE UNDER CONTRACT SOLD EXPIRED NEW LISTINGS Time Period # Properties Average DOM # Properties Average DOM # Properties Average DOM # Properties Average DOM # Properties Feb-10 4,099 207 365 86 194 103 267 253 692 Jan-10 4,085 228 338 102 244 88 340 212 772 Dec-09 4,034 251 225 92 340 86 496 204 397 Nov-09 4,336 250 315 78 556 81 384 206 555 Oct-09 4,680 248 478 86 475 82 421 205 736 Sep-09 4,868 251 480 82 430 92 444 206 803 Aug-09 4,931 255 449 82 507 77 417 199 805 Jul-09 5,006 257 470 84 510 80 410 196 834 Jun-09 5,147 258 528 85 530 85 447 196 913 May-09 5,120 263 509 82 366 93 377 226 975 Apr-09 4,930 270 420 87 317 103 365 199 1,016 Mar-09 4,668 280 413 100 297 105 341 218 939 Feb-09 4,372 295 318 95 238 92 325 230 752 Jan-09 4,352 300 290 107 225 93 442 195 708 Dec-08 4,329 303 239 97 282 88 446 189 406 Nov-08 4,602 293 245 86 300 86 434 181 518 Oct-08 4,800 286 284 82 337 81 432 193 720 Sep-08 4,935 278 354 80 418 75 501 173 905 Aug-08 4,871 276 364 75 522 76 477 173 702 Jul-08 5,181 265 484 80 551 71 528 194 886 Jun-08 5,241 262 458 72 579 67 488 209 953 May-08 5,241 256 513 65 459 79 440 167 1,113 Apr-08 5,180 256 552 77 452 80 500 201 1,195 Mar-08 4,872 260 475 80 362 96 412 185 1,148 Feb-08 4,524 269 418 84 292 92 382 264 904 BrokerMetrics® 2 of 2 03/29/10 Information not guaranteed. © 2010 - 2011 Terradatum and its suppliers and licensors (http://www.terradatum.com/metrics/licensors).