More Related Content
Similar to Philadelphia County Basic Supply and Demand
Similar to Philadelphia County Basic Supply and Demand (20)
More from Prudential Fox & Roach, Realtors
More from Prudential Fox & Roach, Realtors (20)
Philadelphia County Basic Supply and Demand
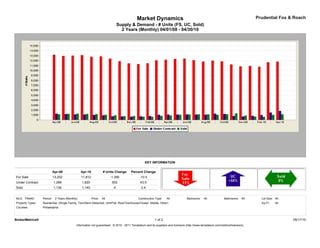
- 1. Market Dynamics Prudential Fox & Roach
Supply & Demand - # Units (FS, UC, Sold)
2 Years (Monthly) 04/01/08 - 04/30/10
KEY INFORMATION
Apr-08 Apr-10 # Units Change Percent Change
For Sale 13,202 11,812 -1,390 -10.5
Under Contract 1,268 1,820 552 43.5
Sold 1,136 1,140 4 0.4
MLS: TReND Period: 2 Years (Monthly) Price: All Construction Type: All Bedrooms: All Bathrooms: All Lot Size: All
Property Types: Residential: (Single Family, Twin/Semi-Detached, Unit/Flat, Row/Townhouse/Cluster, Mobile, Other) Sq Ft: All
Counties: Philadelphia
BrokerMetrics® 1 of 2 05/17/10
Information not guaranteed. © 2010 - 2011 Terradatum and its suppliers and licensors (http://www.terradatum.com/metrics/licensors).
- 2. Market Dynamics Prudential Fox & Roach
Supply & Demand - # Units (FS, UC, Sold)
2 Years (Monthly) 04/01/08 - 04/30/10
FOR SALE UNDER CONTRACT SOLD EXPIRED NEW LISTINGS
Time Period # Properties Average DOM # Properties Average DOM # Properties Average DOM # Properties Average DOM # Properties
Apr-10 11,812 147 1,820 67 1,140 80 1,349 186 2,928
Mar-10 11,675 172 1,490 75 1,019 77 1,301 182 2,833
Feb-10 10,777 199 986 80 626 81 949 189 1,770
Jan-10 10,924 210 841 80 668 72 1,076 184 2,333
Dec-09 10,837 229 709 74 875 73 1,537 198 1,348
Nov-09 11,233 230 807 71 1,329 75 937 181 1,683
Oct-09 11,865 228 1,219 73 1,145 74 1,096 183 2,273
Sep-09 12,001 231 1,259 75 1,033 72 1,150 197 2,326
Aug-09 11,830 238 1,053 78 1,136 75 1,102 188 2,067
Jul-09 12,085 239 1,099 73 1,131 76 1,223 189 2,087
Jun-09 12,417 240 1,119 73 1,111 83 1,300 197 2,393
May-09 12,348 244 1,092 82 1,039 75 1,232 183 2,287
Apr-09 12,179 243 1,099 77 894 82 1,019 179 2,347
Mar-09 12,070 244 1,041 77 803 83 1,197 184 2,352
Feb-09 11,478 253 797 83 629 75 963 181 2,088
Jan-09 11,301 256 724 83 636 80 1,187 185 1,993
Dec-08 11,446 258 647 78 784 75 1,491 187 1,368
Nov-08 11,887 251 717 69 756 71 1,092 159 1,709
Oct-08 12,405 243 752 72 933 64 1,475 158 2,035
Sep-08 12,870 236 933 68 1,021 68 1,567 172 2,647
Aug-08 12,788 232 1,003 72 1,165 70 1,562 166 2,281
Jul-08 13,111 227 1,092 68 1,209 68 1,512 173 2,703
Jun-08 13,027 228 1,132 69 1,277 67 1,487 187 2,627
May-08 12,940 223 1,193 67 1,232 76 1,347 151 2,524
Apr-08 13,202 218 1,268 73 1,136 76 1,518 153 3,012
BrokerMetrics® 2 of 2 05/17/10
Information not guaranteed. © 2010 - 2011 Terradatum and its suppliers and licensors (http://www.terradatum.com/metrics/licensors).