Market Dynamics in Chester County PA from 2008-2010
•
0 likes•97 views


Recommended
Recommended
More Related Content
What's hot
What's hot (15)
Similar to Market Dynamics in Chester County PA from 2008-2010
Similar to Market Dynamics in Chester County PA from 2008-2010 (16)
More from Prudential Fox & Roach, Realtors
More from Prudential Fox & Roach, Realtors (20)
Recently uploaded
Recently uploaded (20)
Market Dynamics in Chester County PA from 2008-2010
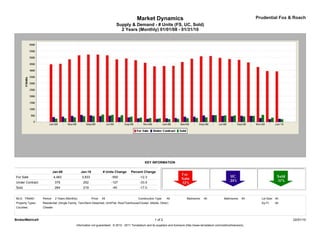
- 1. Market Dynamics Prudential Fox & Roach Supply & Demand - # Units (FS, UC, Sold) 2 Years (Monthly) 01/01/08 - 01/31/10 KEY INFORMATION Jan-08 Jan-10 # Units Change Percent Change For Sale 4,483 3,933 -550 -12.3 Under Contract 379 252 -127 -33.5 Sold 264 219 -45 -17.0 MLS: TReND Period: 2 Years (Monthly) Price: All Construction Type: All Bedrooms: All Bathrooms: All Lot Size: All Property Types: Residential: (Single Family, Twin/Semi-Detached, Unit/Flat, Row/Townhouse/Cluster, Mobile, Other) Sq Ft: All Counties: Chester BrokerMetrics® 1 of 2 02/01/10 Information not guaranteed. © 2010 - 2011 Terradatum and its suppliers and licensors (http://www.terradatum.com/metrics/licensors).
- 2. Market Dynamics Prudential Fox & Roach Supply & Demand - # Units (FS, UC, Sold) 2 Years (Monthly) 01/01/08 - 01/31/10 FOR SALE UNDER CONTRACT SOLD EXPIRED NEW LISTINGS Time Period # Properties Average DOM # Properties Average DOM # Properties Average DOM # Properties Average DOM # Properties Jan-10 3,933 189 252 100 219 88 356 211 705 Dec-09 3,961 216 227 95 335 86 506 202 394 Nov-09 4,277 221 314 78 553 81 396 207 552 Oct-09 4,630 225 476 87 473 83 429 206 735 Sep-09 4,828 232 482 82 429 91 451 209 801 Aug-09 4,893 239 447 82 506 77 419 199 800 Jul-09 4,980 244 471 84 510 80 416 196 831 Jun-09 5,126 246 528 86 530 85 449 196 910 May-09 5,109 254 510 82 366 93 383 241 975 Apr-09 4,917 263 418 88 317 103 365 199 1,010 Mar-09 4,665 274 412 101 297 105 346 221 938 Feb-09 4,370 289 317 96 238 92 326 234 751 Jan-09 4,351 295 290 107 225 93 442 195 708 Dec-08 4,328 298 239 97 282 88 446 189 406 Nov-08 4,601 289 245 86 300 86 434 181 518 Oct-08 4,799 282 284 82 336 81 432 193 720 Sep-08 4,934 275 354 80 418 75 501 173 905 Aug-08 4,870 273 364 75 522 76 477 173 702 Jul-08 5,180 263 484 80 551 71 528 194 886 Jun-08 5,241 259 459 71 579 67 488 209 953 May-08 5,241 254 513 65 458 78 440 167 1,113 Apr-08 5,180 254 552 77 452 80 500 201 1,195 Mar-08 4,872 258 475 80 362 96 412 185 1,148 Feb-08 4,524 268 418 84 292 92 382 264 904 Jan-08 4,483 270 379 92 264 86 484 179 981 BrokerMetrics® 2 of 2 02/01/10 Information not guaranteed. © 2010 - 2011 Terradatum and its suppliers and licensors (http://www.terradatum.com/metrics/licensors).