More Related Content
Similar to July 2009 Philadelphia County Sold Median Price
Similar to July 2009 Philadelphia County Sold Median Price (18)
More from Prudential Fox & Roach, Realtors
More from Prudential Fox & Roach, Realtors (20)
July 2009 Philadelphia County Sold Median Price
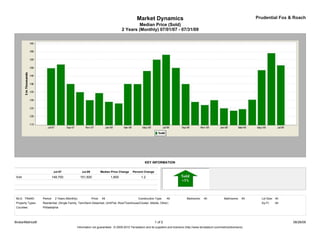
- 1. Market Dynamics Prudential Fox & Roach
Median Price (Sold)
2 Years (Monthly) 07/01/07 - 07/31/09
KEY INFORMATION
Jul-07 Jul-09 Median Price Change Percent Change
Sold 149,700 151,500 1,800 1.2
MLS: TReND Period: 2 Years (Monthly) Price: All Construction Type: All Bedrooms: All Bathrooms: All Lot Size: All
Property Types: Residential: (Single Family, Twin/Semi-Detached, Unit/Flat, Row/Townhouse/Cluster, Mobile, Other) Sq Ft: All
Counties: Philadelphia
BrokerMetrics® 1 of 2 08/26/09
Information not guaranteed. © 2009-2010 Terradatum and its suppliers and licensors (http://www.terradatum.com/metrics/licensors).
- 2. Market Dynamics Prudential Fox & Roach
Median Price (Sold)
2 Years (Monthly) 07/01/07 - 07/31/09
FOR SALE UNDER CONTRACT SOLD EXPIRED NEW LISTINGS
Time Period Median $ # Properties Median $ # Properties Median $ # Properties Median $ # Properties Median $ # Properties
Jul-09 149,900 11,521 149,900 1,134 151,500 1,125 145,000 1,357 139,999 2,065
Jun-09 149,900 11,989 150,000 1,144 159,000 1,105 149,900 1,389 149,900 2,380
May-09 150,000 12,016 159,900 1,105 148,500 1,033 146,100 1,302 149,000 2,276
Apr-09 152,250 11,931 165,000 1,115 130,300 891 141,500 1,076 159,900 2,336
Mar-09 149,900 11,898 139,900 1,057 124,450 802 139,900 1,246 154,987 2,348
Feb-09 145,000 11,352 134,900 808 123,500 624 139,900 994 144,000 2,087
Jan-09 149,900 11,206 139,900 730 125,000 634 159,700 1,211 134,900 1,986
Dec-08 149,900 11,371 129,900 648 130,000 782 140,000 1,503 129,900 1,365
Nov-08 149,900 11,821 129,900 717 127,000 754 155,500 1,098 139,900 1,705
Oct-08 149,900 12,352 129,900 755 128,932 930 139,900 1,481 139,900 2,033
Sep-08 149,900 12,826 134,900 936 139,950 1,020 159,000 1,571 154,900 2,647
Aug-08 149,900 12,747 140,450 1,006 149,900 1,164 149,900 1,562 135,000 2,280
Jul-08 151,778 13,068 149,900 1,091 158,000 1,208 158,500 1,511 145,000 2,704
Jun-08 154,900 12,983 152,825 1,132 155,000 1,277 154,400 1,486 150,000 2,627
May-08 154,900 13,072 159,900 1,196 148,000 1,221 149,900 1,347 154,900 2,524
Apr-08 155,000 13,169 159,900 1,271 139,900 1,135 150,000 1,517 159,900 3,012
Mar-08 151,450 12,844 145,000 1,241 140,000 1,077 149,000 1,591 159,000 2,881
Feb-08 149,900 12,500 149,400 1,122 128,000 892 143,900 1,411 146,500 2,489
Jan-08 149,900 12,596 139,900 1,015 129,000 879 164,900 1,544 149,900 2,867
Dec-07 149,900 12,381 130,450 760 134,400 1,060 149,000 1,869 129,900 1,630
Nov-07 149,900 13,242 130,000 1,013 130,000 1,095 150,000 1,473 139,900 2,231
Oct-07 149,900 14,056 129,900 1,211 134,950 1,172 155,000 1,815 139,900 3,023
Sep-07 155,000 13,868 140,000 1,032 140,000 1,115 164,900 1,793 149,900 3,018
Aug-07 154,900 13,649 142,000 1,185 152,000 1,521 149,900 1,601 140,000 2,941
Jul-07 159,000 13,518 149,900 1,321 149,700 1,494 163,900 1,483 145,000 3,020
BrokerMetrics® 2 of 2 08/26/09
Information not guaranteed. © 2009-2010 Terradatum and its suppliers and licensors (http://www.terradatum.com/metrics/licensors).