More Related Content
Similar to Philadelphia County Sold Median Price
Similar to Philadelphia County Sold Median Price (18)
More from Prudential Fox & Roach, Realtors
More from Prudential Fox & Roach, Realtors (20)
Philadelphia County Sold Median Price
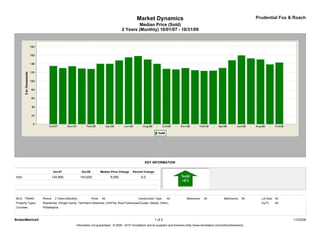
- 1. Market Dynamics Prudential Fox & Roach
Median Price (Sold)
2 Years (Monthly) 10/01/07 - 10/31/09
KEY INFORMATION
Oct-07 Oct-09 Median Price Change Percent Change
Sold 134,950 143,000 8,050 6.0
MLS: TReND Period: 2 Years (Monthly) Price: All Construction Type: All Bedrooms: All Bathrooms: All Lot Size: All
Property Types: Residential: (Single Family, Twin/Semi-Detached, Unit/Flat, Row/Townhouse/Cluster, Mobile, Other) Sq Ft: All
Counties: Philadelphia
BrokerMetrics® 1 of 2 11/23/09
Information not guaranteed. © 2009 - 2010 Terradatum and its suppliers and licensors (http://www.terradatum.com/metrics/licensors).
- 2. Market Dynamics Prudential Fox & Roach
Median Price (Sold)
2 Years (Monthly) 10/01/07 - 10/31/09
FOR SALE UNDER CONTRACT SOLD EXPIRED NEW LISTINGS
Time Period Median $ # Properties Median $ # Properties Median $ # Properties Median $ # Properties Median $ # Properties
Oct-09 144,900 11,297 139,900 1,223 143,000 1,126 141,900 1,223 149,900 2,239
Sep-09 140,000 11,594 139,900 1,297 138,500 1,032 139,500 1,239 139,900 2,306
Aug-09 142,900 11,524 149,900 1,064 150,000 1,127 139,900 1,172 135,000 2,028
Jul-09 148,000 11,889 149,900 1,121 152,500 1,135 147,950 1,272 139,000 2,081
Jun-09 149,900 12,279 152,500 1,130 159,450 1,108 149,900 1,341 149,900 2,386
May-09 150,000 12,241 160,000 1,091 148,250 1,038 149,000 1,257 148,500 2,280
Apr-09 152,900 12,100 167,900 1,105 130,300 893 144,638 1,034 159,900 2,346
Mar-09 149,900 12,019 139,900 1,046 124,000 799 139,900 1,219 154,900 2,351
Feb-09 145,900 11,447 134,900 806 123,500 628 139,900 973 142,000 2,089
Jan-09 149,900 11,277 139,900 727 125,000 634 159,350 1,192 134,000 1,987
Dec-08 149,900 11,430 129,900 649 130,000 784 140,000 1,491 129,900 1,365
Nov-08 149,900 11,874 129,900 717 127,000 755 157,500 1,092 139,900 1,709
Oct-08 149,900 12,397 129,900 755 128,250 932 139,900 1,477 139,900 2,035
Sep-08 149,900 12,861 134,900 933 139,900 1,021 159,000 1,566 154,900 2,647
Aug-08 149,900 12,780 140,450 1,004 149,900 1,164 149,900 1,562 135,000 2,281
Jul-08 153,800 13,102 149,900 1,092 158,000 1,208 158,500 1,511 145,000 2,703
Jun-08 155,000 13,017 152,825 1,132 155,000 1,277 154,400 1,486 150,000 2,627
May-08 155,000 12,932 159,900 1,195 148,000 1,221 149,900 1,347 154,900 2,524
Apr-08 156,500 13,197 159,700 1,272 139,900 1,135 150,000 1,517 159,900 3,012
Mar-08 152,900 13,017 145,000 1,241 140,000 1,076 149,000 1,591 159,000 2,881
Feb-08 149,900 12,668 149,000 1,121 128,000 893 143,900 1,411 146,500 2,489
Jan-08 149,900 12,738 139,900 1,015 129,000 879 164,900 1,544 149,900 2,867
Dec-07 149,900 12,501 130,900 759 134,400 1,060 149,000 1,871 129,900 1,630
Nov-07 149,900 13,361 130,000 1,012 130,000 1,095 152,000 1,478 139,900 2,232
Oct-07 149,950 14,156 129,900 1,211 134,950 1,172 155,000 1,816 139,900 3,023
BrokerMetrics® 2 of 2 11/23/09
Information not guaranteed. © 2009 - 2010 Terradatum and its suppliers and licensors (http://www.terradatum.com/metrics/licensors).