Downloaded 139 times
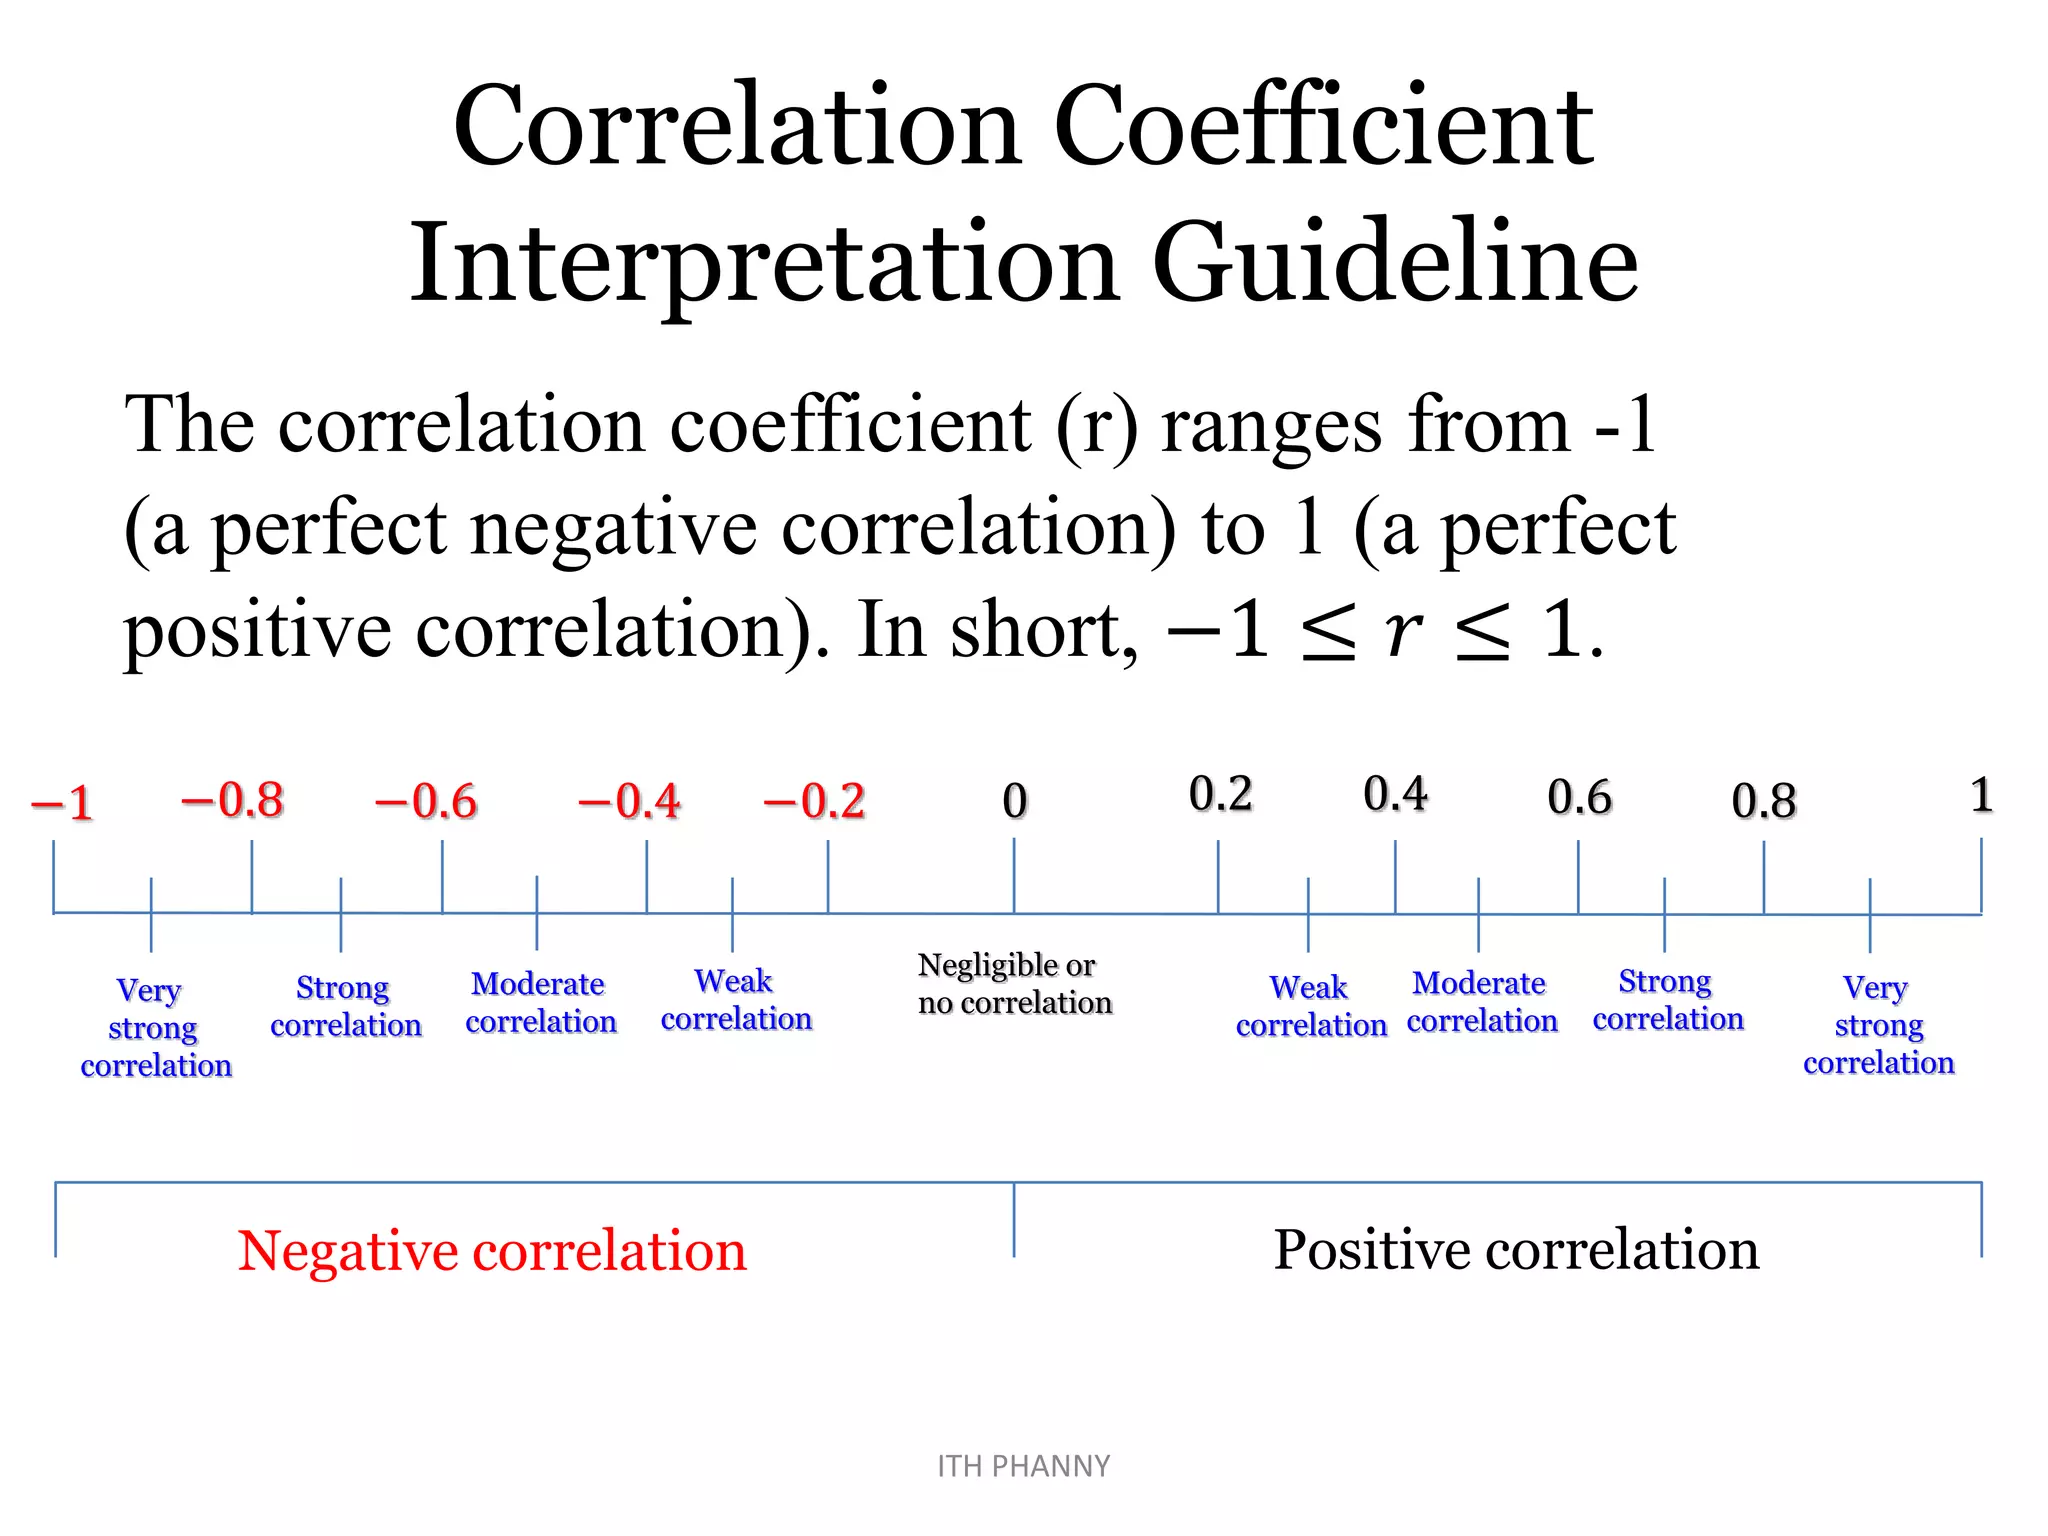
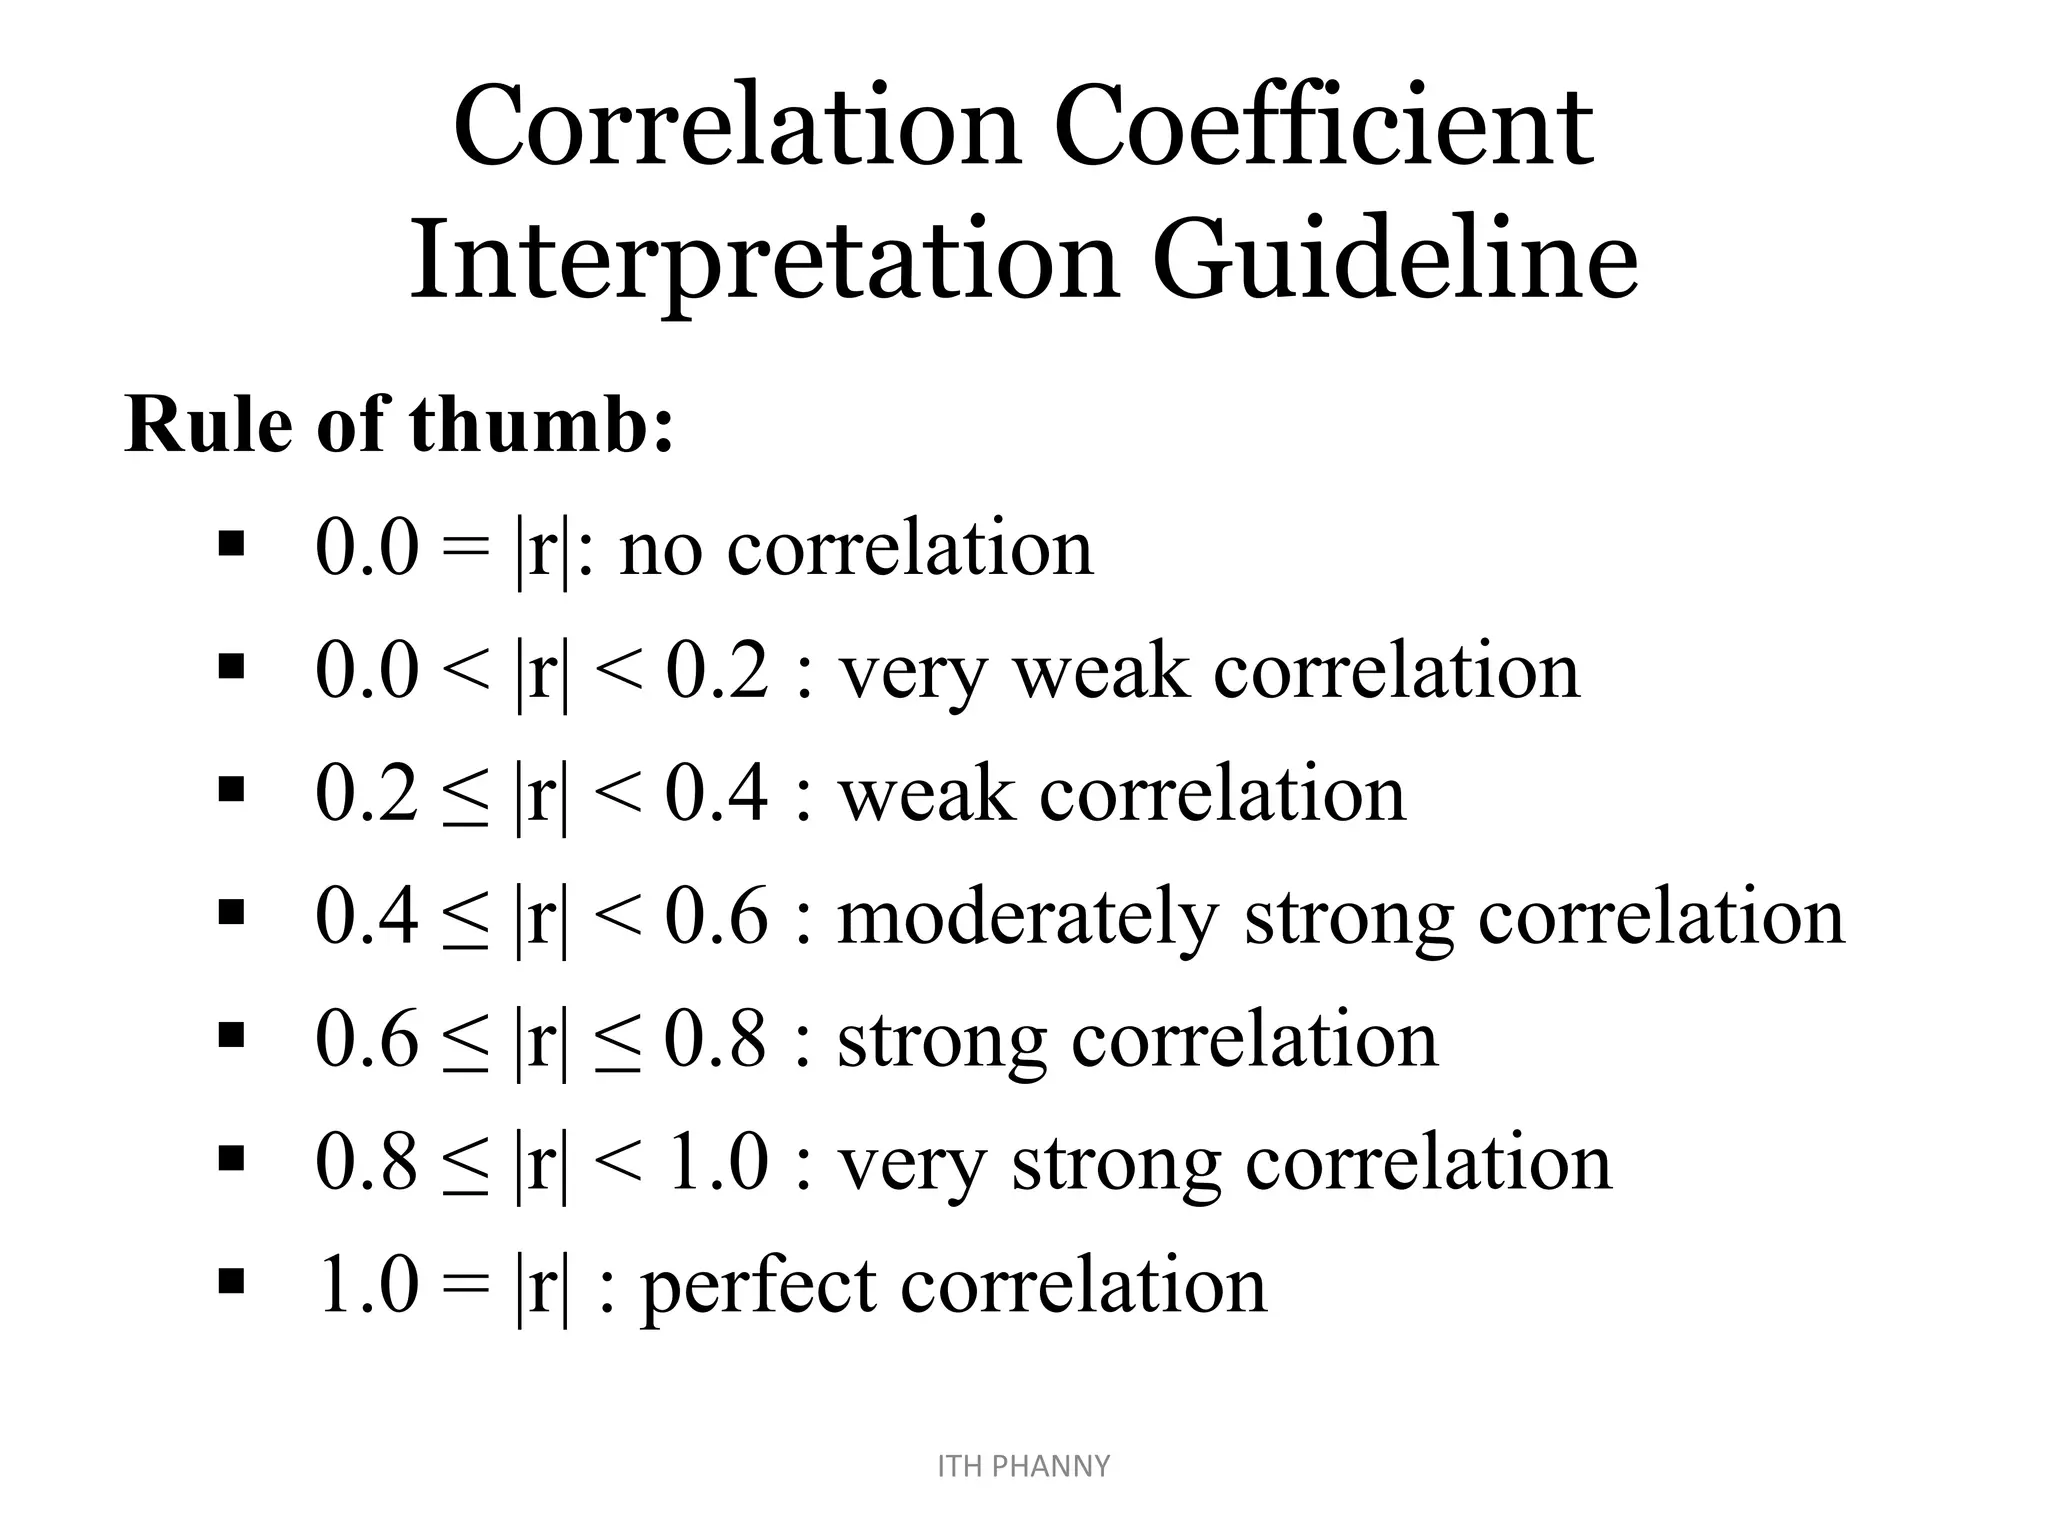

The document provides a guideline for interpreting correlation coefficients. It explains that correlation coefficients range from -1 to 1, with -1 indicating a perfect negative correlation and 1 indicating a perfect positive correlation. It then provides a rule of thumb for classifying the strength of correlation based on the coefficient value, with higher positive or negative values indicating stronger correlations.