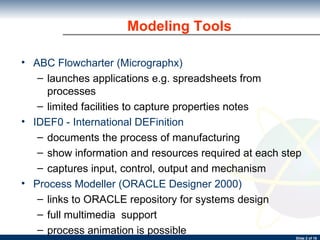
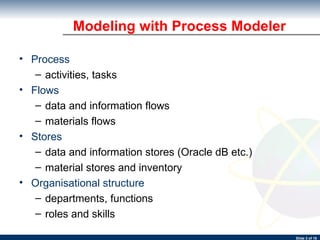
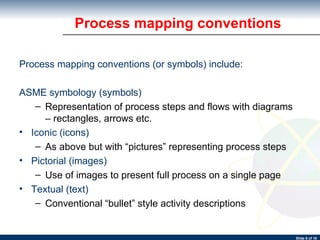
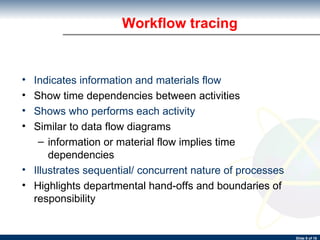
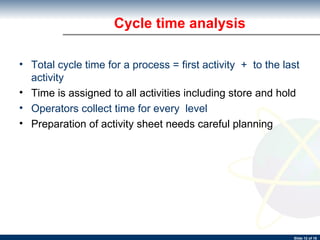
Business Process Re-engineering 06 – Process Modeling Tools; Analysis Tools and Techniques
Modeling Tools ABC Flowcharter (Micrographx) launches applications e.g. spreadsheets from processes  limited facilities to capture properties notes IDEF0 - International DEFinition  documents the process of manufacturing show information and resources required at each step captures input, control, output and mechanism Process Modeller (ORACLE Designer 2000) links to ORACLE repository for systems design full multimedia  support process animation is possible
Modeling with Process Modeler Process activities, tasks Flows data and information flows materials flows Stores data and information stores (Oracle dB etc.) material stores and inventory Organisational structure departments, functions roles and skills
Modeling with Process Modeler Trigger:  an external event that causes a process or process step to occur: e.g. customer sends P.O. (Purchase Order) to purchase equipment or service Outcome:  the primary observable result of having completed a process: e.g. customer has received and installed equipment or service
Analysing with Process Modeler Capture activity wait, processing and elapsed times perform critical path analysis animate the process Capture fixed and variable cost data produce activity based costing reports export to spreadsheets Capture process inefficiencies and “root causes” associate free text with activities export to spreadsheets
Process mapping conventions Process mapping conventions (or symbols) include: ASME symbology (symbols) Representation of process steps and flows with diagrams – rectangles, arrows etc. Iconic (icons) As above but with “pictures” representing process steps Pictorial (images) Use of images to present full process on a single page Textual (text) Conventional “bullet” style activity descriptions
IDEF process mapping concept Process activity graphics representation Conciseness Communication Strict and accurate Consistent methodology Organisation and function
Analysis tools & techniques Tools or techniques to analyse processes include: Workflow tracing Activity based costing (ABC) analysis Cycle-time analysis Problem analysis Structured brainstorming  Ishikawa (cause-effect) analysis
Workflow tracing Indicates information and materials flow Show time dependencies between activities Shows who performs each activity Similar to data flow diagrams information or material flow implies time dependencies Illustrates sequential/ concurrent nature of processes Highlights departmental hand-offs and boundaries of responsibility
Workflow tracing “ Walk through the process - with someone who knows it!! Tag a document or work item and follow it through the process - note times, decisions, problems etc. Avoid skewing results the items you are following should not get preferential treatment This is very time consuming: use only when other methods don’t provide enough information
Activity-based Costing First build the process model by activity Use the model to build an activity dictionary In workshop(s) assign “rough cut” costs to activities Use supervisors to assign costs
Cycle time analysis Total cycle time for a process = first activity  +  to the last activity Time is assigned to all activities including store and hold Operators collect time for every  level Preparation of activity sheet needs careful planning
Cycle time analysis Customers Sales Clerks Sales Managers Financial Managers Financial staff Warehouse Call  to place an order Accept order  terms Negotiate order changes Input order details Confirm  availability and accept terms Approve order Call customer to change order Approve  order Inventory report Process credit card information Order  sent to warehouse Average elapsed time for order:3 hours Full time equivalent employees: 42 First time approvals (no errors) 85% Order promises kept 92%
Problem analysis Objectives: to identify “root causes” of the weaknesses identified in current processes to identify opportunities for improvement Techniques for problem analysis include: structured “brainstorming” Ishikawa (cause and effect)
Structured Brainstorming Rules for brainstorming: Focus on the topic  Any idea is allowed  Build on previous ideas No criticism of any idea -  there are no bad ideas Leader keeps ideas flowing  Capture every idea
Ishikawa (Fishbone Analysis) Materials Manpower Machines Methods Effect Causes
Ishikawa (Fishbone Analysis) Define the problem accurately in  few words Use brainstorm method as a warm-up technique to list as many causes as possible   Review causes and group them into major categories Label each “bone” on the diagram and list with causes Make a further check up to confirm the root causes
Opportunities for improvement The results of process analysis is opportunities for improvement, some of which are : Identifying problems attack root causes Recognising process analysis patterns redundant activities (not used) duplicate activities time delays (documents waiting to be processed) lack of clear responsibility (i.e. no process owner)

Bpr 06 Process Modeling Tools

  • 1.
    Business Process Re-engineering06 – Process Modeling Tools; Analysis Tools and Techniques
  • 2.
    Modeling Tools ABCFlowcharter (Micrographx) launches applications e.g. spreadsheets from processes limited facilities to capture properties notes IDEF0 - International DEFinition documents the process of manufacturing show information and resources required at each step captures input, control, output and mechanism Process Modeller (ORACLE Designer 2000) links to ORACLE repository for systems design full multimedia support process animation is possible
  • 3.
    Modeling with ProcessModeler Process activities, tasks Flows data and information flows materials flows Stores data and information stores (Oracle dB etc.) material stores and inventory Organisational structure departments, functions roles and skills
  • 4.
    Modeling with ProcessModeler Trigger: an external event that causes a process or process step to occur: e.g. customer sends P.O. (Purchase Order) to purchase equipment or service Outcome: the primary observable result of having completed a process: e.g. customer has received and installed equipment or service
  • 5.
    Analysing with ProcessModeler Capture activity wait, processing and elapsed times perform critical path analysis animate the process Capture fixed and variable cost data produce activity based costing reports export to spreadsheets Capture process inefficiencies and “root causes” associate free text with activities export to spreadsheets
  • 6.
    Process mapping conventionsProcess mapping conventions (or symbols) include: ASME symbology (symbols) Representation of process steps and flows with diagrams – rectangles, arrows etc. Iconic (icons) As above but with “pictures” representing process steps Pictorial (images) Use of images to present full process on a single page Textual (text) Conventional “bullet” style activity descriptions
  • 7.
    IDEF process mappingconcept Process activity graphics representation Conciseness Communication Strict and accurate Consistent methodology Organisation and function
  • 8.
    Analysis tools &techniques Tools or techniques to analyse processes include: Workflow tracing Activity based costing (ABC) analysis Cycle-time analysis Problem analysis Structured brainstorming Ishikawa (cause-effect) analysis
  • 9.
    Workflow tracing Indicatesinformation and materials flow Show time dependencies between activities Shows who performs each activity Similar to data flow diagrams information or material flow implies time dependencies Illustrates sequential/ concurrent nature of processes Highlights departmental hand-offs and boundaries of responsibility
  • 10.
    Workflow tracing “Walk through the process - with someone who knows it!! Tag a document or work item and follow it through the process - note times, decisions, problems etc. Avoid skewing results the items you are following should not get preferential treatment This is very time consuming: use only when other methods don’t provide enough information
  • 11.
    Activity-based Costing Firstbuild the process model by activity Use the model to build an activity dictionary In workshop(s) assign “rough cut” costs to activities Use supervisors to assign costs
  • 12.
    Cycle time analysisTotal cycle time for a process = first activity + to the last activity Time is assigned to all activities including store and hold Operators collect time for every level Preparation of activity sheet needs careful planning
  • 13.
    Cycle time analysisCustomers Sales Clerks Sales Managers Financial Managers Financial staff Warehouse Call to place an order Accept order terms Negotiate order changes Input order details Confirm availability and accept terms Approve order Call customer to change order Approve order Inventory report Process credit card information Order sent to warehouse Average elapsed time for order:3 hours Full time equivalent employees: 42 First time approvals (no errors) 85% Order promises kept 92%
  • 14.
    Problem analysis Objectives:to identify “root causes” of the weaknesses identified in current processes to identify opportunities for improvement Techniques for problem analysis include: structured “brainstorming” Ishikawa (cause and effect)
  • 15.
    Structured Brainstorming Rulesfor brainstorming: Focus on the topic Any idea is allowed Build on previous ideas No criticism of any idea - there are no bad ideas Leader keeps ideas flowing Capture every idea
  • 16.
    Ishikawa (Fishbone Analysis)Materials Manpower Machines Methods Effect Causes
  • 17.
    Ishikawa (Fishbone Analysis)Define the problem accurately in few words Use brainstorm method as a warm-up technique to list as many causes as possible Review causes and group them into major categories Label each “bone” on the diagram and list with causes Make a further check up to confirm the root causes
  • 18.
    Opportunities for improvementThe results of process analysis is opportunities for improvement, some of which are : Identifying problems attack root causes Recognising process analysis patterns redundant activities (not used) duplicate activities time delays (documents waiting to be processed) lack of clear responsibility (i.e. no process owner)